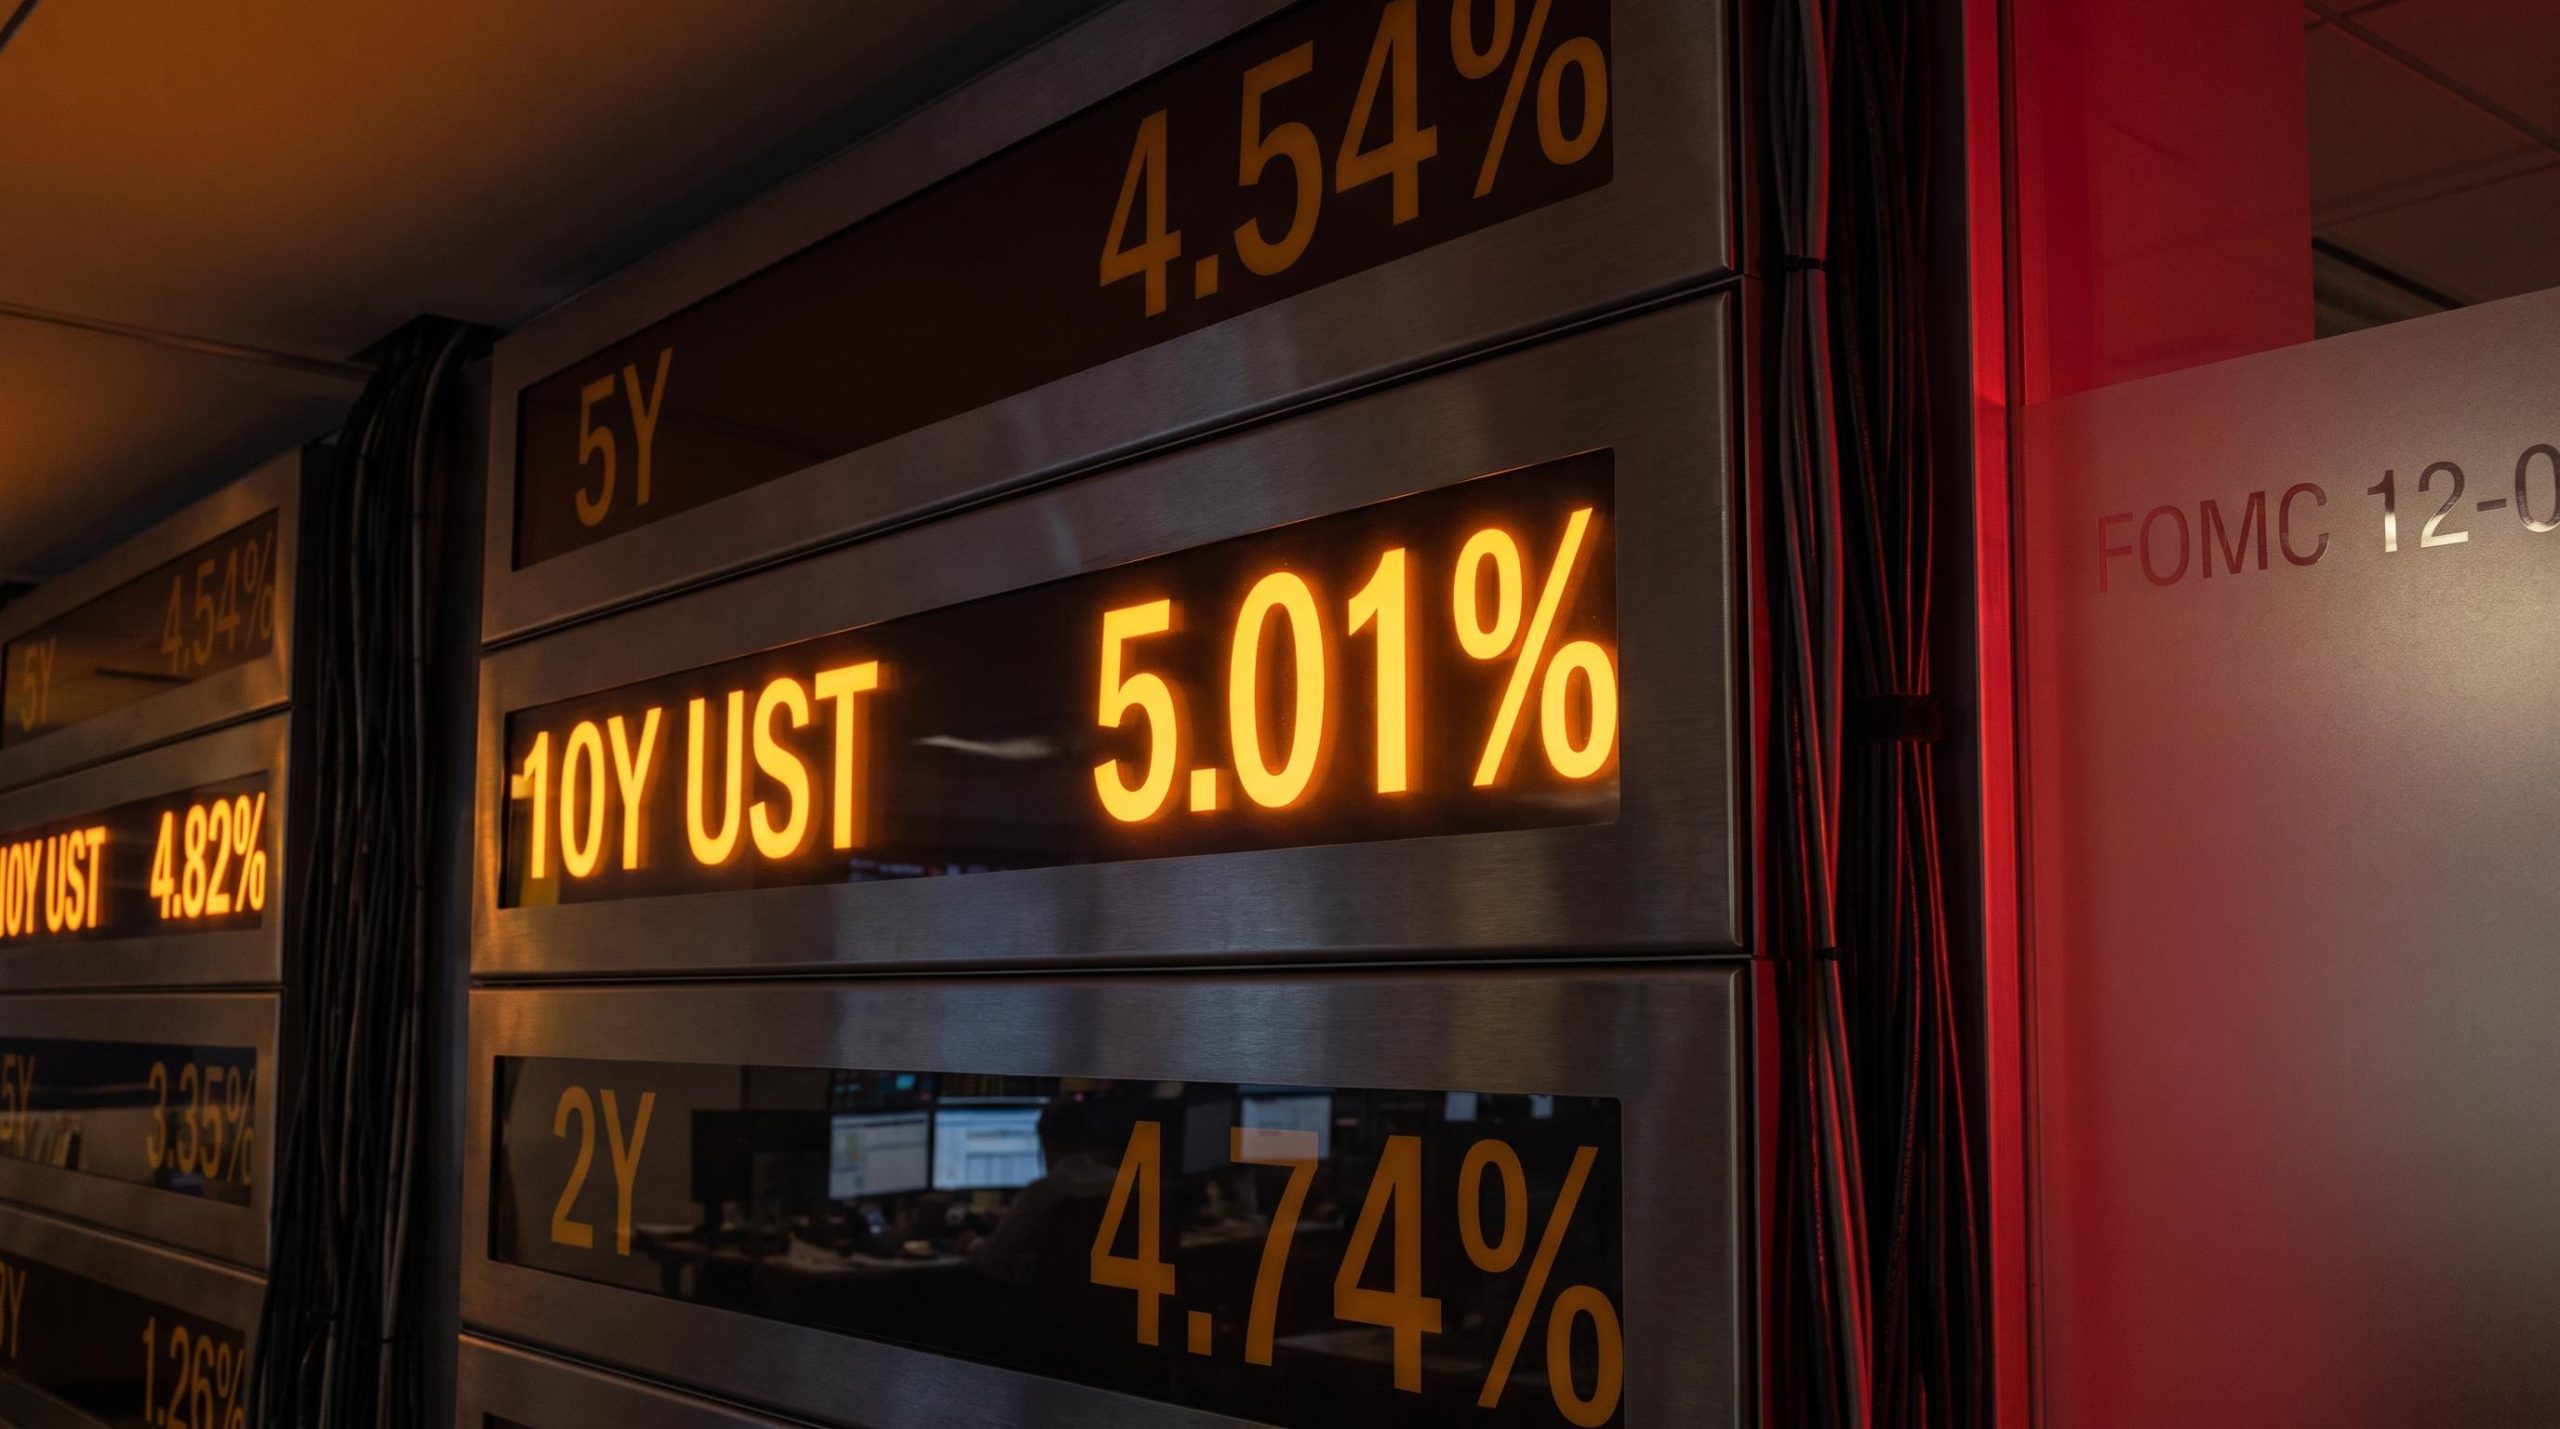
The 10-year Treasury yield just touched 5.01% on 14 September 2026, its highest reading since 2023, and two days later the Federal Reserve raised rates again on a unanimous 12-0 vote. If a rate-cut thesis for late 2026 still sits at the centre of your portfolio, this is where that thesis meets its stress test.
Two forces are converging on the US interest rate outlook, and they reinforce each other rather than cancel out. The Iran conflict broke a developing Treasury recovery in late February 2026, reversing price trends that had been forming at the same time across the 2-year, 5-year, and 10-year markets. Beneath that geopolitical shock sits a structural problem that predates the war: federal debt has crossed $40 trillion on a trajectory that has climbed exponentially since 2001, and the implied supply of government borrowing is now large enough to push term premiums to their highest levels in roughly twelve years.
This piece maps both forces against the historical record and current Fed guidance so you can form a grounded view on whether yields fall, hold, or push higher into late 2026. Here is the evidence, here is what it means, and here is the one structural condition that would need to change before the rate-cut case becomes credible again.
How the Iran conflict killed the Treasury rally before it started
For a few weeks in early 2026, the bond market looked ready to turn. The last pre-conflict trading session for 10-year note futures fell at roughly 27 February 2026, and up to that point prices had been building the kind of base that usually precedes a recovery. Then the war arrived, prices fell sharply, and the developing rally never materialised.
What makes this a macro event rather than routine repricing is the synchronisation. The 2-year, 5-year, and 10-year notes were all forming similar base patterns at the same time, and they all reversed at the same time. Yields have stayed elevated across the curve since:
- 10-year Treasury note: 5.01% on 14 September 2026, easing to 4.97-4.99% by 16 September
- 5-year Treasury note: 4.54% on 4 September 2026
- 2-year Treasury note: 4.74% on 16 September 2026
The 5.01% print on 14 September 2026 was the highest 10-year yield since 2023.
The mechanism matters here. This was not a general flight from risk assets; it was a repricing of inflation risk driven specifically by a war affecting Middle East energy supply. That distinction changes how durable the move is likely to be.
The oil and inflation transmission channel connecting the Iran conflict to Treasury yields operates through a specific sequence: higher crude prices raise inflation expectations, push back central bank easing timelines, and reprice the entire sovereign yield curve, a mechanism Goldman Sachs estimates adds several tenths of a percentage point to US headline CPI per sustained $10-$20 per barrel increase.
Why three maturities reversing together changes the interpretation
When the short, medium, and long ends of the curve move in lockstep, they are responding to something shared. Duration-specific supply pressures or technical positioning tend to hit one part of the curve harder than another. A synchronised reversal across three maturities does not fit that pattern.
That is the analytical basis for pinning the reversal on the Iran conflict rather than on idiosyncratic shifts in demand for any single maturity. The read for you is straightforward: what broke the Treasury recovery was a macro-level repricing of inflation risk, and that repricing has not unwound. Current yield levels reflect a durable reset, not a temporary shock waiting to fade, which is why positioning for a snap-back across the curve carries more risk than it appears.
When big ASX news breaks, our subscribers know first
What $40 trillion in federal debt is doing to the rate environment
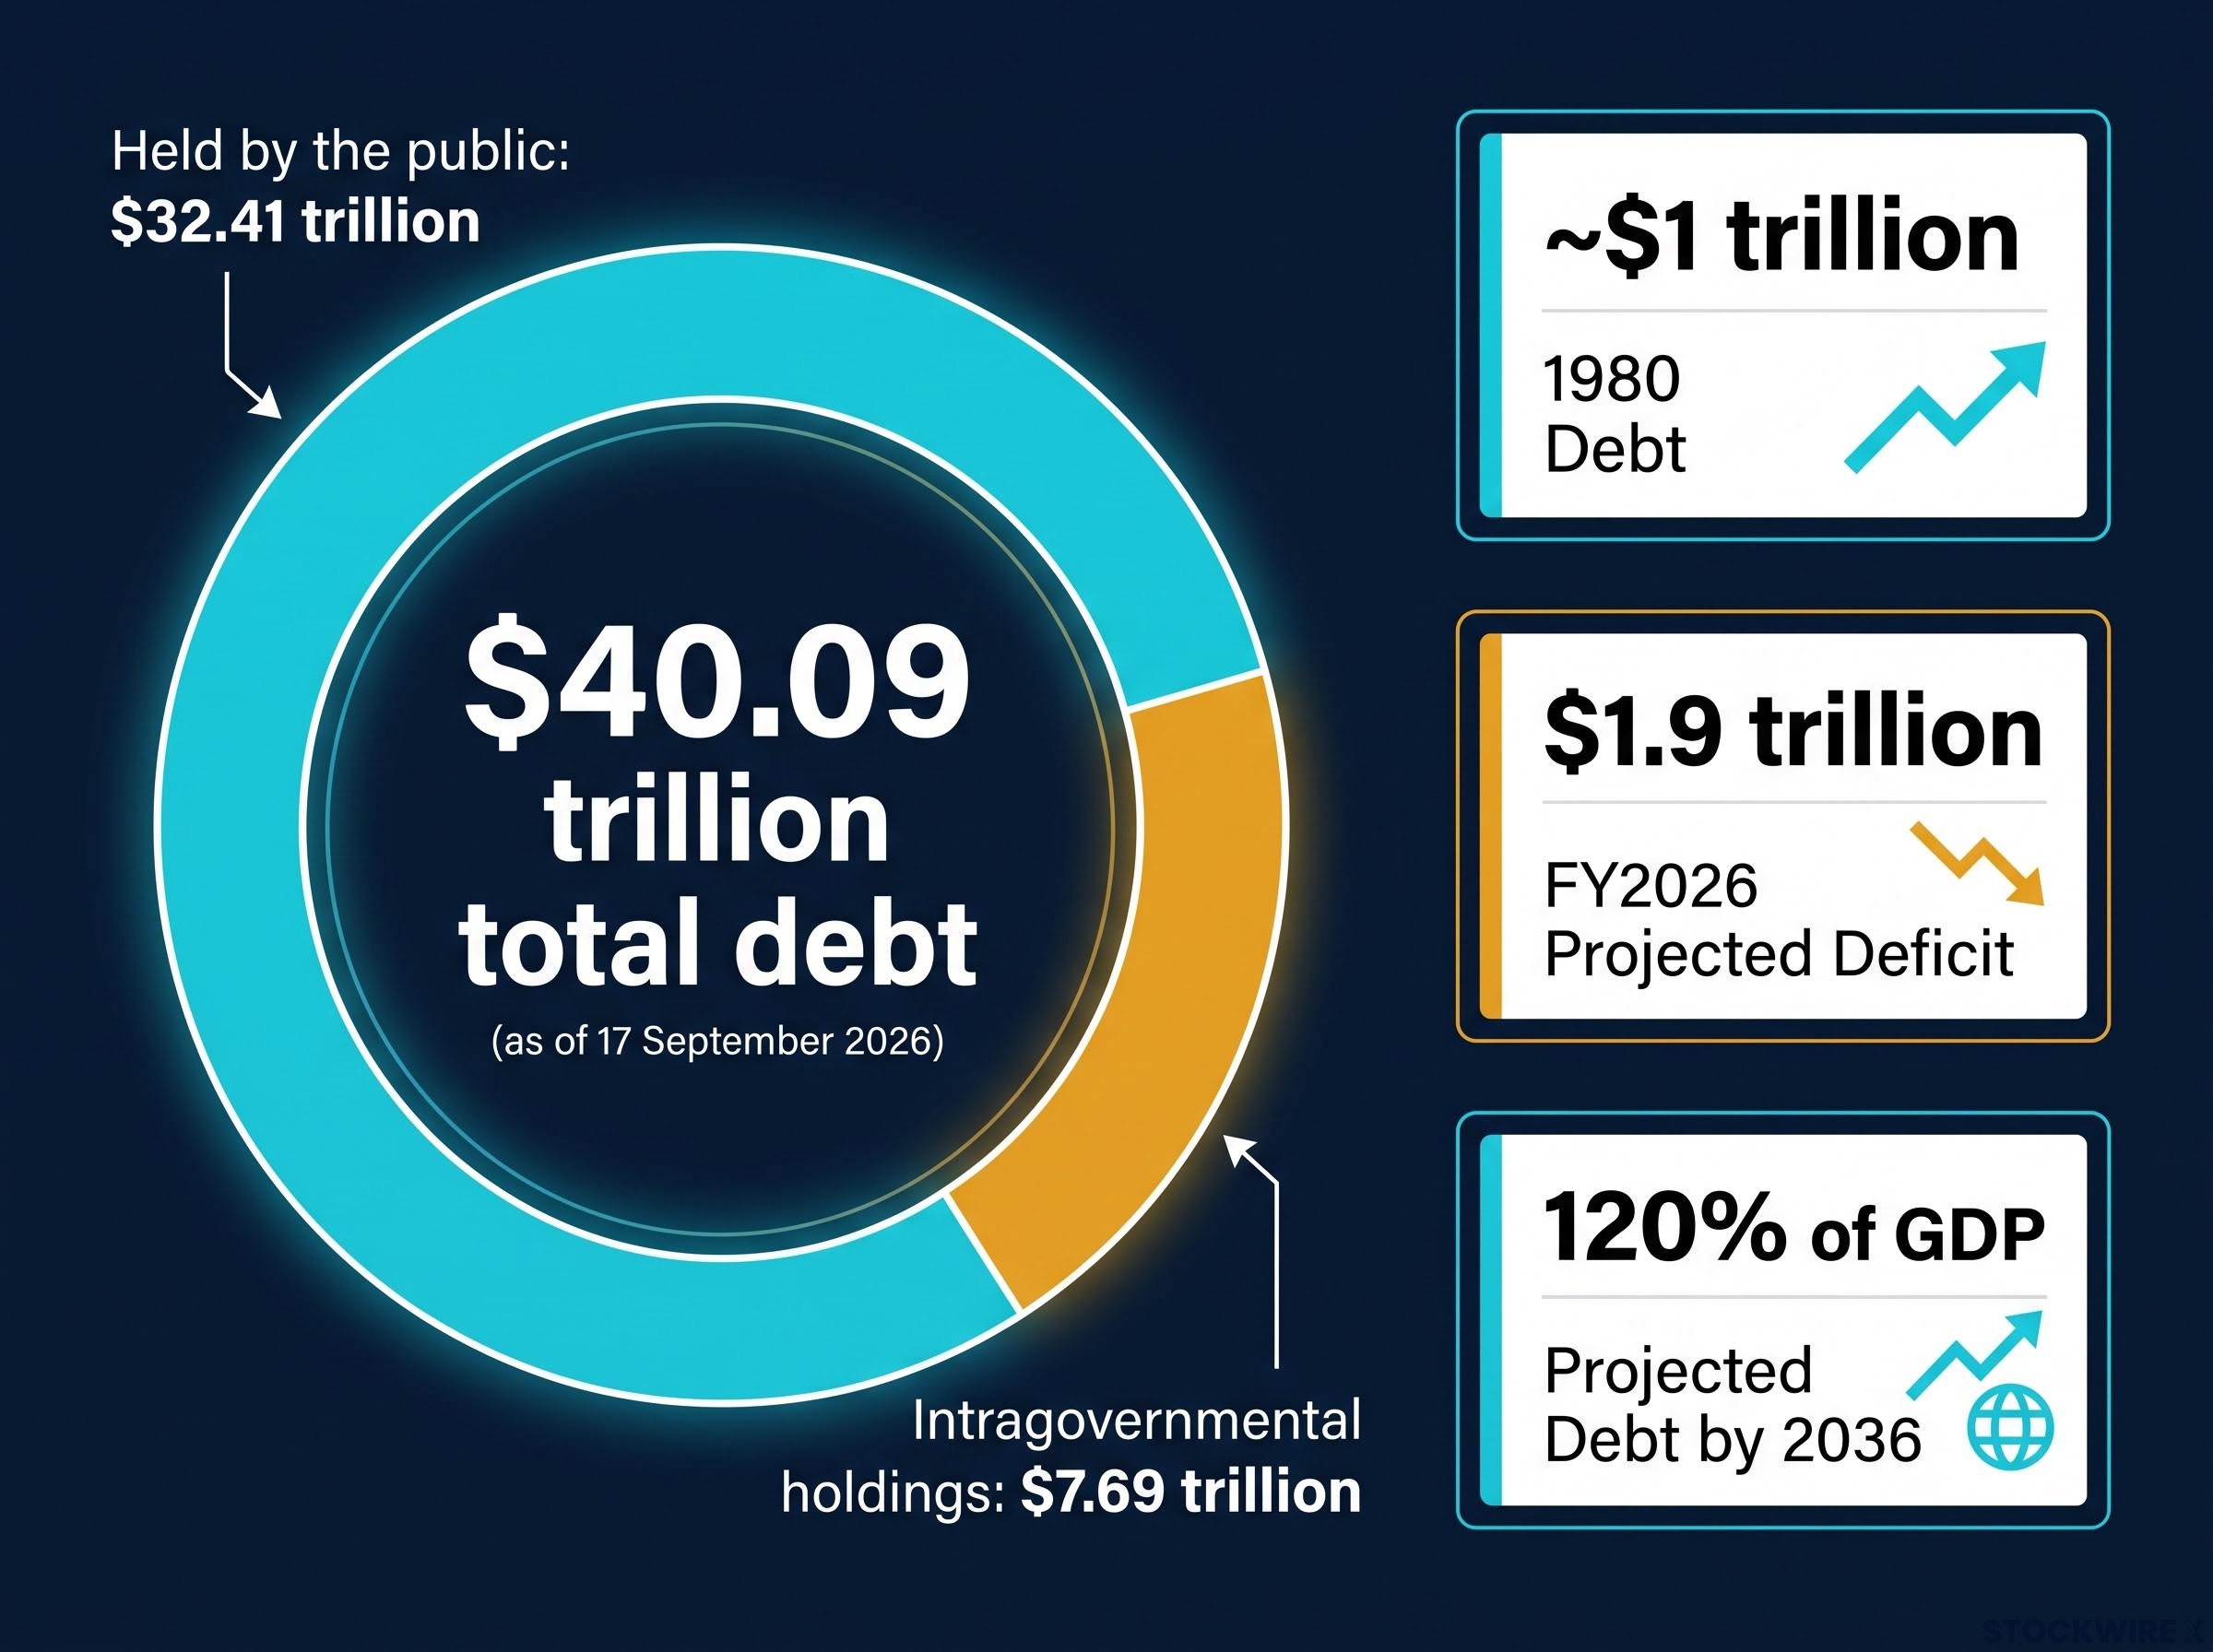
Picture the debt as a curve on a chart. Around 1980 it sat near $1 trillion. Since 2001 it has climbed on a steepening, logarithmic path that leaves the earlier decades looking almost flat by comparison.
In 1980, the entire federal debt was roughly $1 trillion. Elon Musk’s net worth today would have covered all of it back then. Now that same fortune would not cover a single year of interest payments to bondholders.
The current figure is $40.09 trillion as of 17 September 2026, split into roughly $32.41 trillion held by the public and $7.69 trillion in intragovernmental holdings. The Congressional Budget Office (CBO) projects a deficit of about $1.9 trillion for FY2026, with debt rising toward 120% of GDP by 2036.
Fiscal deterioration of this scale has a specific and measurable transmission path: net interest outlays have already surpassed defence spending at roughly $881 billion in FY2024, confirming that the budget pressure is a present-tense reality that compounds the supply pressure keeping term premiums elevated.
The transmission from debt supply into term premiums
Rising debt raises long-term rates modestly but measurably, mostly through term premiums. Empirical estimates cluster in a narrow band:
| Institution | Estimated Sensitivity | Notes |
|---|---|---|
| CBO | 2-3 bps | Average long-run effect per 1pp rise in debt-to-GDP |
| Dallas Fed | 3 bps | Three-quarters or more flows through term premiums |
| Fed Board | 3-4 bps | 2026 working paper; effect concentrated in term premium |
| Mercatus Center | ~4.6 bps | Central estimate, upper end of the range |
A 2026 Fed Board working paper estimates that a 1-percentage-point rise in the expected debt-to-GDP ratio lifts the 10-year term premium by about 2-3 basis points. Scale that across the debt trajectory and the pressure becomes concrete: the 10-year term premium now sits at roughly 80-100 basis points, its highest in about twelve years.
That is not a technical footnote. It means the bond market is charging the US government a meaningful premium for the uncertainty of carrying this debt load, and that cost feeds into every long-duration rate in the economy. For you, it explains why yields can stay high even if the Fed stops hiking: the market itself is demanding more compensation for duration risk, independent of where the funds rate sits.
The global supports that used to absorb this debt are fading
Debt supply does not set yields on its own. A Bank of England working paper shows that global savings gluts, foreign official purchases, and quantitative easing (QE) previously held real rates down even as debt climbed.
Those forces are now materially weaker. With less of that suppressive demand in the system, the raw effect of heavy Treasury supply on term premiums is far more exposed than it was a decade ago.
Understanding term premiums: the market mechanism most investors overlook
You would notice a rising term premium as a stubbornly high long-end yield that refuses to fall even when short-rate expectations soften. That is the signal. The mechanics behind it explain why the current environment is unusual.
A term premium is the extra yield investors demand for accepting duration risk, over and above what they expect short-term rates to average across the life of the bond. When it rises, buyers are asking to be paid more simply for locking their money up for longer.
The same term premium mechanics are reshaping sovereign bond markets far beyond US borders, with Japanese JGB yields crossing 3% for the first time since 1996 and UK gilts simultaneously hitting multi-decade highs, a global synchronisation that confirms the force is structural rather than a US-specific fiscal event.
Four drivers are keeping it elevated in 2026:
- Rising fiscal supply: heavy deficits and mounting Treasury issuance push more long-dated paper into the market.
- Higher-for-longer Fed expectations: a tighter expected policy path lifts the compensation buyers require.
- Geopolitical risk: the Iran conflict and energy-supply uncertainty add a risk charge to duration.
- Inflation uncertainty: the wider the range of plausible inflation outcomes, the more investors demand to hold long bonds.
Estimates from TD Economics, Payden and Rygel, Truist, SEI, and the New York Fed place the 10-year term premium at roughly 80-100 basis points in late 2026, its highest in about twelve years.
Here is the distinction that matters for positioning. Some yield increases come from higher expected short rates; others come from a rising term premium. Analysis from CICC suggests roughly 52 basis points of the January-to-August 2026 rise in the 10-year yield reflected higher short-rate expectations, though that decomposition is not independently confirmed and should be read with caution. The Fed Board finds that three-quarters or more of the debt-to-rate effect comes through term premiums rather than expected short-term real rates.
If most of the elevation is term-premium driven, then yields can stay high even after the Fed cuts. Anyone pricing a clean return to 2021-era rates once the Fed pivots is working from the wrong model, because the term premium does not fall mechanically with the funds rate.
What the Fed’s September 2026 decision signals about the path forward
On 16 September 2026, the FOMC raised the target range for the federal funds rate by 25 basis points to 3.75-4.00% on a unanimous 12-0 vote. The statement pointed to solid economic activity, elevated inflation, and heightened uncertainty from geopolitical developments, framing continued restraint as the route back to the 2% goal.
Chair Kevin Warsh reinforced the message, keeping the focus squarely on price stability.
“Inflation has been too high for too long,” Warsh said, signalling that policy would stay restrictive and that further tightening remained possible.
A unanimous vote paired with explicit language about additional tightening tells you the base case is continued restriction, not a pivot. The burden of proof has shifted: it now sits on the data that would force the Fed’s hand, not on the Fed finding reasons to stay hawkish.
The conditions that would change this picture
Two things would need to happen together before an early cut became credible:
- A clear labour market break: sharply rising unemployment, not a gentle softening trend.
- Sustained core disinflation: falling core inflation across multiple readings, not a one-month dip the Fed could dismiss as noise.
Neither is currently in the data. Market consensus reflects that: a Reuters economist poll in June 2026 showed a majority expecting no cuts through year-end, and April 2026 market pricing put the probability of no cuts by year-end at roughly 69%.
There are dissenting forecasts. Bankrate, Morningstar, Goldman Sachs, and Barclays have projected cuts in late 2026. Those calls rest on the assumption that the labour market cracks and core inflation eases in tandem. Until both appear, they remain minority views resting on conditions that have not yet materialised, and with a $1.9 trillion deficit sustaining Treasury supply, the pressure on the long end persists regardless.
What the historical record says about where yields go from here
Long-run Treasury yield data stretches back to the Kennedy administration in the early 1960s, and that depth is what gives the current episode its context. Measured against six decades of history, the velocity of the 2026 yield increase looks unusual.
Set the current inflation episode beside the 1970s-1980s, and the comparison is instructive on both sides.
Parallels:
- An energy-driven supply shock feeding inflation
- Inflation proving persistent rather than transitory
- An aggressive central bank response
Key differences:
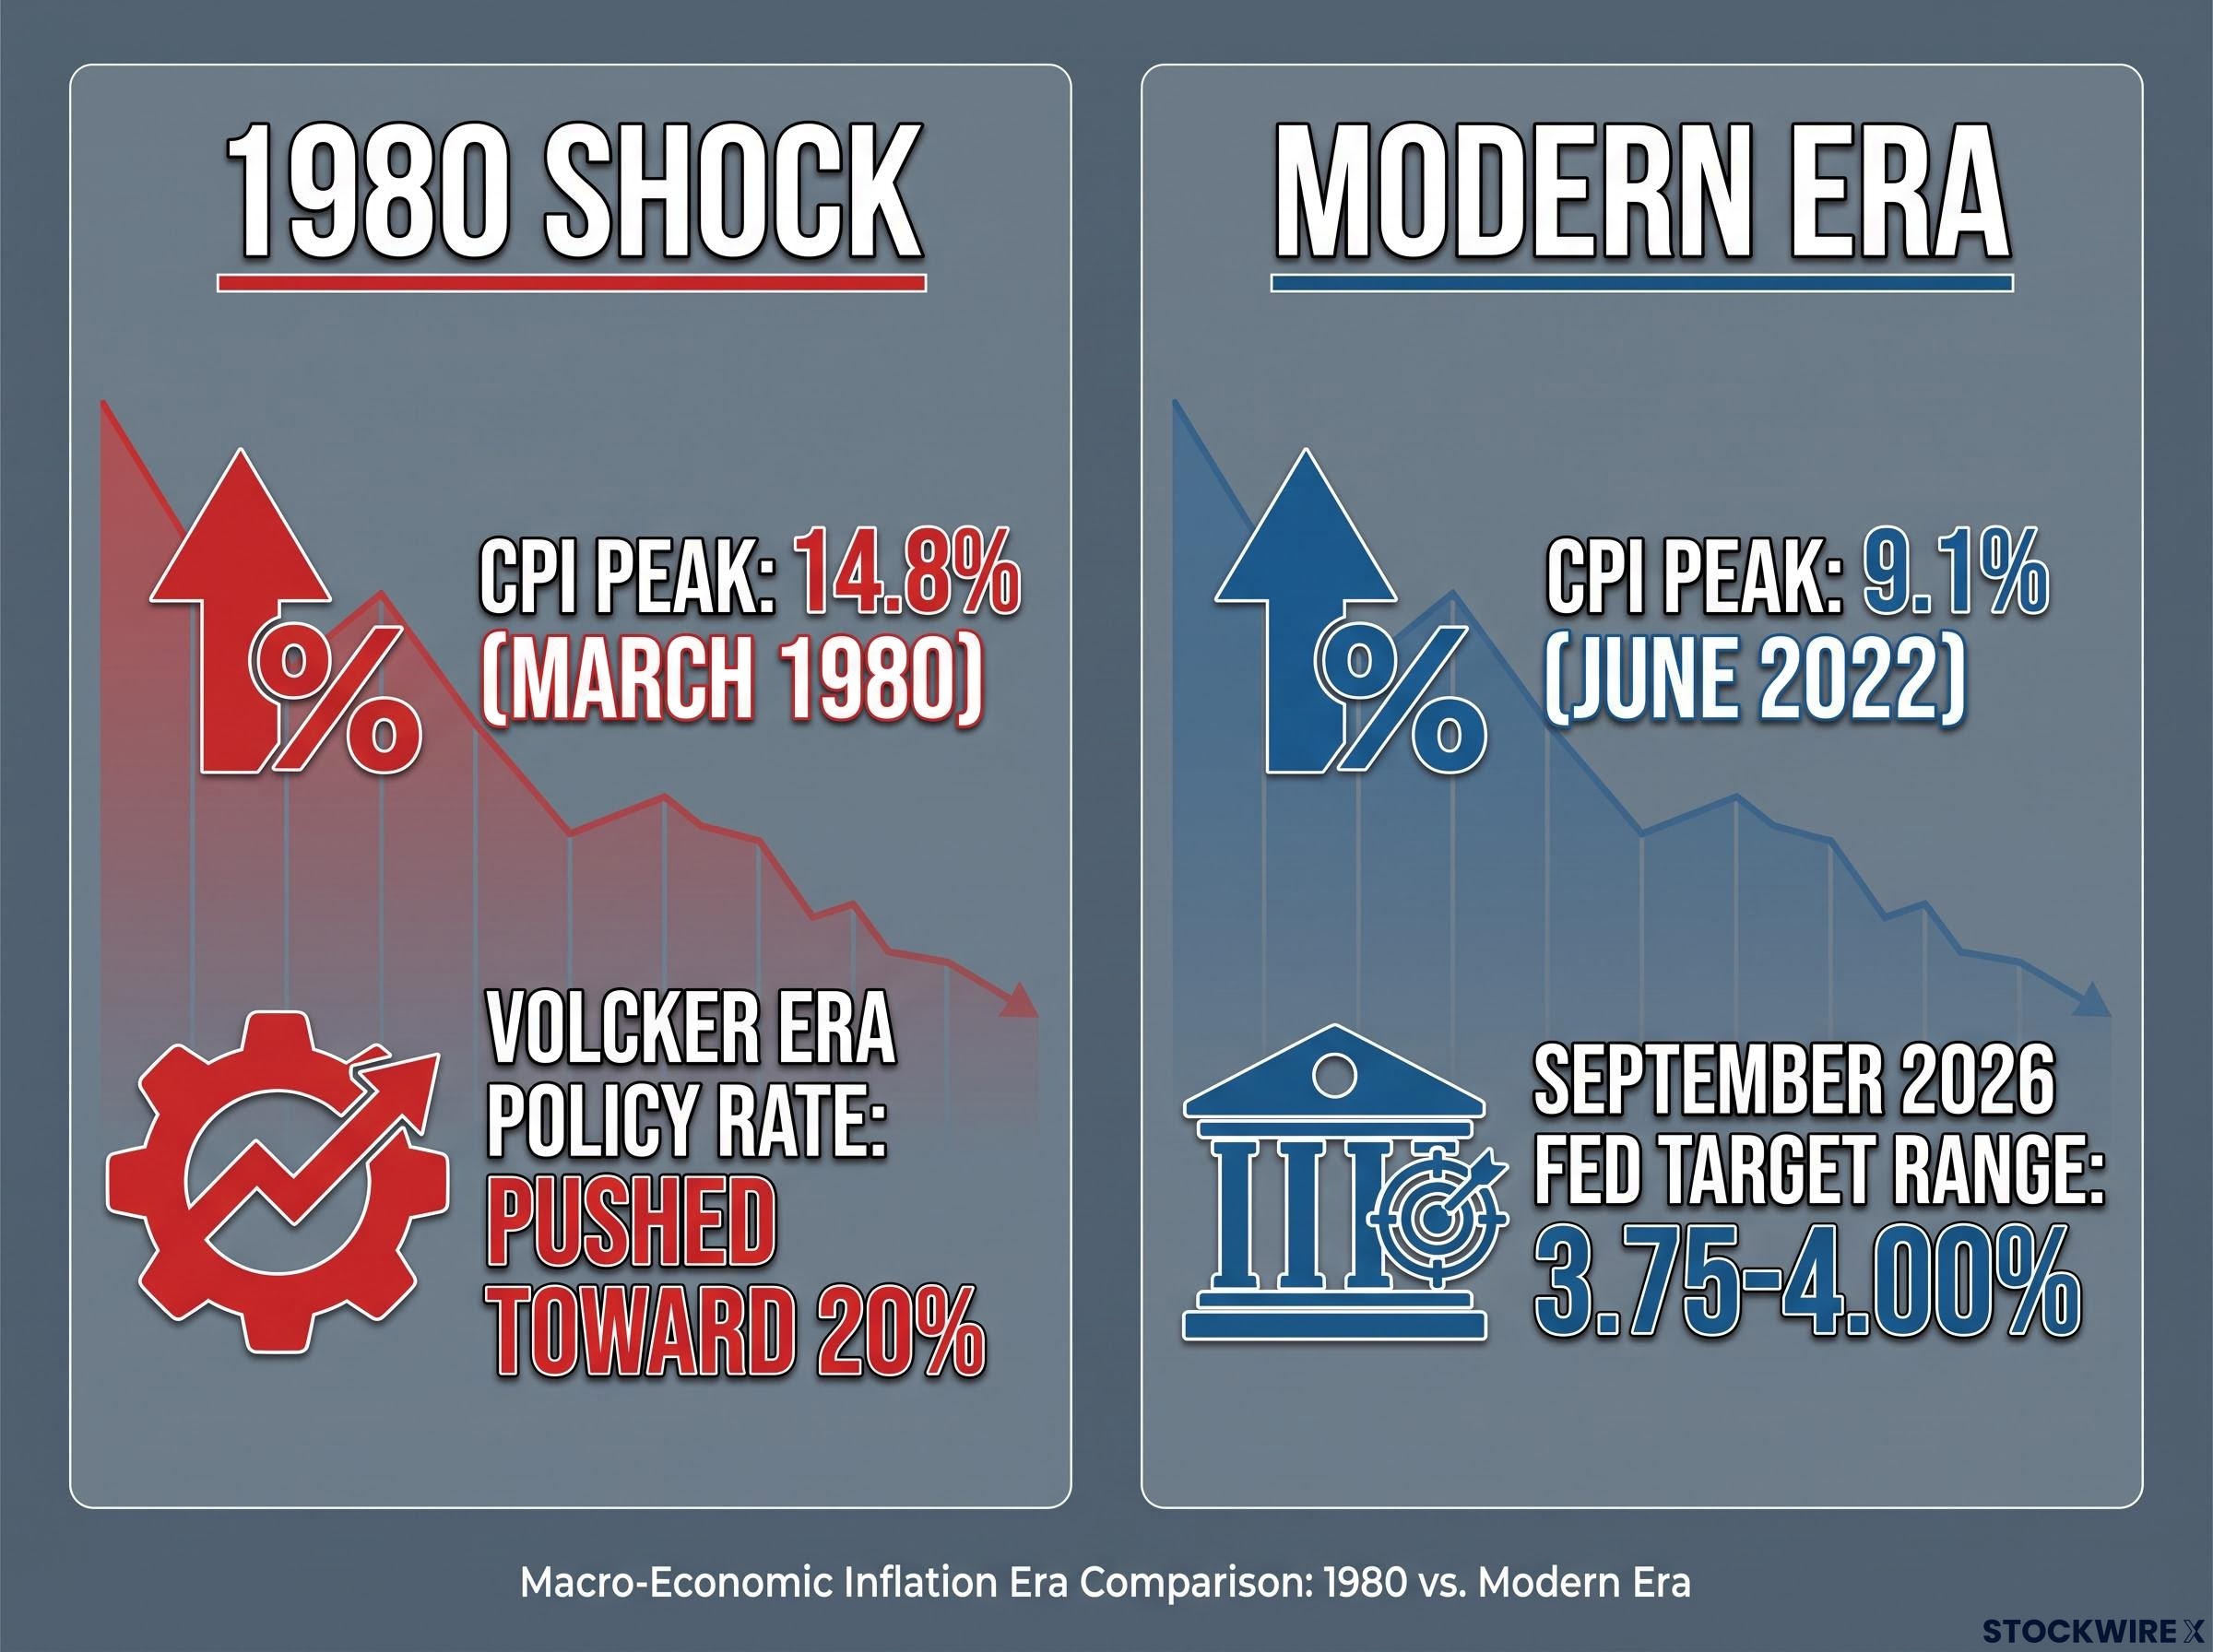
- The 2022 CPI peak was 9.1% in June 2022, well below the 14.8% reached in March 1980
- Central bank credibility is stronger today, anchored by explicit inflation targets
- The shock composition differs: pandemic, war, and supply chains rather than repeated 1970s energy shocks and wage-price spirals
US CPI peaked at 9.1% in June 2022, against 14.8% in March 1980.
During the Volcker era, the Fed pushed its policy rate toward 20% and targeted the money supply rather than the funds rate, tolerating extreme volatility to break inflation. Modern policy works through narrower rate corridors and balance-sheet tools, so the mechanics are less severe even when the intent is similar.
The lesson from the data is not about timing. Every time yields rose this fast, the subsequent path was shaped by what caused inflation to break, not by when. The question for you is not “when will yields fall?” but “what specific condition will break inflation persistence this time?” That framing guards against both panic and complacency: this has happened before, but in the 1970s it resolved only through extreme policy action, not organic moderation.
Why the 2001-to-2020 period was the exception, not the baseline
From 2001 to 2020, US debt accelerated while nominal rates fell. That combination was not a structural norm; it reflected extraordinary global conditions, namely savings gluts, heavy foreign official demand for Treasuries, and successive rounds of QE.
Those conditions have faded. Any investor who anchored their rate expectations to that two-decade window is working from an unrepresentative baseline, which is precisely why the debt effect that stayed hidden then is visible now.
What investors should actually be watching as 2026 closes out
After the evidence, the practical question is what to monitor. Three forward variables will determine whether the rate environment shifts, and they are worth watching in order of signalling power.
- Labour market data: the unemployment trend is the single most important early-cut trigger.
- Core inflation prints: whether disinflation is sustained across readings or a one-off.
- Treasury auction demand: the real-time read on where term premiums are heading.
| Variable | What to Watch | Shift Signal |
|---|---|---|
| Labour market | Monthly unemployment rate and trend | A sharp rise, not a gentle softening |
| Core inflation | Consecutive core CPI and PCE readings | Sustained decline across multiple months |
| Treasury auctions | Bid-to-cover ratios and demand strength | Rising demand easing term premium pressure |
The deficit anchors all of this. At $1.9 trillion for FY2026 and with debt projected toward 120% of GDP by 2036, Treasury supply pressure is structural. It will not ease without either a fiscal policy shift or a dramatic rise in buyer demand, and neither is currently in evidence.
The original research source argues that official inflation figures likely understate the actual rate of price increases, which would extend the timeline for any Fed pivot further still. If that view holds, asset holders are structurally favoured over holders of nominal fixed income in this environment.
The framework converts the macro complexity into a monitoring discipline. If all three signals move together, labour market softening, inflation falling, and auction demand rising, the rate-cut thesis becomes credible. Until then, the base case is persistence.
The rate cuts are not coming until the data forces the Fed’s hand
The two forces named at the outset are not independent risks that might offset each other. The Iran-driven repricing of inflation and the $40 trillion debt load feeding term premiums reinforce one another, and they converged in a single week: a 5.01% 10-year yield on 14 September 2026 and a unanimous Fed hike to 3.75-4.00% two days later.
A term premium of roughly 80-100 basis points, its highest in twelve years, tells you the market is pricing structural risk into duration independent of the Fed funds rate.
The precondition for lower yields is stark: simultaneous labour market deterioration and sustained core disinflation. Neither is visible in the current data, and with debt projected toward 120% of GDP by 2036, the supply pressure has no near-term release valve.
The historical record and the long-run yield data point the same way. Elevated rates are the environment to plan for, not a temporary disruption to wait out.
For investors wanting to stress-test what comes next, our deep-dive into the 6% Treasury yield scenario maps how a move from 5% to 6% would transmit into 30-year mortgage rates, equity discount rates, and credit spreads, and which parts of the curve institutional managers at BlackRock and Vanguard are already repositioning away from.
This article is for informational purposes only and should not be considered financial advice. Investors should conduct their own research and consult with financial professionals before making investment decisions. Past performance does not guarantee future results. Financial projections are subject to market conditions and various risk factors, and forward-looking statements are speculative and subject to change based on economic developments.