In the week ending 16 September 2026, investors pulled roughly $75.9 billion out of money market funds, extended a 12-week Treasury inflow streak, and drove commodities to a 45% year-to-date gain, even as Bank of America flagged near-record diesel prices as a possible precursor to inflation topping 5%.
The data came from the weekly Flow Show report compiled by BofA strategists Jared Woodard and Michael Hartnett using EPFR data, and it arrived at a moment when the cross-asset picture is unusually crowded with directional signals. Cash left money markets and moved into duration, crypto flows reversed, and a commodity inflation warning surfaced from a major institutional desk, all inside the same seven days. That density makes the week’s global capital flows read as a coherent macro signal rather than statistical noise.
Here is what the week’s flow data actually tells you about where institutional money is repositioning, and what the commodity signal could mean for portfolio risk heading into Q4.
The great cash exodus: where $75.9 billion went when it left money markets
The single most structurally significant move of the week was not an inflow. It was the roughly $75.9 billion that drained out of money market funds, the largest such outflow in nine weeks.
Cash on that scale does not simply vanish. It gets redeployed, and the destinations tell you what the market’s largest participants are thinking.
The scale of the September outflow is more legible in comparative context: as recently as 5 August 2026, money market fund dynamics ran in the opposite direction, with $53.7 billion flowing in even as equities, bonds, and crypto simultaneously attracted capital, illustrating how quickly the cash rotation can reverse direction.
A good chunk of it moved into duration. Treasury funds pulled in around $7.3 billion, extending an inflow streak to 12 consecutive weeks as of 16 September 2026. Gold funds drew roughly $3.1 billion. On the other side of the risk ledger, cryptocurrency funds bled about $800 million, their steepest weekly outflow in 11 weeks.
- Money market funds: approximately $75.9 billion out, largest outflow in nine weeks
- Treasury funds: approximately $7.3 billion in, 12 consecutive weeks of inflows
- Gold funds: approximately $3.1 billion in
- Cryptocurrency funds: approximately $800 million out, steepest in 11 weeks
| Asset Class | Direction | Weekly Flow ($B) | Streak Context |
|---|---|---|---|
| Money markets | Outflow | ~$75.9B | Largest in 9 weeks |
| Treasuries | Inflow | ~$7.3B | 12 consecutive weeks |
| Gold | Inflow | ~$3.1B | Companion safe-asset move |
| Crypto | Outflow | ~$0.8B | Steepest in 11 weeks |
The anchor signal: Treasury funds have now taken in capital for 12 straight weeks as of 16 September 2026, the clearest institutional statement in the dataset.
The combination matters more than any single figure. The largest money-market outflow in nine weeks running alongside a 12-week Treasury streak tells you institutions are not just trimming risk. They are actively locking in duration, a posture that only makes sense if you believe the rate cycle has peaked or is close to it.
One caveat on sourcing: Reuters coverage dated 14 September 2026 confirms the equity-side figures below, but does not document the money-market or crypto numbers. Those derive from BofA’s Flow Show directly.
When big ASX news breaks, our subscribers know first
U.S. dominates, Europe stumbles: reading the equity flow geography
On the equity side, the headline was as unambiguous as it gets. Global equity funds took in $79.3 billion, and $63.8 billion of that, roughly four dollars in every five, went into U.S. stocks. Both figures are confirmed by Reuters as of 14 September 2026.
That is not diversification. That is concentration.
The week’s U.S. equity dominance sits inside a larger 2026 trend: global equity fund flows reached nearly $800 billion year-to-date by mid-August, running at a pace Barclays described as on track for a record annual total, making the September concentration into U.S. stocks a reinforcement of an already-elevated positioning profile.
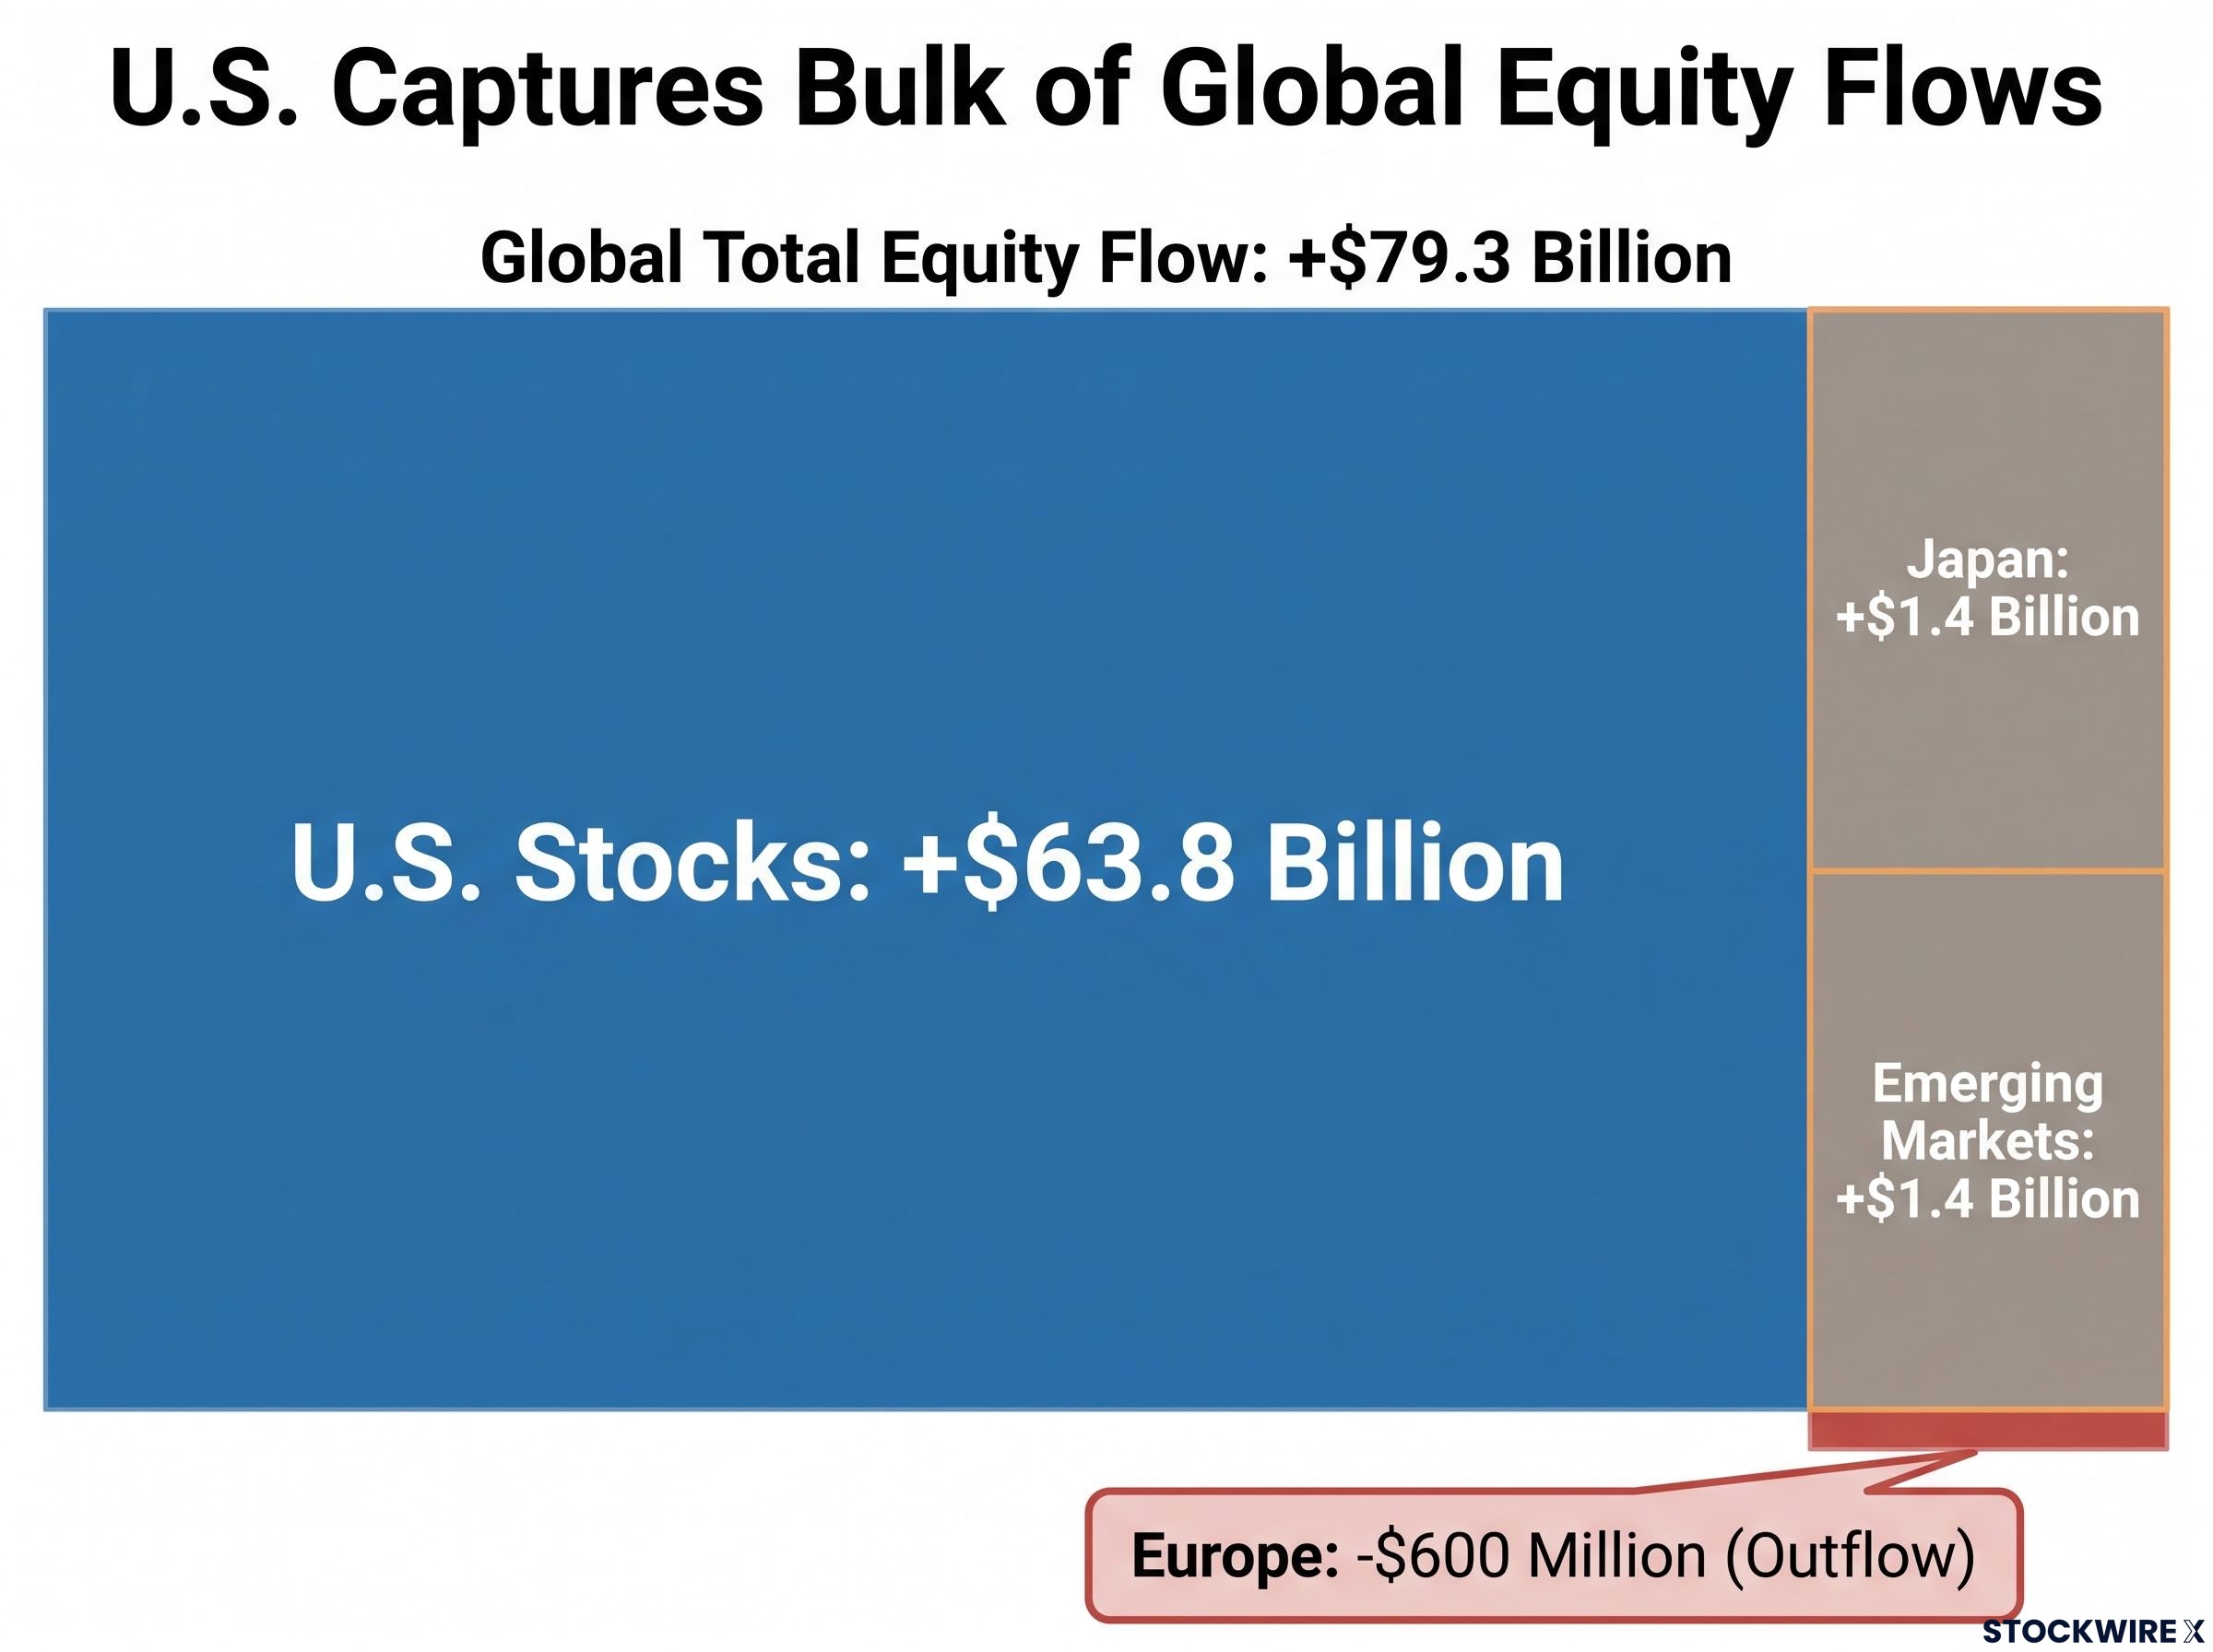
The share that matters: U.S. equity funds captured $63.8 billion of the $79.3 billion in total global equity inflows, an overwhelming institutional vote for U.S. exceptionalism.
The picture gets more interesting once you leave the United States. Europe reversed, logging roughly $600 million in net outflows and breaking a three-week run of inflows. The magnitude is small. The reversal is the point.
Japan and emerging markets, meanwhile, held their ground. Japanese equity funds drew about $1.4 billion for a fourth straight week, and EM equity funds took in a similar $1.4 billion for a second consecutive week.
| Geography | Weekly Flow ($B) | Trend Context |
|---|---|---|
| United States | +$63.8B | Dominant share of global total |
| Japan | +$1.4B | Fourth consecutive week |
| Emerging markets | +$1.4B | Second consecutive week |
| Europe | -$0.6B | Reversed three-week inflow trend |
The Europe reversal tells you something the U.S. figure alone hides. Institutional appetite for European equities is fragile and conditionally held. If macro data in Europe deteriorates, those flows could reverse hard and fast. For a reader with a globally balanced equity book, the takeaway is uncomfortable: the money is voting for concentration, not spread, and that asymmetry shapes relative performance.
Bond markets in two directions: Treasuries and EM debt up, IG and high yield out
The bond headline read like a clean risk-on-in-fixed-income story: about $9.8 billion into bond funds overall. That headline is misleading. The distribution inside it tells the real story.
Investors were not buying bonds as a category. They were buying up the quality stack.
The inflows clustered at the safest end. Treasuries took the lion’s share at roughly $7.3 billion, EM debt funds drew about $3.0 billion for a seventh straight week, and bank loan funds attracted around $1.0 billion for a second week.
The outflows told the opposite story about corporate credit. Investment-grade bond funds shed roughly $1.0 billion, their first net outflow since April 2026, and high-yield funds lost about $2.5 billion for a second consecutive week. Both outflow figures are confirmed by Reuters.
- Inflows (moving up the quality stack): Treasuries (~$7.3B), EM debt (~$3.0B), bank loans (~$1.0B)
- Outflows (credit appetite contracting): IG bonds (~$1.0B), high-yield bonds (~$2.5B)
| Fixed Income Category | Direction | Weekly Flow ($B) | Streak or Notable Context |
|---|---|---|---|
| Treasuries | Inflow | ~$7.3B | 12-week streak |
| EM debt | Inflow | ~$3.0B | Seven consecutive weeks |
| Bank loans | Inflow | ~$1.0B | Second consecutive week |
| Investment-grade | Outflow | ~$1.0B | First outflow since April 2026 |
| High yield | Outflow | ~$2.5B | Second consecutive week |
The IG outflow is the signal to sit up for. High yield selling off is routine when nerves rise, but investment grade is the last credit rung before sovereigns, and its first outflow since April suggests investors have moved from a mild quality preference to active de-risking within the safest corporate tier. That tier tends to get sold only when macro or rate risk is being repriced.
The investment-grade outflow, the first since April 2026, arrives alongside broader credit stress signals that predate the September flow data: corporate bankruptcies hit their highest level since 2010 in 2025, and bank lending standards are at the tighter end of their post-2005 range.
If you hold credit funds or bond ETFs, the disaggregation matters more than the $9.8 billion headline. Money is rotating toward sovereign and EM duration and away from corporate credit, which points to widening credit spread pressure into Q4.
The commodity inflation signal BofA is watching hardest heading into Q4
The bond and cash rotations all sit against one backdrop, and it is the one Woodard and Hartnett flagged as their sharpest Q4 concern.
Commodities have gained roughly 45% year-to-date as of September 2026, and BofA notes they have outperformed U.S. equities over the prior five years. The strategists read that not as a short-term spike but as evidence of a longer structural shift toward tangible assets.
The 45% year-to-date commodity gain sits inside a broader structural thesis: BofA strategists note that commodities have outperformed U.S. equities over five years, a pattern consistent with what analysts characterise as a commodity supercycle driven by supply underinvestment and large-scale demand transformation.
The transmission channel into the real economy is diesel. The U.S. national average crossed $6 per gallon for the first time on 10 September 2026, according to Reuters and GasBuddy, and reached $6.285 per gallon by 14 September 2026, a figure confirmed across IndexBox, Bluebook Services and the National Distribution Alliance. BofA’s own reference figure runs slightly higher at around $6.40 per gallon, which may reflect a regional or rounded reading.
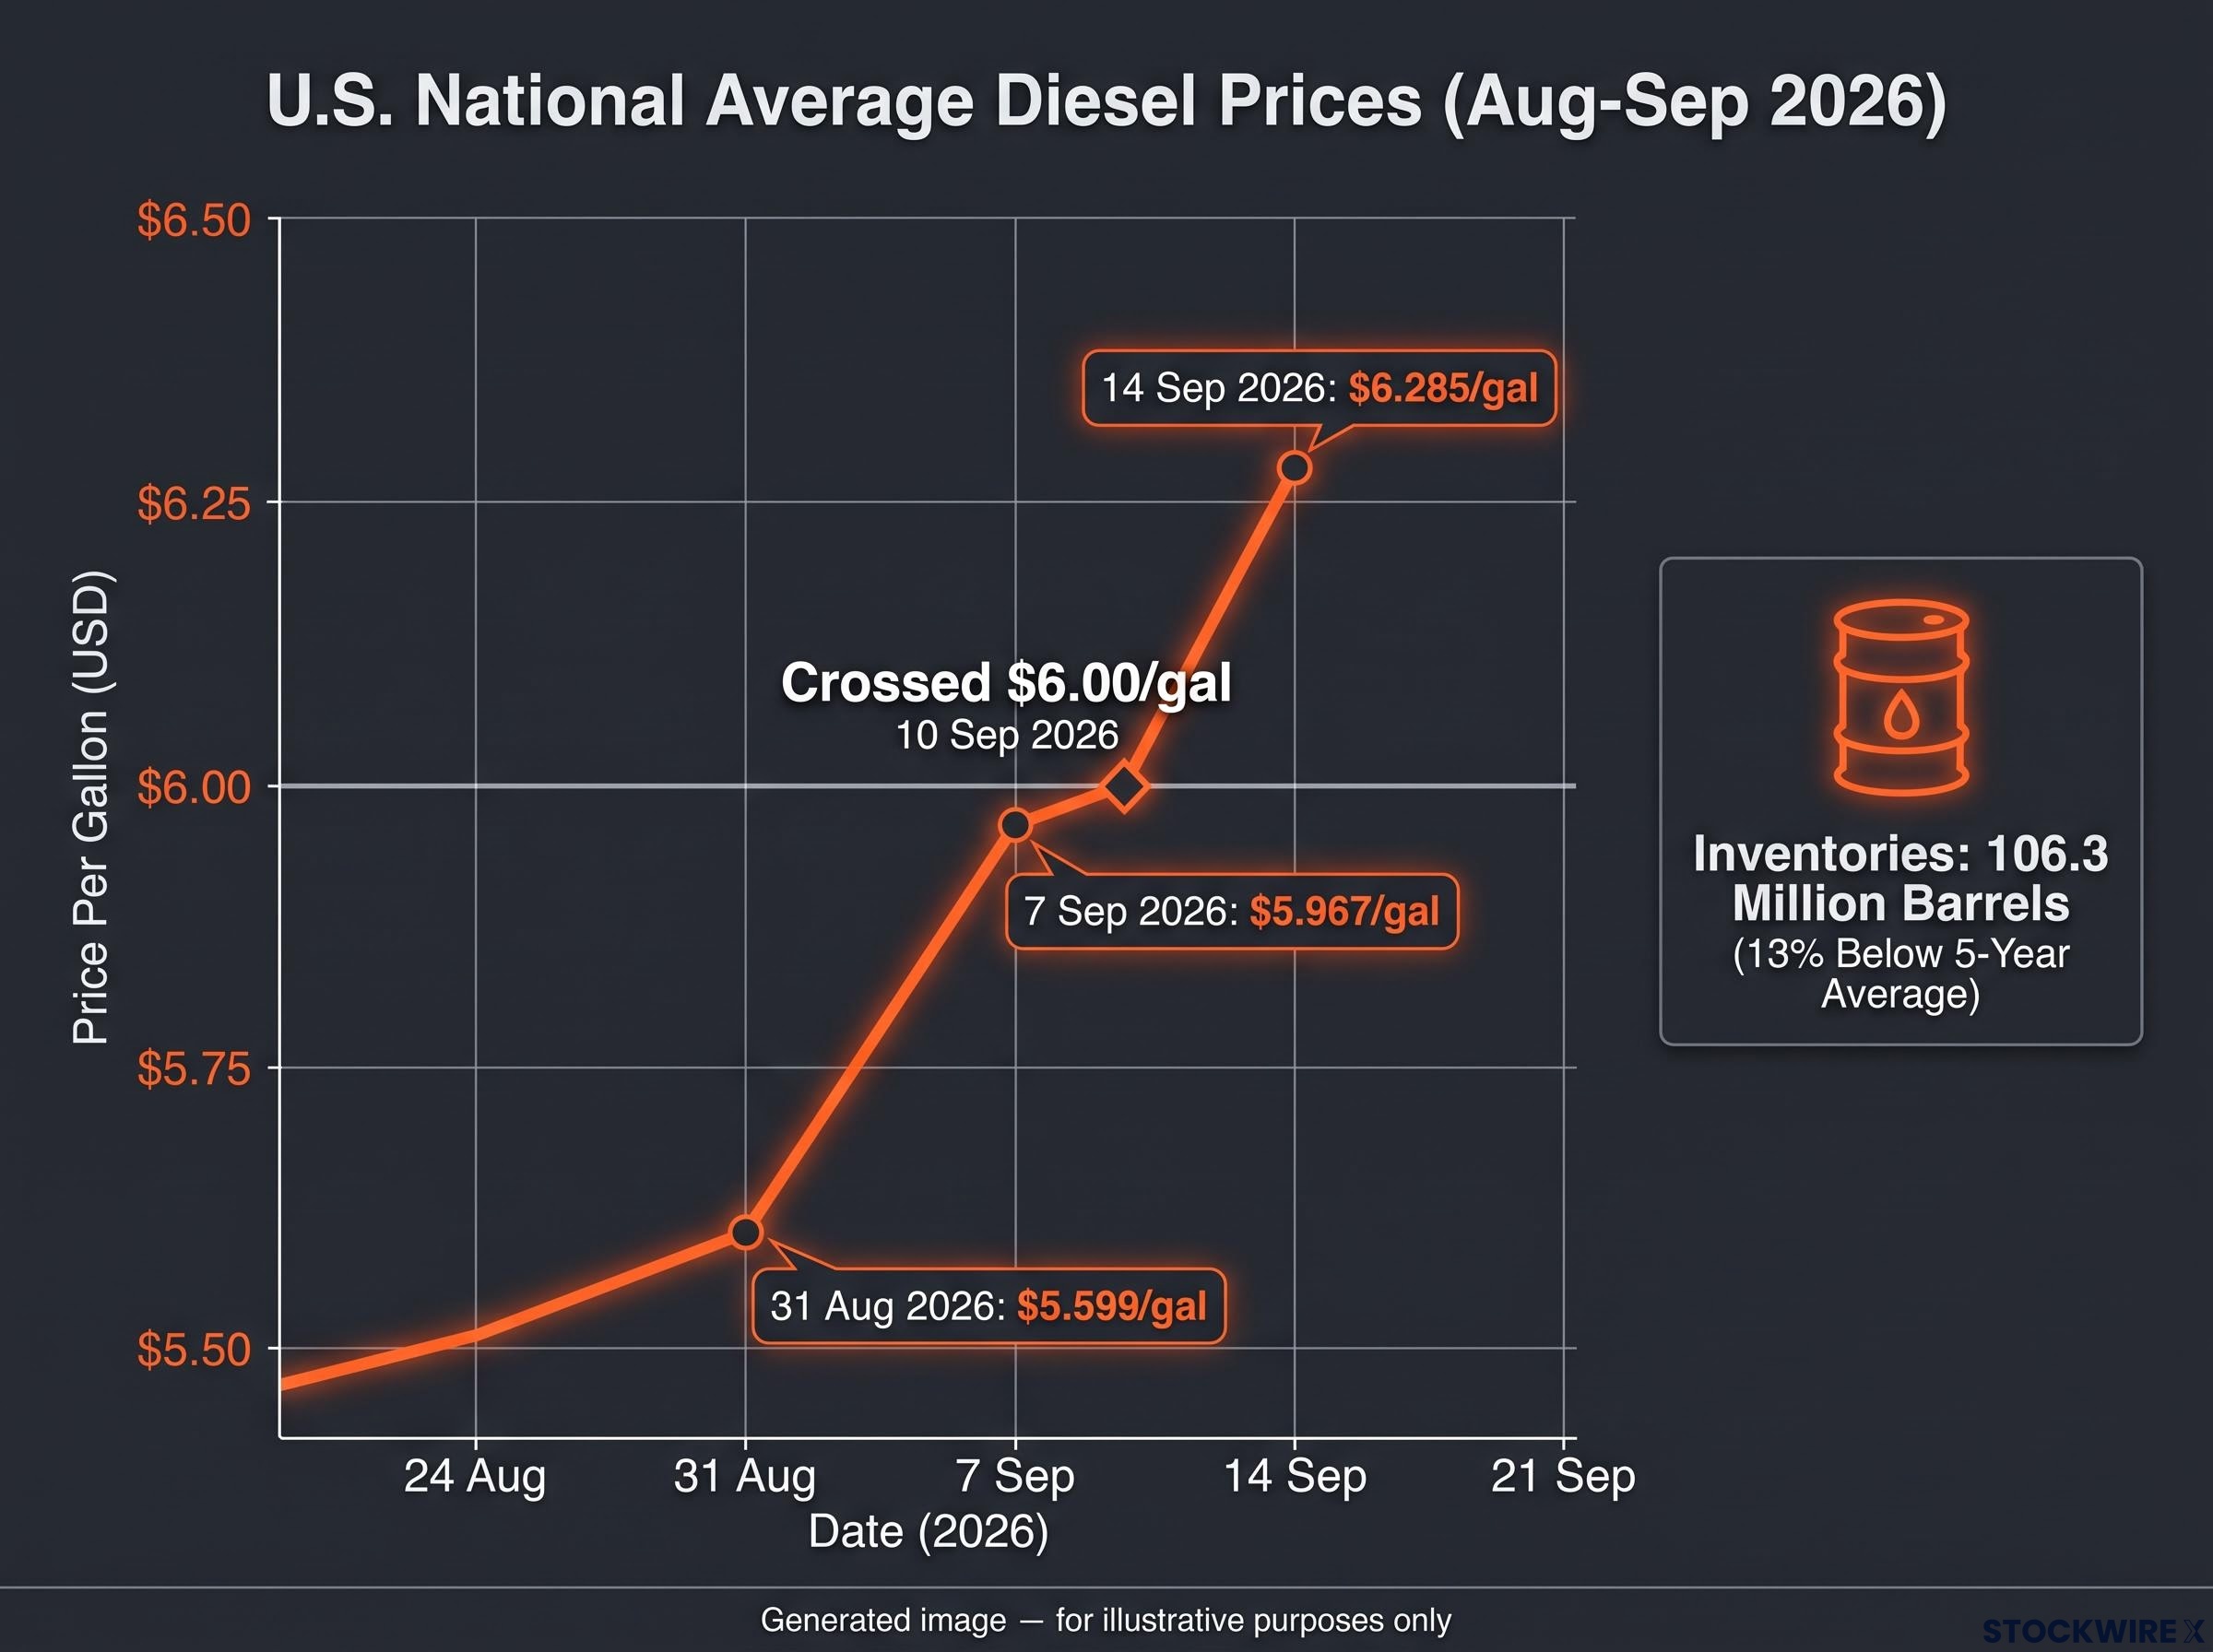
| Date | National Average | Week-on-Week | Year-on-Year | Source |
|---|---|---|---|---|
| 31 Aug 2026 | $5.599/gal | – | – | EIA (via IndexBox) |
| 7 Sep 2026 | $5.967/gal | +$0.368 | +$2.201 | EIA |
| 10 Sep 2026 | Crossed $6.00/gal | – | – | Reuters/GasBuddy |
| 14 Sep 2026 | $6.285/gal | +$0.318 | – | EIA (IndexBox, Bluebook, NDA) |
Two structural forces explain why this may not reverse quickly. Argus Media links roughly $2.26 per gallon of the rise since the 23 February 2026 baseline to U.S. and Israeli strikes on Iran, and diesel inventories sit at 106.3 million barrels, about 13% below the five-year average, per EIA data via Reuters. Tight supply plus a live geopolitical shock is a combination that tends to persist.
BofA’s historical analogy: When diesel reaches these levels, it recreates the cost-pressure environment that has historically come before inflation breaching 5%, a threat made more acute by the fact that refining capacity across the country is already stretched to its limits.
The EIA lends independent weight to the persistence view. Its September Short-Term Energy Outlook raised the 2026 average retail diesel forecast to $5.07 per gallon from $4.85, an upward revision that implies the agency expects elevated freight and transport costs to stay embedded through year-end rather than fade.
Diesel at $6.285 per gallon, inventories 13% below average, and refineries at full tilt tells you this is not a spike with an obvious release valve. Until supply eases or demand falls, that cost gets baked into freight, agriculture and manufacturing pricing chains, and those chains feed consumer inflation.
What could break the commodity inflation thesis
The case is not one-directional, and several dynamics could weaken it.
- Demand destruction: prices this high can suppress consumption, capping further gains and potentially triggering a correction.
- Geopolitical reversal: a ceasefire, sanctions relief, or alternative Iranian supply could quickly loosen the supply balance.
- Historical mean reversion: strong year-to-date commodity runs have often been followed by at least partial reversal as new supply and unwinding positions arrive.
- Policy and hedging responses: strategic stock releases, subsidies and corporate hedging can blunt the pass-through from commodity prices to headline inflation.
For portfolios, the stakes are direct. If cost-push inflation resurfaces harder than markets are pricing, the 12-week Treasury inflow trend could reverse quickly as rate-cut expectations get pushed out, hitting duration and risk assets at the same time.
What the week’s data signals for Q4 portfolio risk
Read the four moves separately and they look like disconnected data. Read them together and they form a single posture.
Institutions are concentrated in U.S. equities, climbing the fixed income quality ladder toward sovereigns, and doing both against a commodity-driven inflation backdrop that could disrupt each. The $75.9 billion money-market outflow shows the rotation is broad-based, not a niche trade, and the 12-week Treasury streak shows where the conviction is pointing.
The historical pattern: Periods that combine commodity strength with sustained safe-asset inflows, such as 2007-2008 before the financial crisis and the 2021-2022 post-pandemic energy shock, have historically coincided with heightened macro-financial stress. The comparison is a warning flag, not a forecast.
The tension in the current setup is specific. The Treasury trade works cleanly if the rate cycle has peaked. It becomes a fragile bet if commodity-driven inflation overshoots and forces central banks to hold rates higher for longer, because a 45% commodity run and near-record diesel would undermine the rate-cut assumption the streak is built on.
- Equity concentration risk: U.S. exposure crowded at $63.8B of $79.3B globally
- Credit-quality ladder: capital leaving corporate credit for sovereign and EM duration
- Commodity-rate interaction: an inflation signal that could push the Fed’s rate path higher for longer
Finish here understanding the week’s flows not as a snapshot of where money went, but as a real-time map of how institutions are hedging a macro scenario they are not yet sure will arrive.
This article is for informational purposes only and should not be considered financial advice. Investors should conduct their own research and consult with financial professionals before making investment decisions. Past performance does not guarantee future results. Financial projections are subject to market conditions and various risk factors.
Three variables to watch before Q4 resets the flow picture
You do not need to act on one week of data. You do need a way to judge whether this positioning holds. Three publicly available signals will tell you, ranked by analytical priority.
- Weekly EIA diesel prints against the inventory deficit. Diesel currently sits at $6.285 per gallon with inventories 13% below the five-year average. Continued increases, or a failure of stocks to rebuild, would confirm the commodity inflation signal is durable rather than transient.
- The Treasury inflow streak. At 12 consecutive weeks, this is the cleanest read on rate-cycle positioning. Continuation reinforces the peaked-rates thesis; a sharp break would suggest institutions are losing conviction that cuts are coming.
- European equity flows. The $600 million outflow broke a three-week inflow run. A second week of outflows would signal the reversal is a trend, not a blip; a swift return to inflows would mark it as noise.
Track these across the next two to three BofA Flow Show releases and you will have a materially better-informed view of whether the Q4 risk scenario is building or dissipating.
—