Caterpillar makes bulldozers, excavators, and mining trucks. It also carries more influence over the Dow Jones Industrial Average than Honeywell, Boeing, and 3M combined, even though all four wear the same “industrial” label inside the index.
That single fact should stop you. Here you have the four companies the Dow formally classifies as industrials, and one of them quietly outvotes the other three whenever the index moves.
The timing makes this more than a curiosity. US industrial production came in flat at 0.0% in August 2026, missing the consensus forecast of +0.3%, according to the Federal Reserve’s G.17 release. At the exact moment the hard economic data is describing a stalling factory sector, a Caterpillar-led Dow may be broadcasting the opposite.
That is a signal-versus-noise problem, and it has a clean resolution. What follows here gives you the tools to read a Dow industrial headline and know precisely what it is measuring, and what it is quietly leaving out.
What price-weighting actually means, and why it is not intuitive
You already know the basic signal. A stock goes up, the index goes up. Simple enough. The assumption hiding underneath it is that bigger companies move the index more, and for the Dow, that assumption is simply wrong.
The Dow Jones Industrial Average does not care how large a company is. It sums the share prices of its 30 members, then divides by a fixed number called the divisor. That is the entire calculation.
Here is the mechanic in three steps:
- Add together the current share prices of all 30 constituents.
- Divide that total by the divisor, currently around 0.168 as of 29 June 2026, following Alphabet’s addition to the index.
- The result is the index level you see quoted.
Because of that divisor, a $1 move in any single component shifts the Dow by roughly 5.94 index points, no matter which company produced the move. A one-dollar swing in a $40 stock and a one-dollar swing in an $800 stock count identically. What matters is the dollar price of the move, not the size or economic weight of the business behind it.
The Dow divisor mechanics behind that 5.94-point-per-dollar relationship are worth tracing precisely, because the divisor itself adjusts every time a constituent is added, removed, or splits its shares, meaning the index’s sensitivity to any given stock is never fixed for long.
This is what separates the Dow from the S&P 500. The S&P 500 is market-cap weighted, so a company’s influence scales with its total market value. The Dow ignores market value entirely and lets the raw share price decide.
A $400 stock carries eight times the index weight of a $50 stock, regardless of which company is larger by market capitalisation.
The practical result is stark. A 1% move in a $500 stock pushes the Dow more than a 5% move in a $50 stock. Economic importance and company scale are invisible to this index, which means treating a Dow headline as a verdict on US industrial health is reading the wrong instrument entirely.
How stock splits quietly rewire the index
There is a second distortion baked into all of this, and it comes from stock splits.
When a company splits its stock, its share price drops proportionally. Nothing about the underlying business changes, but its Dow influence falls right along with the price.
According to critique published by AlphaTechFinance in January 2026, this is exactly why Apple and Amazon, two of the largest companies on Earth, have muted Dow impact: past splits lowered their share prices. Caterpillar, which has not split its way down, sits near $800 and dominates the index as a direct consequence.
When big ASX news breaks, our subscribers know first
Caterpillar, Boeing, and the four industrials: a single stock doing the work of three
Only four of the Dow’s 30 members carry the formal industrials classification. Together, Caterpillar, Honeywell, Boeing, and 3M make up 15.7% of the index. Now look at how that 15.7% is actually distributed.
Caterpillar trades near $800, giving it a Dow weight of roughly 9.49%, according to ChartRow’s constituent data updated 18 September 2026. That is already the heaviest industrial voice by a distance.
Honeywell sits at about $206, which translates to roughly 2.7% of the index. Boeing, near $197, and 3M, near $164, both carry less influence than Honeywell, purely because their share prices are lower. No formal weights were published for the latter two, but the price-driven maths leaves no ambiguity about the ranking.
Add Honeywell, Boeing, and 3M together and you still land below Caterpillar on its own. One stock outweighs the other three combined.
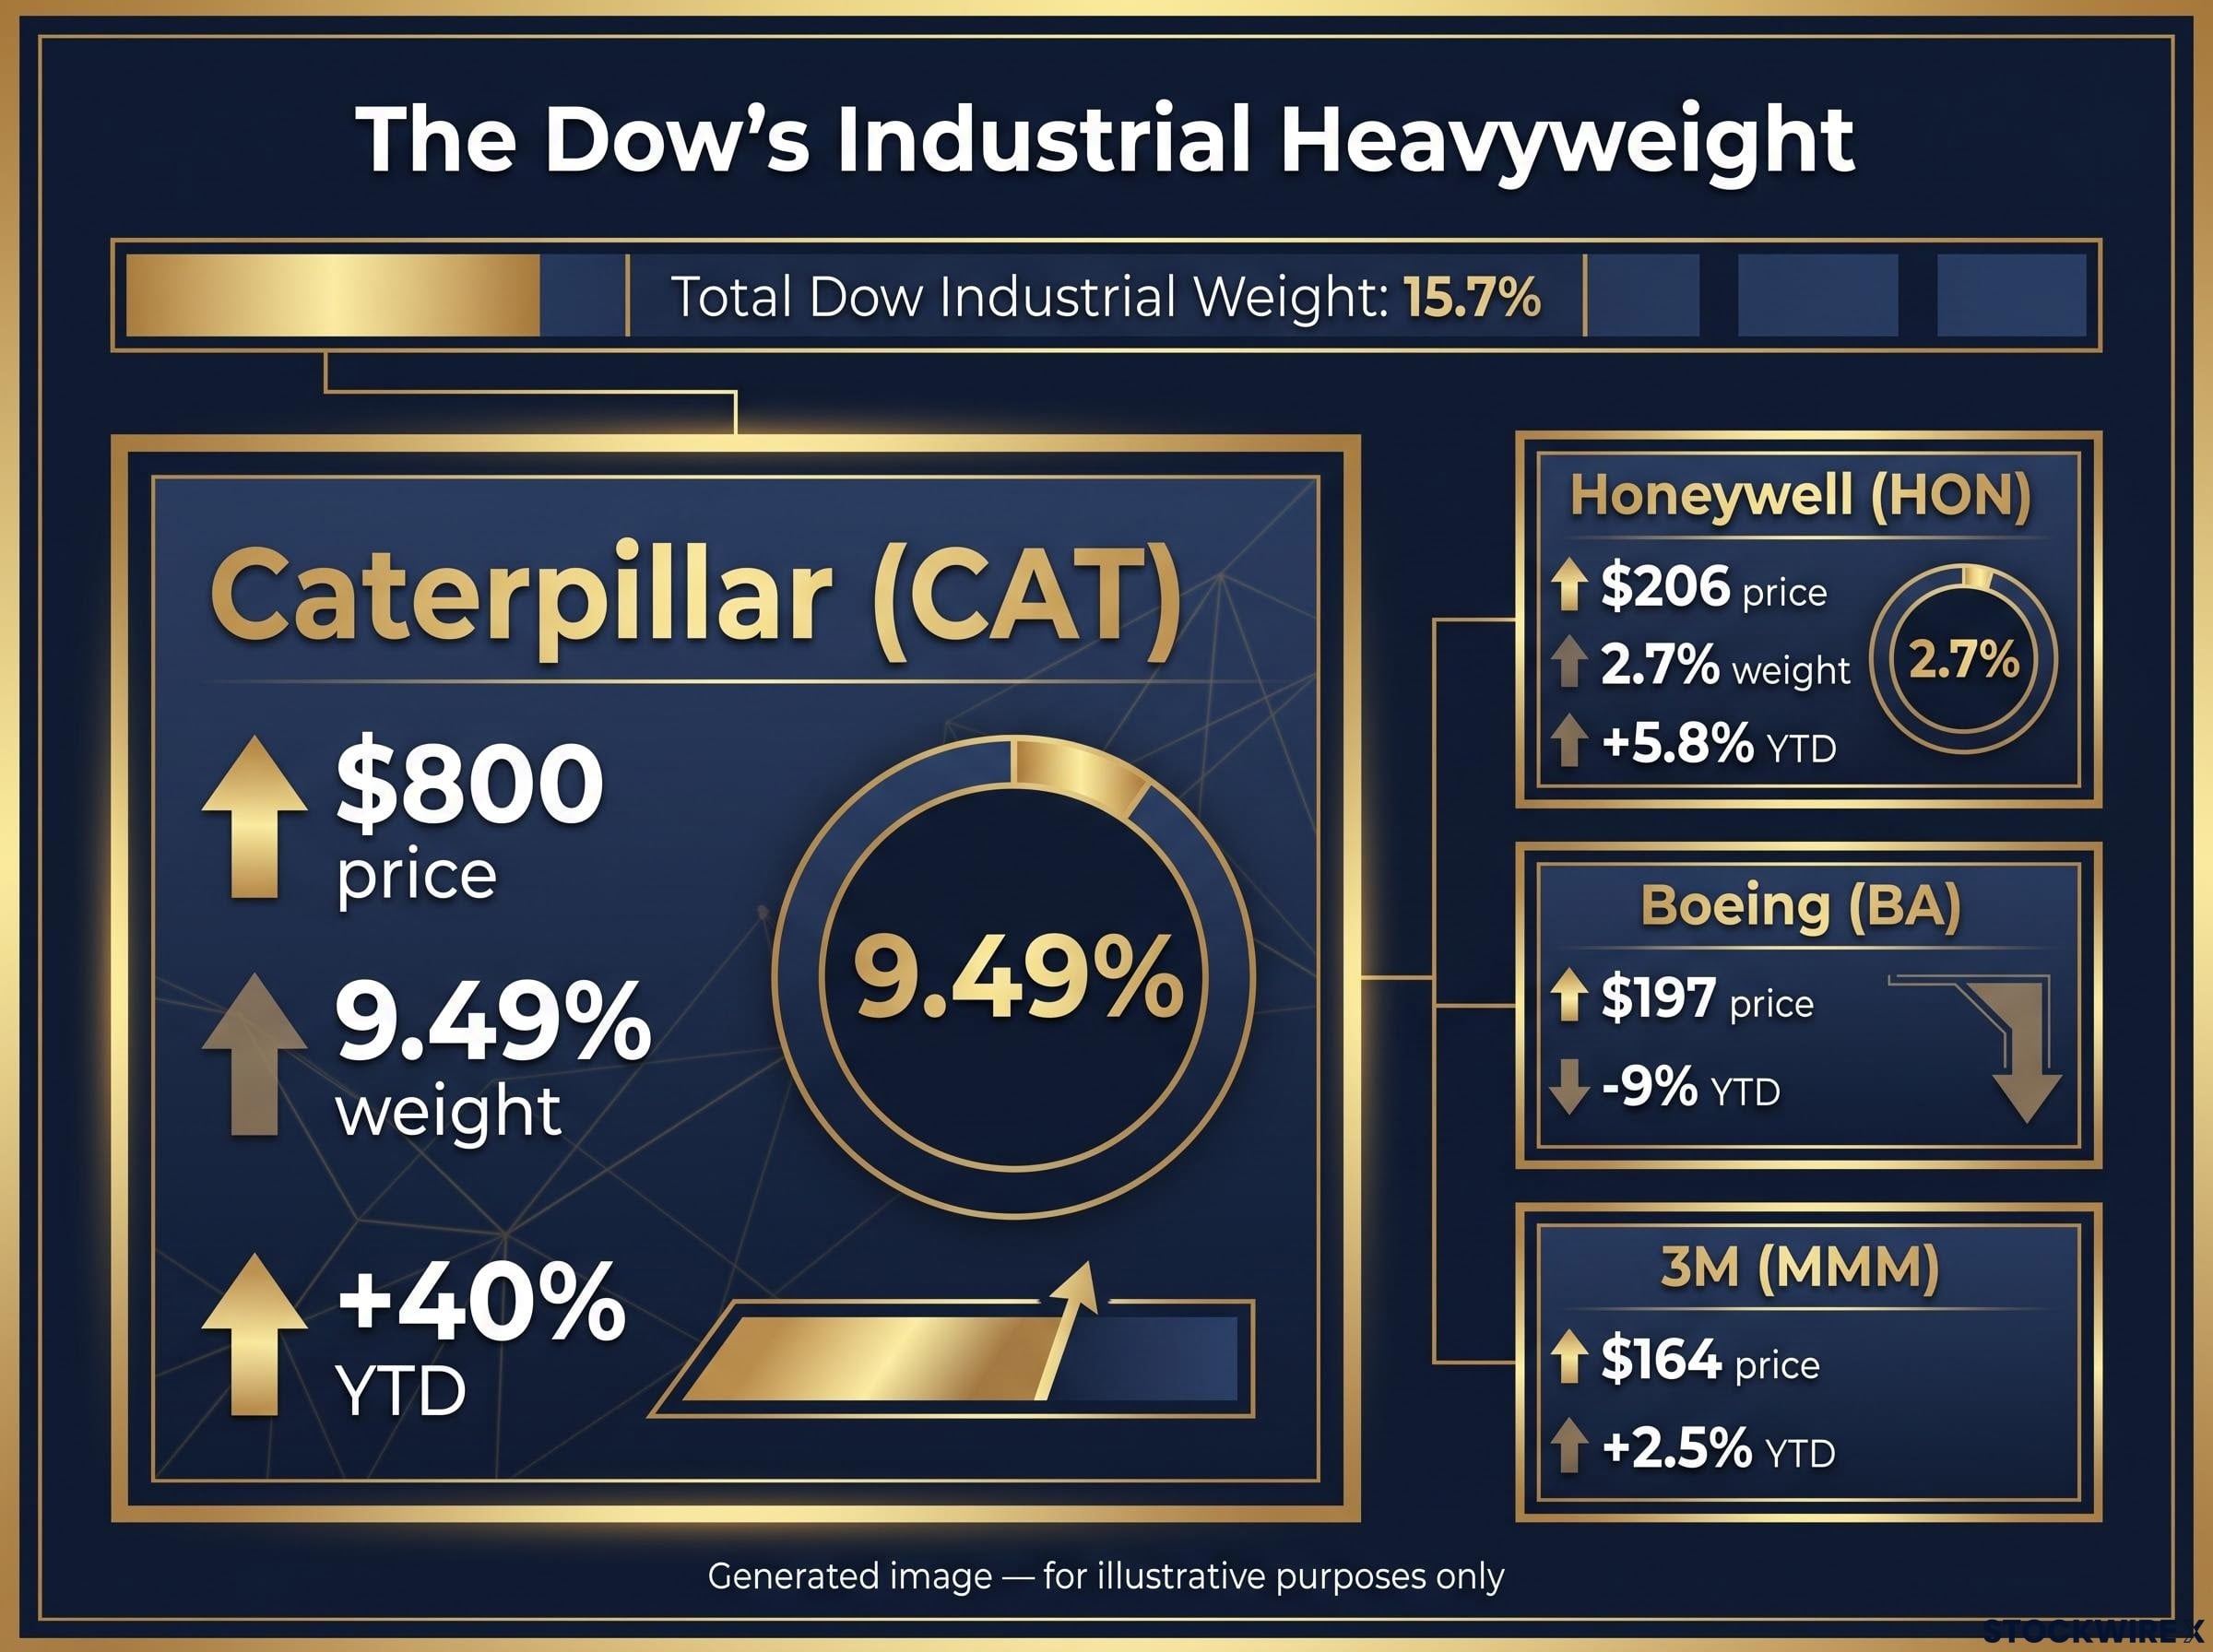
Caterpillar’s weighting alone exceeds the combined influence of Honeywell, Boeing, and 3M.
The 2026 performance data has only widened that gap. Caterpillar is up roughly 40% year-to-date as of 17 September 2026, per MarketBeat, while Boeing has fallen around 9%, Honeywell has gained about 5.8%, and 3M has managed roughly 2.5%.
| Company | Approx. share price (Sept 2026) | Approx. DJIA weight | YTD 2026 performance |
|---|---|---|---|
| Caterpillar (CAT) | $800 | 9.49% | +40% |
| Honeywell (HON) | $206 | 2.7% | +5.8% |
| Boeing (BA) | $197 | Below HON | -9% |
| 3M (MMM) | $164 | Below HON | +2.5% |
Notice what this does. Caterpillar’s 40% run does not just make Caterpillar look strong; it makes the entire industrial slice of the Dow look strong, because Caterpillar is most of that slice.
So when the Dow posts a gain and a headline attributes it to “industrial strength,” you now know the question to ask. Is this Caterpillar, or is this all four companies moving together? In 2026, that question almost always has the same answer, and a Dow gain dressed as broad industrial strength may be a one-stock story wearing a sector label.
What August’s flat industrial production reading is actually saying
The headline number is a single figure: US industrial production held at 0.0% month-over-month in August 2026, against a consensus forecast of +0.3%. On its own, “flat” sounds like a non-event. The composition tells a different and more useful story.
That flat aggregate is a blend of three moving parts, and they are not moving in the same direction:
- Manufacturing: -0.3% m/m. This is the sub-reading that matters most for Dow industrials, and it fell, ending seven straight monthly gains.
- Mining: +0.1% m/m. A marginal rise, but irrelevant to any Dow constituent’s core business.
- Utilities: +1.8% m/m. The strongest component, and again unconnected to anything the four industrials actually sell.
The point buried in that list is that the two components which rescued the headline are the two the Dow does not touch.
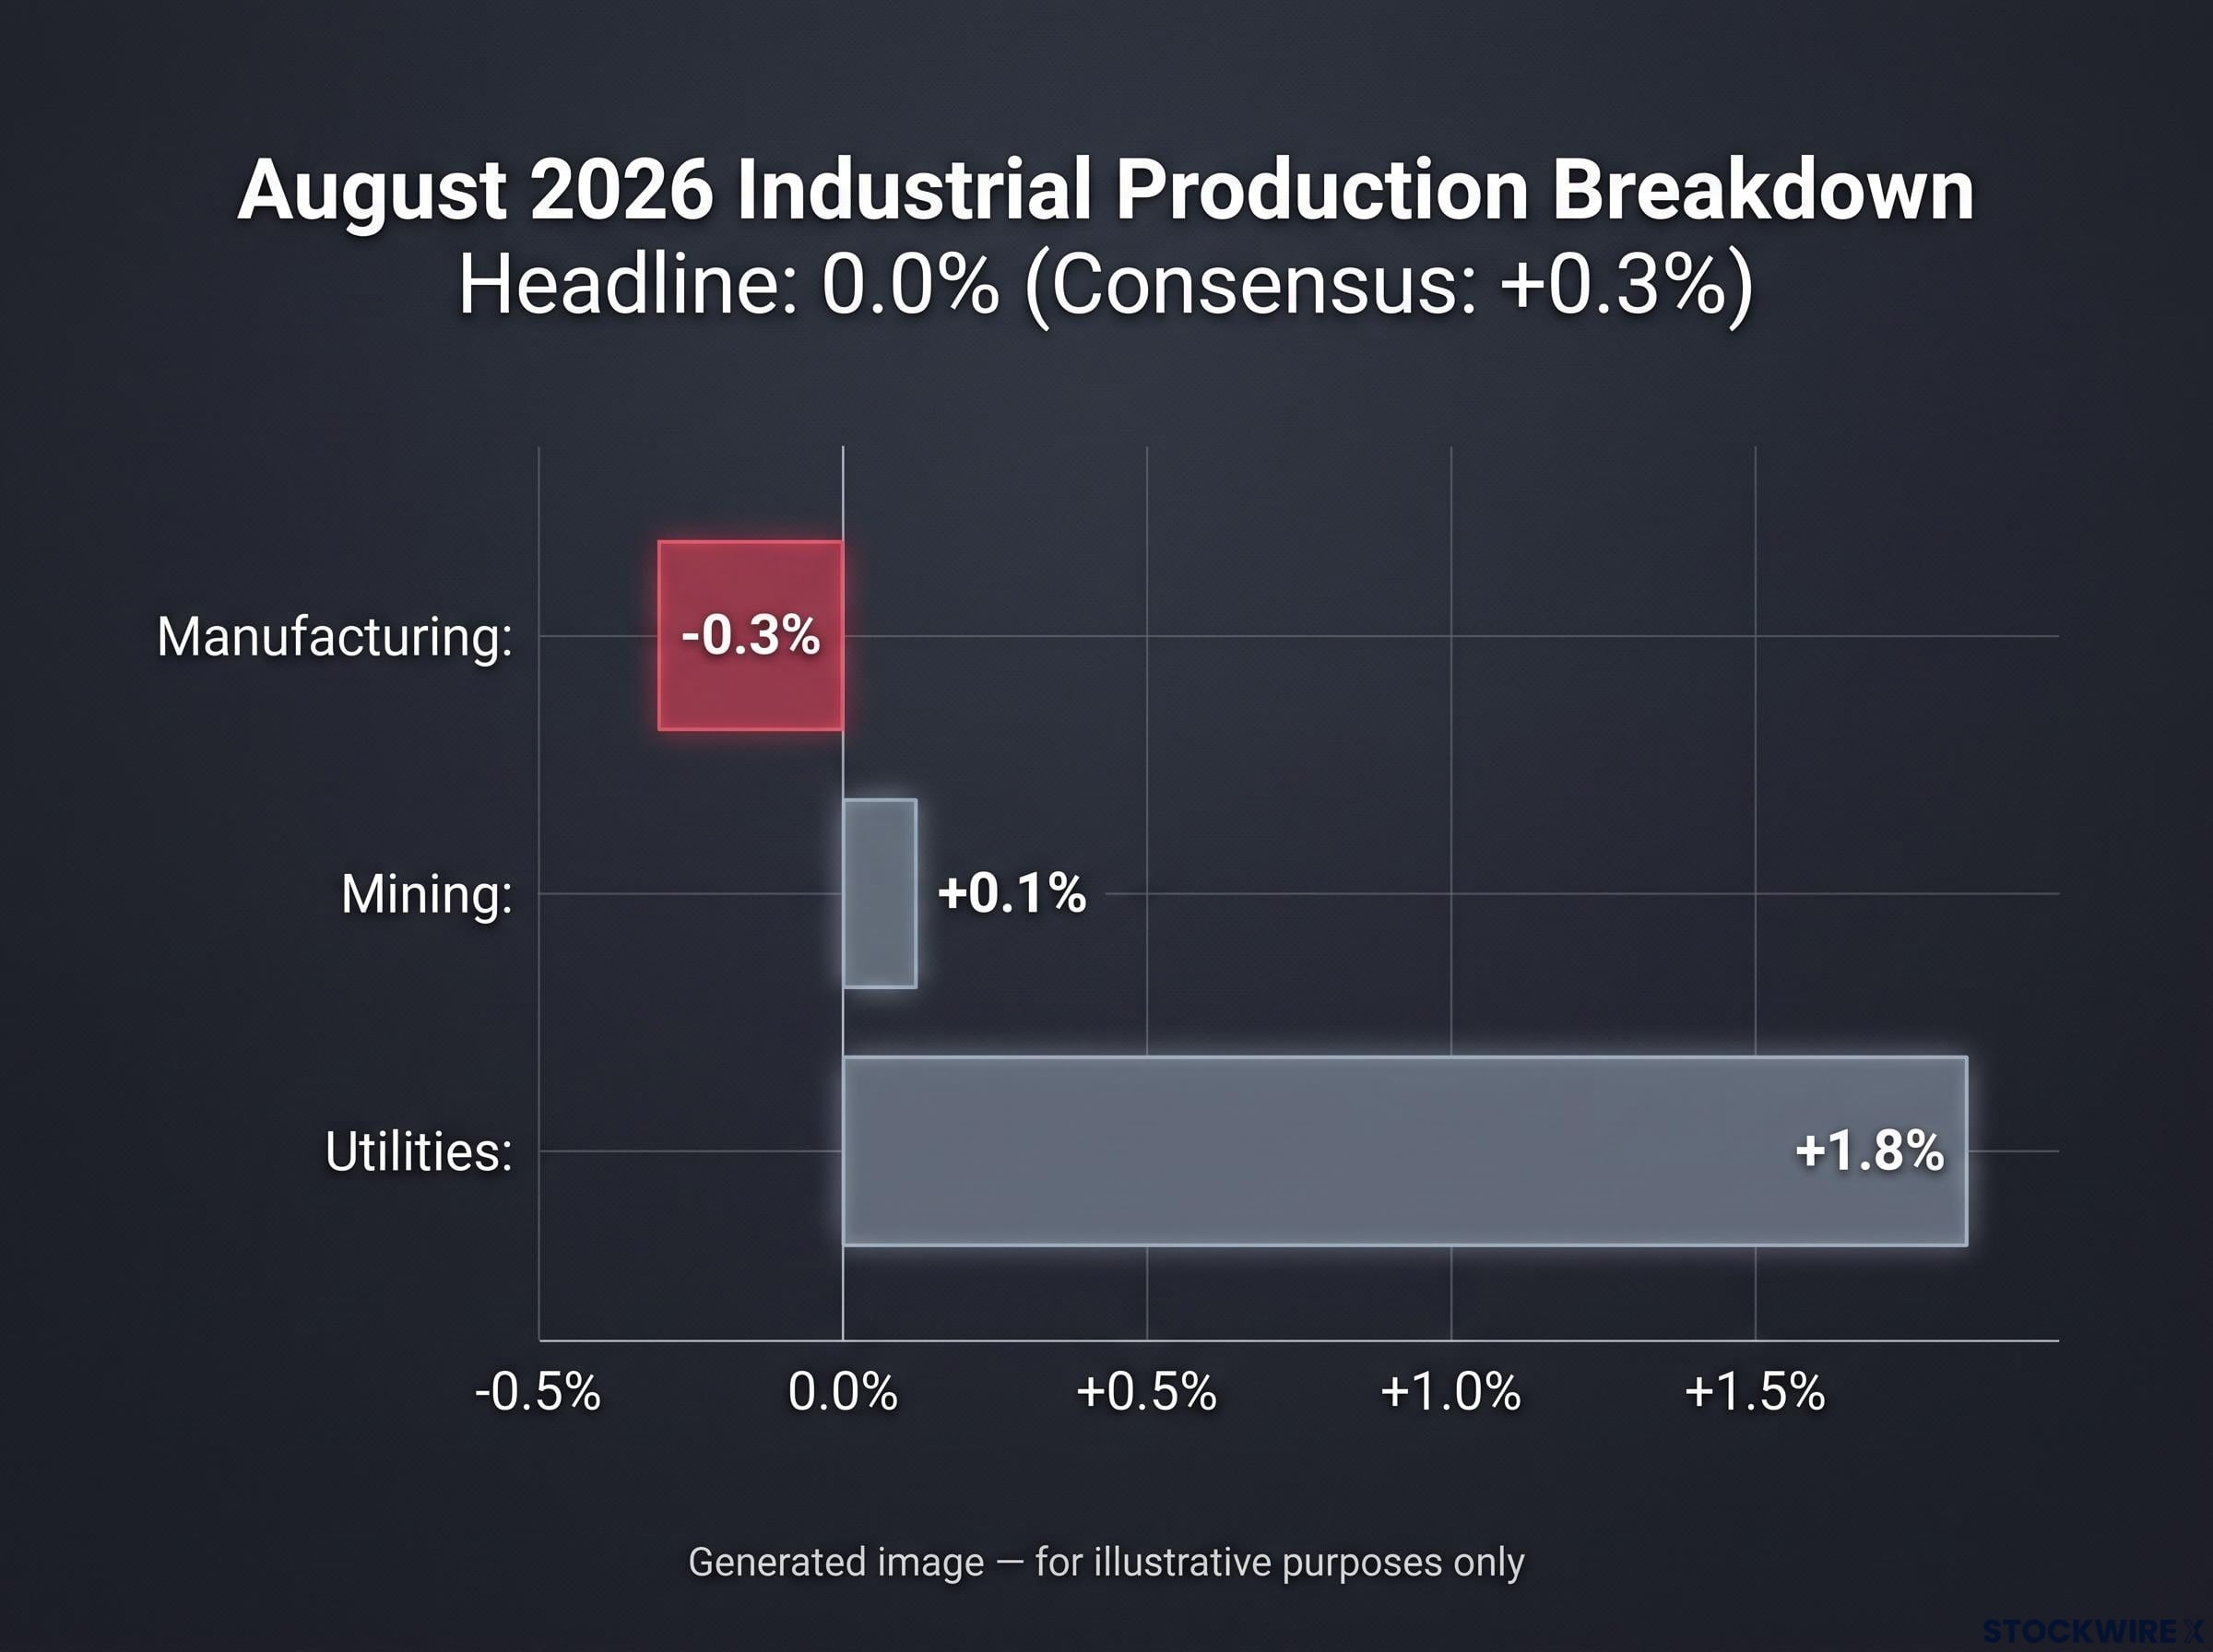
The DJIA contains no mining or utility company, meaning the sub-readings that partially rescued the August headline do not correspond to any constituent’s core business.
Strip out mining and utilities, and the part of the economy that drives orders for Caterpillar’s equipment, Honeywell’s control systems, and 3M’s adhesives went backwards. If you hold Dow industrials, the manufacturing line is your signal. The composite is background.
The Federal Reserve G.17 release breaks manufacturing, mining, and utilities into separate sub-indices, giving you the granular component data that the composite headline obscures, which is exactly why the manufacturing line rather than the aggregate is the relevant signal for Dow industrial constituents.
Two ways analysts are reading the same number
The same figure is supporting two genuinely different interpretations, and both deserve a hearing.
The stagnation camp treats flat output as a warning. Reuters, in its 18 September 2026 coverage, noted that the flat headline and the manufacturing decline arrived despite expectations for growth, with higher energy costs and rates potentially keeping activity subdued through year-end. KPMG has described comparable near-zero readings in the past as strikingly weak whenever manufacturing fails to recover toward earlier peaks.
The transitional camp reads it as noise. On a year-over-year basis, industrial production is still expanding, up +1.42% in August against +1.13% in July, per YCharts data. ITR Economics has pointed out that overall output can stay positive even when manufacturing dips, and Reuters cited analysts crediting an artificial intelligence buildout for sustaining capital-goods demand in ways the headline aggregate does not capture.
Neither side is obviously right, and the debate is worth leaving open. For you as a holder of Dow industrials, it crystallises into one question: is Caterpillar’s 40% run reflecting genuine capital-goods demand, or has it decoupled from the manufacturing trend that would normally drive equipment orders? The next durable goods release, covering August data and scheduled for 25 September 2026, is the input that starts to answer it.
Why the Dow’s industrial label creates a recurring misread risk
Step back from August for a moment, because this is not a one-off quirk of 2026. A price-weighted index sending a misleading sector signal is a recurring event, and the pattern has a long history.
The Dow has worn the “industrial” name since 1896. Today just 4 of its 30 members actually carry that sector classification, and the index’s five financial members collectively outweigh the four industrials. The label is a legacy descriptor, not a description of what the index currently holds.
The legacy industrial label the Dow still carries traces back to 1896, when the index genuinely did track railroads and heavy industry, but the composition has since drifted so far toward technology, financials, and health care that institutional investors now treat it as a blue-chip sentiment gauge rather than an economic read.
History shows how far these mechanics can drift from reality. Tickeron documented in April 2026 a non-confirmation in which the Dow Transportation Average surged 29% in a single month while the Dow Industrials gained only 7%, the widest gap between the two since 1989. Back in 2006, SloppyAI notes, the Transportation Average fell 15% while the Industrials rallied to record highs over the following year. In both cases, price-weighted mechanics produced signals that had little to do with actual freight volume or factory output.
The methodology “rewards expensive-looking stocks, not economically important ones.”
That characterisation, from AlphaTechFinance in January 2026, is the whole problem in a sentence. Many strategists consequently treat the Dow as a blue-chip sentiment gauge rather than a reliable barometer of US industrial health, and the current Caterpillar dynamic is a live illustration of why.
Here are three rules of thumb worth keeping when you read a Dow industrial signal:
- Check whether the move is Caterpillar-driven before accepting it as sector-wide.
- Cross-reference it against the manufacturing sub-reading of industrial production, not the composite.
- Treat the Dow as a measure of blue-chip sentiment, not as output data for the real economy.
The takeaway is durable. The Dow’s industrial identity is structural, not compositional, and mistaking one for the other is how you attribute a single company’s idiosyncratic run to the entire manufacturing economy.
How to read a DJIA industrial headline from here
You now have everything you need to turn this into a repeatable habit rather than a one-time insight.
The first question, every time the Dow moves on industrial news, is not whether the sector is healthy. It is whether the price of one high-weighted stock, currently Caterpillar at roughly 9.49%, is doing the moving. Answer that before you accept any broader conclusion.
The next concrete test arrives on 25 September 2026 at 12:30 GMT, with the August durable goods release. Durable goods orders are a more granular instrument than aggregate industrial production because they measure actual new orders for long-lasting equipment, the very demand that should be feeding Caterpillar’s order book if the rally is real. For reference, July orders rose 1.1% to $339.3 billion, beating the +0.5% consensus, with orders excluding transportation up +0.4%.
Durable goods headline misreads follow a pattern worth recognising: the June 2026 report posted a 0.3% gain that looked like a miss against a 1.6-2.5% consensus forecast, yet the underlying ex-transportation series had risen for 14 consecutive months, a streak that the top-line figure entirely obscured.
Here is a three-step checklist to apply:
- Identify whether a Dow industrial move is Caterpillar-driven or genuinely broad-based.
- Cross-check the manufacturing sub-reading of industrial production, ignoring the mining and utilities components.
- Wait for the durable goods print to assess capital-goods demand independently of the index.
None of this means the Dow is broken. It remains a legitimate and widely used blue-chip sentiment tool. Using it as a proxy for US industrial production in 2026, though, requires exactly this level of compositional awareness.
This article is for informational purposes only and should not be considered financial advice. Investors should conduct their own research and consult with financial professionals before making investment decisions.
When one stock’s price run and the manufacturing data tell different stories
Three pieces sit behind this whole picture. Price-weighting lets share price, not company scale, set index influence. That mechanic hands Caterpillar a Dow voice larger than its three industrial peers combined. And flat August output, with manufacturing actually contracting, means the economic data underneath that dominant stock is not obviously keeping pace.
The tension between them is the story. A Caterpillar-led Dow can look industrially strong while the manufacturing sub-reading points the other way, and those two signals cannot both be complete.
The 25 September 2026 durable goods release is the coming test. It will start to show whether Caterpillar’s run reflects genuine capital-goods momentum or has moved out ahead of the underlying demand.
Past performance does not guarantee future results, and forward-looking data is subject to market conditions and various risk factors. The Dow is a legitimate instrument. Read with an eye on what it actually weighs, and it becomes far harder to misread.