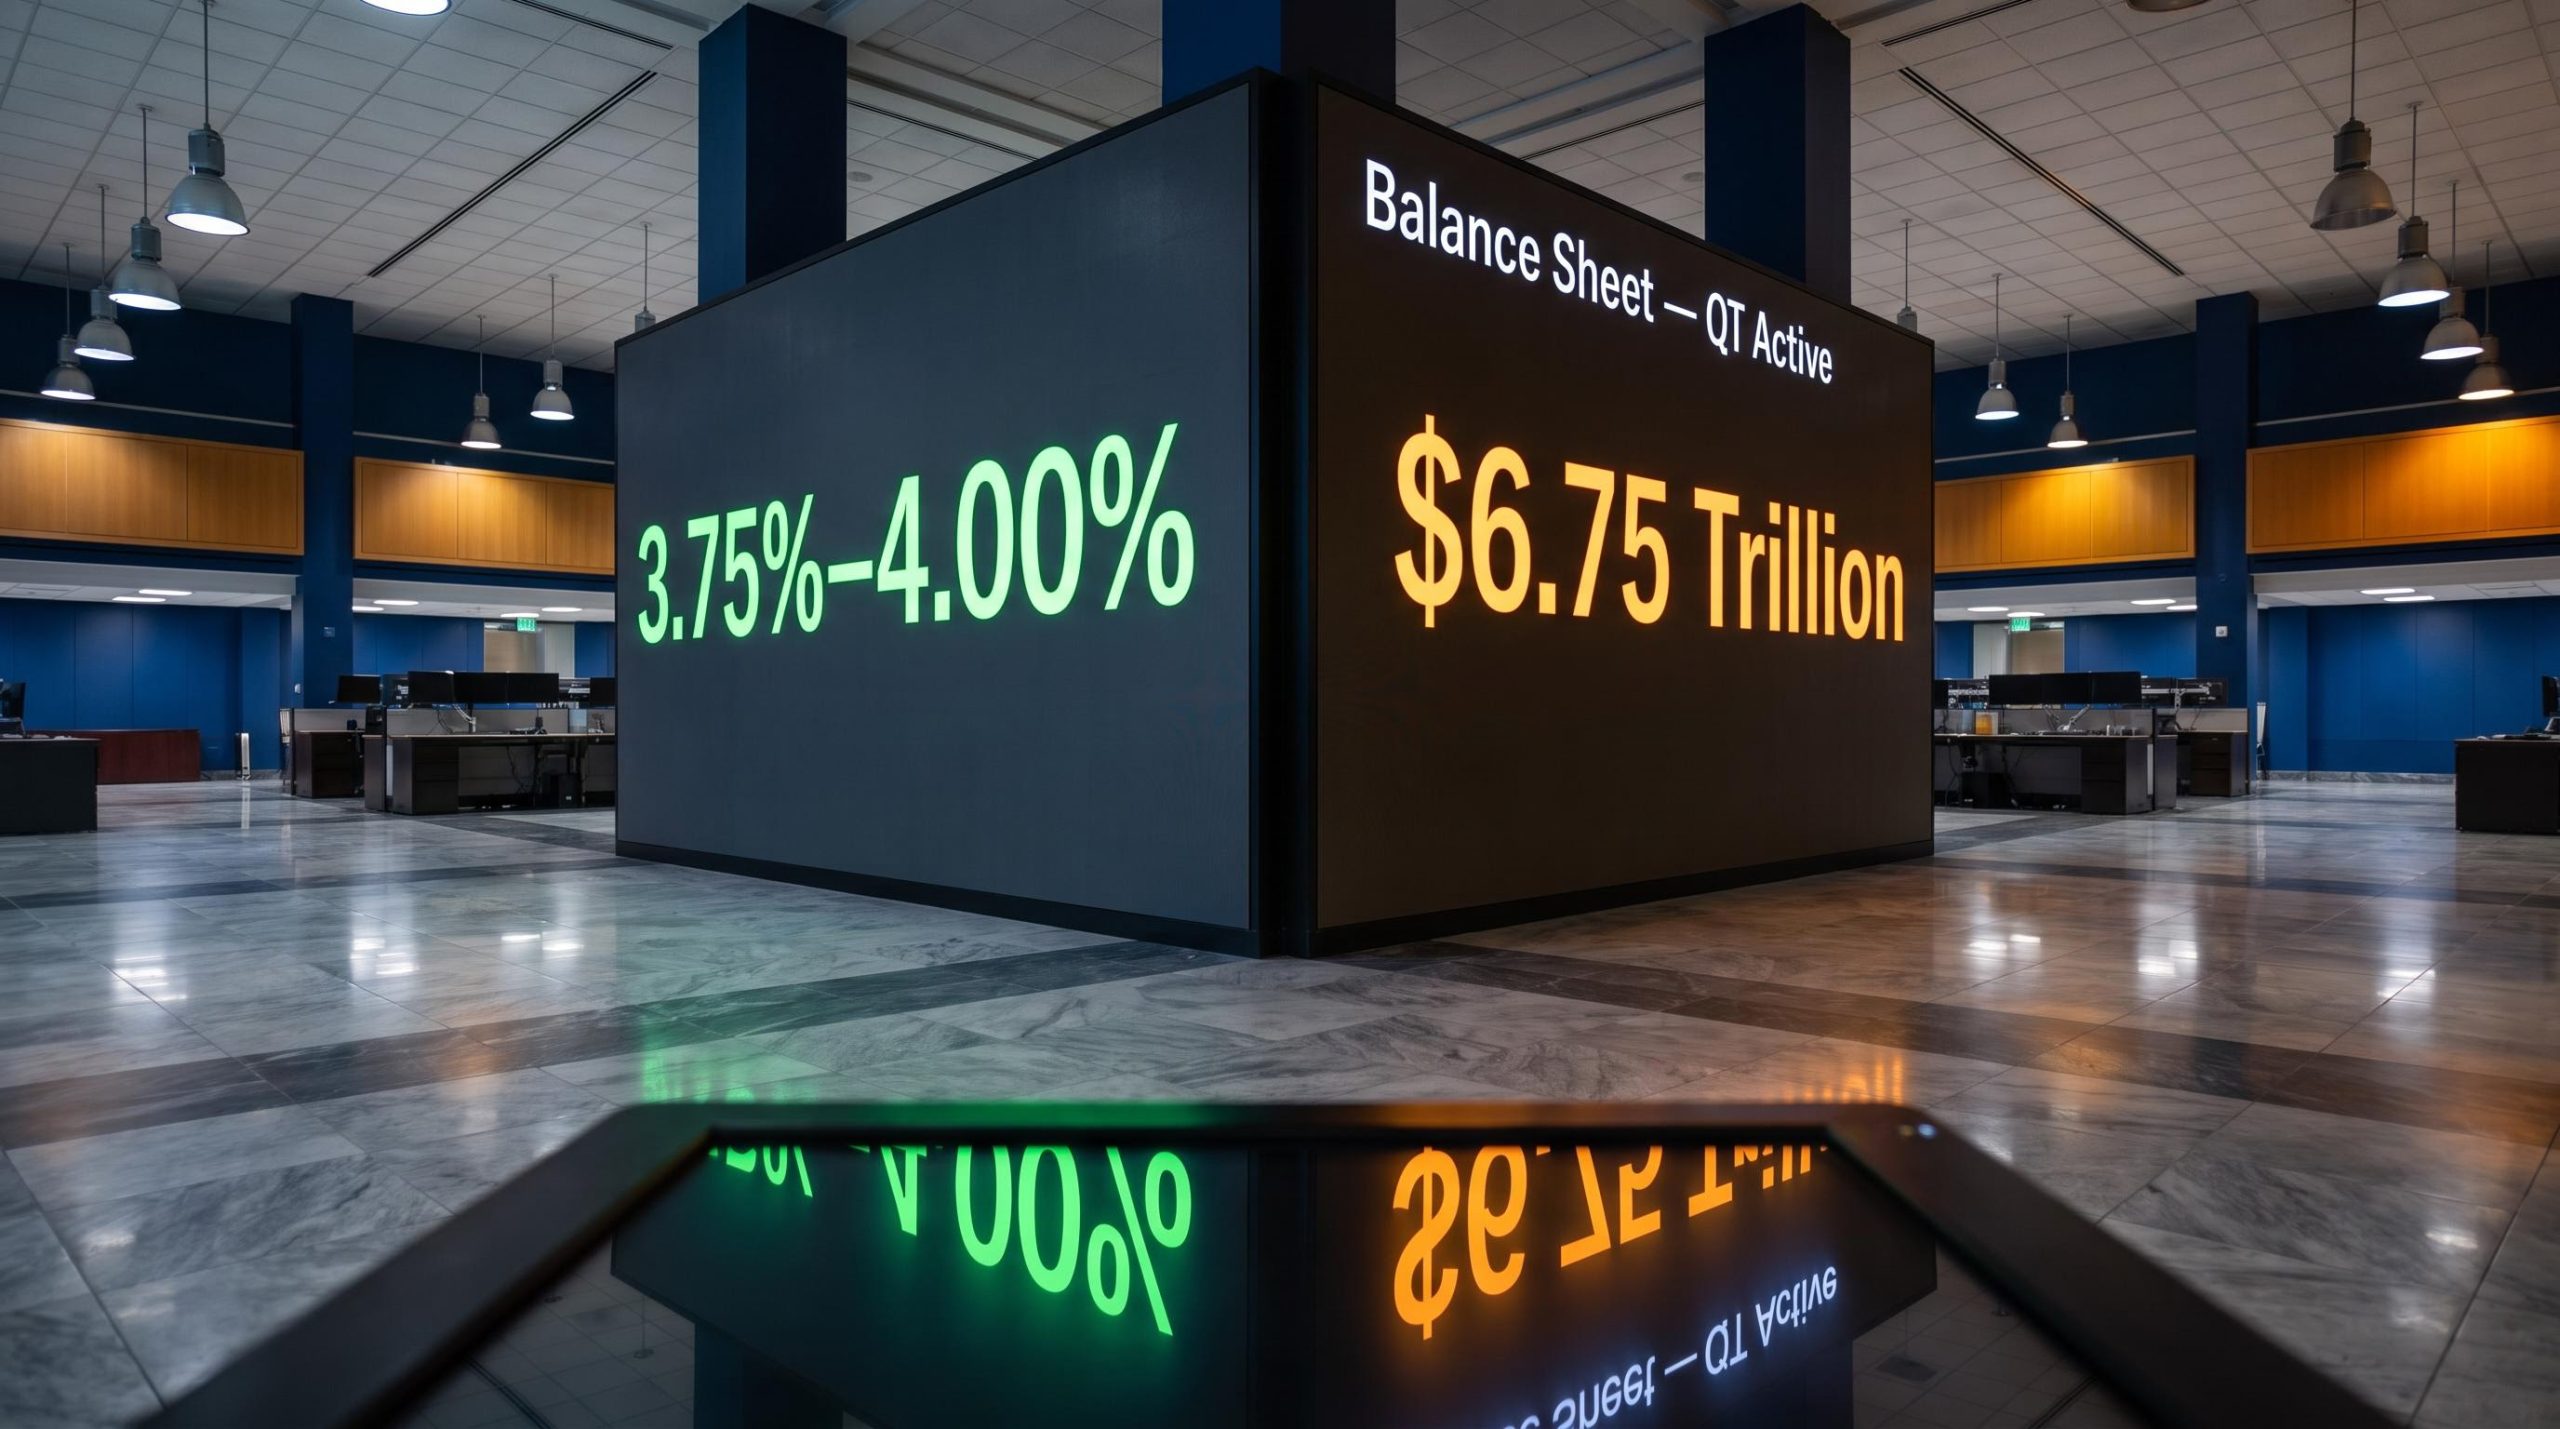
You probably follow the Fed’s meeting outcomes closely. When rates move, you notice. But could you explain, in one clean sentence, the difference between what the Federal Reserve is doing with interest rates and what it is doing with its $6.75 trillion balance sheet?
Most self-directed investors cannot, and that gap is more expensive than it looks. On 17 September 2026, the Fed’s new target rate took effect at 3.75%-4.00%, its first hike since 2023. Kansas City Fed President Jeffrey Schmid keeps calling inflation “stubborn” and “sticky.” Meanwhile, the balance sheet is still shrinking in the background through a process called Quantitative Tightening. Three separate levers, all pulling in the same direction, all at once.
This is why understanding the Federal Reserve policy tools matters right now, not as a civics lesson but as a positioning question. What follows here is a working map of each tool, how they interact, and what today’s specific configuration actually means for the decisions in front of you.
What the Fed is actually trying to do, and why it has more than one way to do it
Before you can read any single tool, you need to know what the Fed is optimising for. The answer is its dual mandate: price stability and maximum employment.
Price stability has a formal number attached to it. The Fed targets 2% inflation, and it measures this using the Personal Consumption Expenditures (PCE) index, its preferred gauge of how fast prices are rising. Maximum employment is the other half, the goal of keeping as many people working as the economy can sustain without overheating.
Here is why this matters to you rather than to a textbook. The mandate is a decision rule. When the Fed tells you inflation is too high, it is telling you which half of the mandate is currently dominant, and therefore which direction every policy lever is pointed.
Right now, the read is clear:
- Inflation: Above target. August 2026 CPI rose 0.4% month-over-month, an annualised pace near 4.8%, and PCE inflation has sat above 2% since March 2021.
- Employment: Broadly balanced. Schmid has described the labour market as largely in balance with the economy on solid footing.
With inflation dominant, all three tools are configured to tighten, not to support growth. That single fact tells you more about the current environment than any individual data release.
How the FOMC makes its decisions
The body that pulls these levers is the Federal Open Market Committee (FOMC). It meets eight times a year to weigh the data and set policy, with the federal funds rate as its primary instrument.
Twelve officials vote: the seven members of the Board of Governors, the President of the New York Fed, and four regional Fed presidents who rotate through on annual terms. That structure blends a permanent core with rotating regional voices.
The September 2026 hike was unanimous. When every voting member lines up behind a move, that is consensus-level conviction, not a close call decided on the margin.
When big ASX news breaks, our subscribers know first
The interest rate lever: what it moves and how fast
Start with what a rate change actually touches on day one. The federal funds rate is the interest banks charge each other to borrow reserves overnight. It is not a single fixed number but a target range, and September 2026’s decision set that range at 3.75%-4.00%, effective 17 September 2026.
The New York Fed’s monetary policy implementation framework is the operational backbone behind FOMC decisions, covering how open market operations translate the target federal funds rate into actual market conditions each trading day.
From that overnight starting point, the change works outward. Vice Chair Philip Jefferson has described the transmission mechanism as a set of channels through which the rate move spreads into the real economy. The table below walks through the five main ones.
| Channel | What it affects | How it moves under higher rates | Typical lag |
|---|---|---|---|
| Interest rate | Loans, mortgages, corporate bonds | Borrowing costs rise, dampening spending | Weeks to months |
| Expectations | The full yield curve | Signals about future rates reprice the term structure | Near-immediate |
| Credit and bank-lending | Bank reserves and lending capacity | Tighter credit conditions, reduced lending | Months |
| Asset-price and wealth | Equity and real-asset valuations | Higher discount rates lower valuations and wealth | Months |
| Exchange rate | The value of the dollar | Higher US rates strengthen the USD | Weeks to months |
The expectations channel deserves a closer look because it is the fastest and the most fragile. NBER research emphasises that transmission depends heavily on how policy shifts expectations about the future path of rates. If markets doubt the Fed’s commitment, the whole mechanism can weaken or turn volatile.
Then there is the timing problem, often summarised as “long and variable lags.”
Why patience is the whole game Rate changes can take anywhere from a few months to a couple of years to fully work through inflation and real activity. This is not an academic footnote. It is the reason the Fed hiked again in September 2026 even though the current cycle began back in 2022: prior hikes had not fully filtered through the system when inflation proved stickier than expected.
Long and variable lags in monetary transmission mean that even a well-calibrated hike can take twelve to twenty-four months to fully suppress demand, which is precisely why the Fed hiked again in September 2026 rather than waiting for prior tightening to finish its work.
For you, the practical read is about sequencing. Rate-sensitive corners like mortgages and short-duration bonds reprice almost immediately. Corporate capital expenditure and consumer durables lag by months or longer. Where you sit on that timeline changes which positioning decisions are urgent and which can wait.
QE and QT: the balance-sheet tools most investors misread
Interest rates are only the first lever. The second one, the balance sheet, feels abstract until you understand the specific problem each version of it was built to solve.
Quantitative Easing (QE) exists for a moment when the rate lever runs out of room. When the federal funds rate hits the zero lower bound, effectively as low as it can go, cutting further does nothing. In March 2020, the Fed cut rates to 0%-0.25% and could go no lower, so it turned to buying bonds instead.
Quantitative Tightening (QT) is the reverse gear. Instead of buying, the Fed lets bonds mature without replacing them, draining liquidity from the financial system.
Here is the clean distinction between the two:
- Quantitative Easing. Trigger: rates hit the zero lower bound and cannot fall further. Mechanism: the Fed buys Treasuries and mortgage-backed securities, lowering long-term yields through what economists call the portfolio-balance effect (reducing the supply of bonds pushes their prices up and yields down). Dollar effect: tends to weaken the USD by expanding money supply. Asset-price effect: supports equities and risk assets.
- Quantitative Tightening. Trigger: the Fed wants to normalise after a period of easing. Mechanism: bonds are allowed to run off without reinvestment, sometimes supplemented by active sales. Dollar effect: tends to support the USD by draining liquidity. Asset-price effect: removes a tailwind from risk assets.
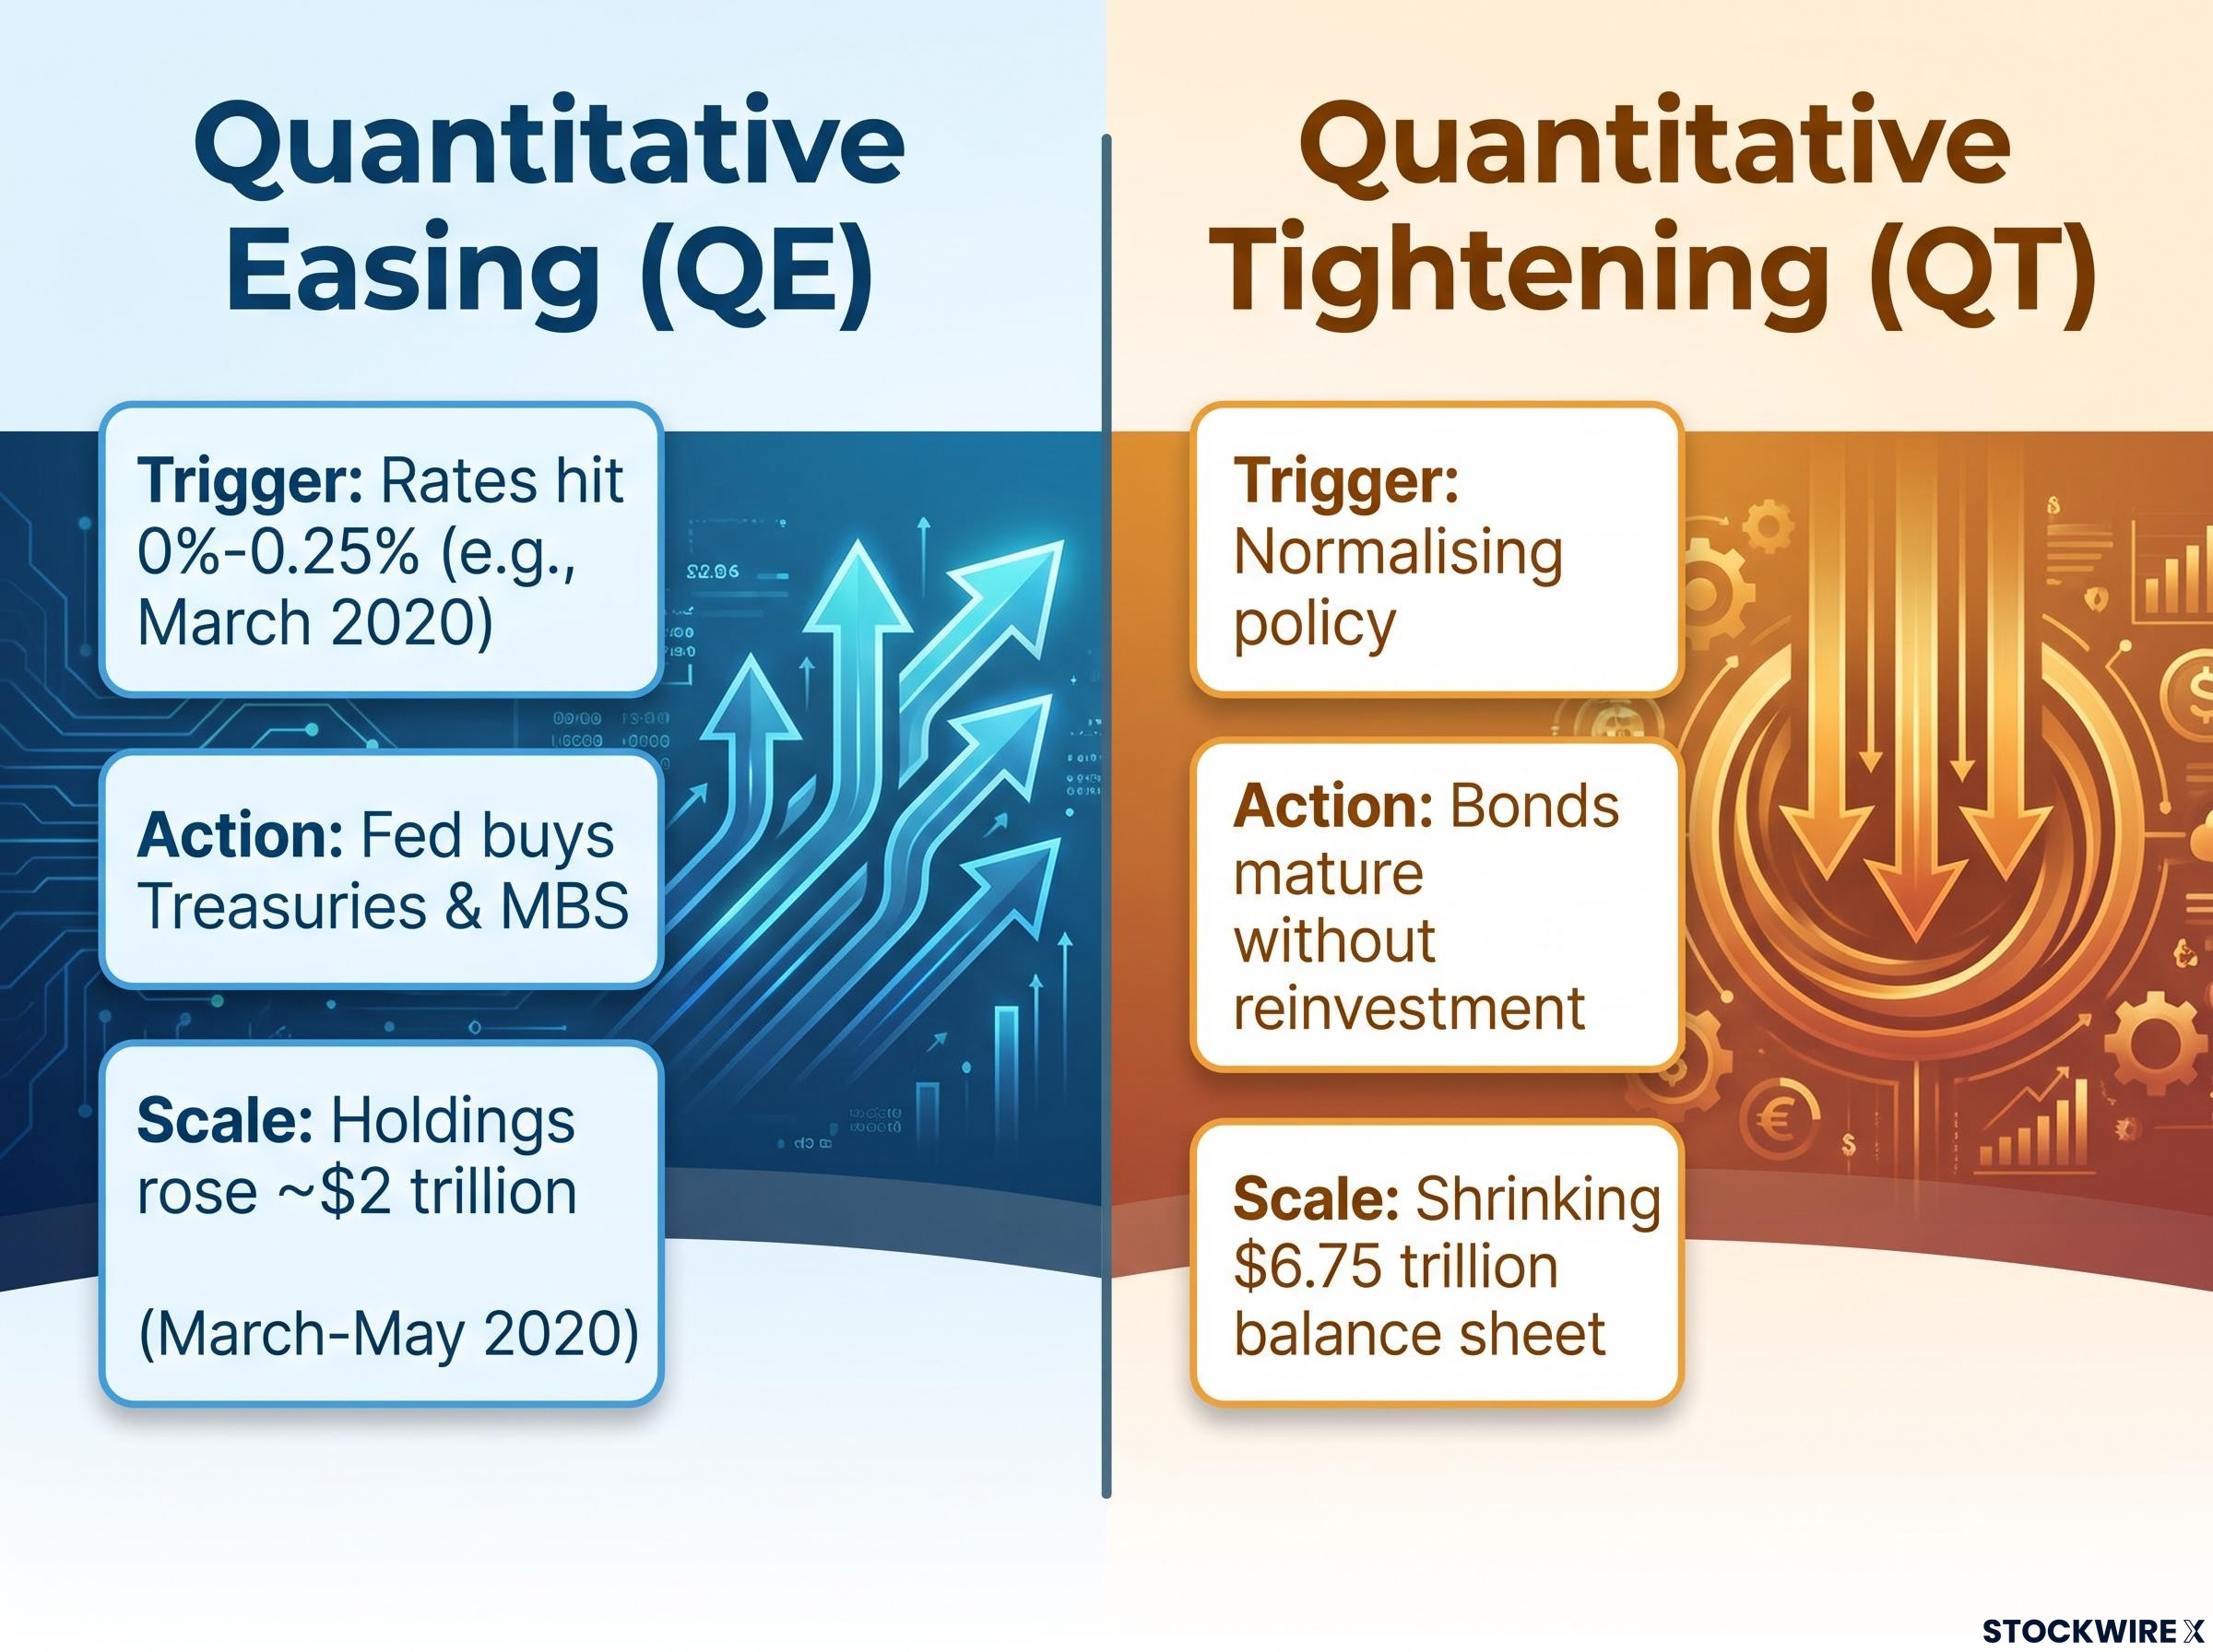
The Fed has deployed QE twice. The 2008 financial crisis was the first, when rate cuts hit the floor and the Fed launched large-scale asset purchases to stabilise markets. COVID was the second, and the scale was staggering: securities holdings rose by roughly $2 trillion in just two months between March and May 2020, according to Brookings analysis.
That legacy is still with you today.
The largest peacetime balance sheet in US history As of 16 September 2026, the Fed’s total assets stood at approximately $6.75 trillion (H.4.1 data showing $6,746,548 million). This is not a technical detail for central bank researchers. It is the second policy lever currently affecting your borrowing costs, the strength of the dollar, and the liquidity available in the markets you invest in. And it is still shrinking.
If you track only the federal funds rate, you are watching one hand while the other moves the balance sheet. That is a real risk, because QT carries its own hazard. In October 2025, Reuters reported widespread concern among economists that QT could strain funding markets if reserves fall faster than the system can absorb, with many calling for an announced end to the runoff.
Why the Fed cannot simply sell its way out overnight
You might wonder why the Fed does not just sell its bonds and shrink the balance sheet quickly. The answer is disruption.
Active securities sales are rare and jolt markets far more than passive runoff, so the Fed prefers to let bonds mature quietly. That preference is exactly why QT is often described as operating “in the background” relative to the drama of rate decisions, even though its effects on liquidity and the dollar are entirely real.
What the current policy configuration means for your portfolio
You now have the framework, so here is the payoff. The current configuration is unusually coherent: federal funds rate at 3.75%-4.00%, balance sheet at $6.75 trillion and shrinking, inflation running near 3% against a 2% target, and a September 2026 hike that was unanimous and unmistakably a return to tightening.
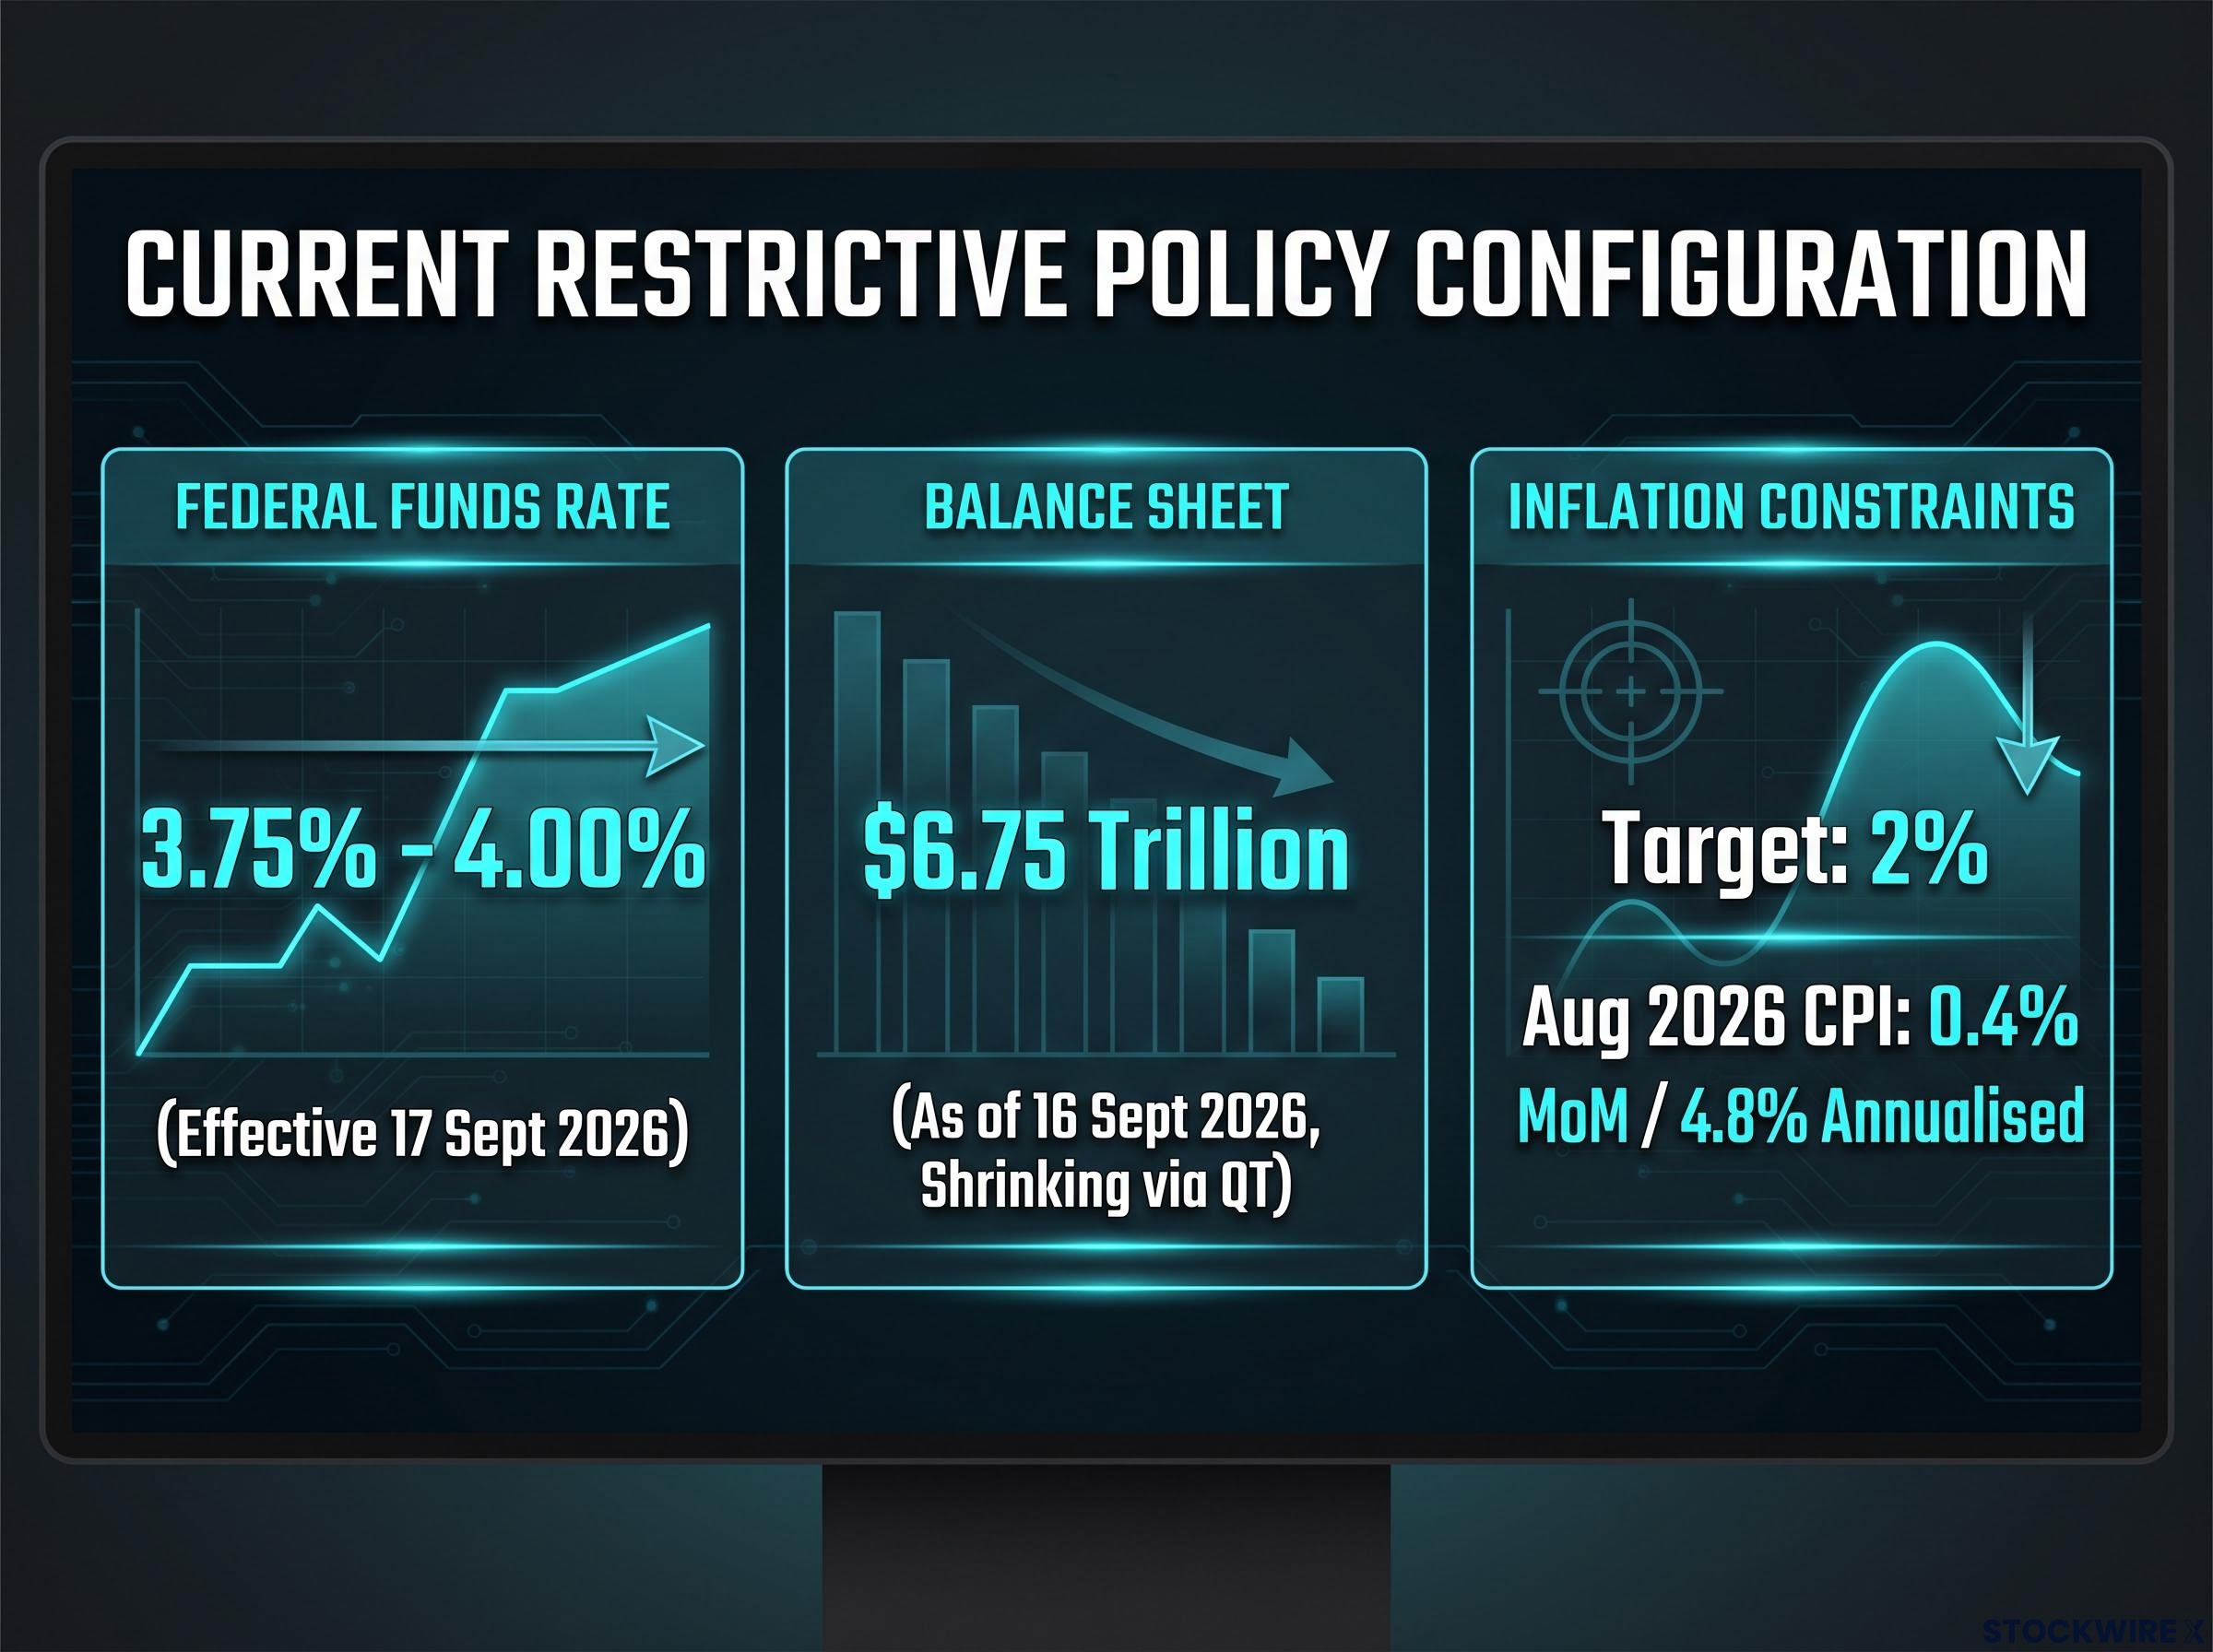
Each piece of that configuration lands differently across asset classes. The table below breaks it down.
| Asset class | Effect of current Fed configuration | Key risk to watch |
|---|---|---|
| US growth equities | Higher discount rates compress valuations of distant cash flows | Sensitivity to any further hawkish surprise |
| US value and defensive equities | Relatively better positioned given pricing power and lower leverage | Still exposed if growth slows materially |
| Short-duration Treasuries | Higher yields make them competitive with equities | Reinvestment risk if rates eventually fall |
| Investment-grade credit | Attractive yields relative to the zero-rate era | Spread widening if conditions tighten further |
| Non-US assets (USD risk) | Strong dollar pressures returns when converted back | Particular strain on EM borrowers in dollars |
The equity read is straightforward. Higher rates raise discount rates, which compresses the present value of future cash flows, and growth stocks with earnings far out in the future feel it most. Quality, value, and defensive sectors tend to hold up relatively better when rates stay elevated.
Fixed income tells the opposite story. Higher bond yields make short-to-medium duration Treasuries and investment-grade credit genuinely competitive with equities, more so than at any point in the near-zero-rate years.
Term premium dynamics in long-dated Treasuries have been doing meaningful tightening work independently of FOMC votes, with the 30-year yield hitting 5.311% intraday on 17 August 2026, reducing the urgency for the Fed to hike further while keeping restrictive conditions in place.
On currency, elevated US rates relative to other economies support a strong dollar. That helps if you hold foreign assets measured in dollar terms, but it creates real currency risk for non-US exposure and squeezes emerging market borrowers who owe in dollars.
The Fed’s own read on inflation On 27 August 2026, Schmid told CNBC that inflation was “stubborn” and “sticky.” On 16 July 2026 he described it as roughly double the Fed’s 2% target. When a voting member frames inflation this way, it signals the internal conviction that above-target prices are the binding constraint on policy.
The final piece is duration, and history is instructive. The Volcker-era disinflation of the early 1980s pushed the federal funds rate above 19%, required roughly 5 percentage points of core CPI disinflation to return toward target, and kept rates elevated for several years before the Fed judged its credibility restored. The post-COVID period reinforced the lesson: inflation stayed high longer than forecasters expected even after rapid hikes.
The Volcker comparison is not alarmism. It is a data point about how long the Fed has historically been willing to stay restrictive when its inflation credibility is on the line, and that timeline has direct implications for how long you should expect this configuration to last. J.P. Morgan Asset Management’s September 2026 FOMC note framed the unanimous hike as reflecting persistent above-target inflation and a reluctance to ease prematurely.
A “higher for longer” environment is a positioning regime, not a slogan. If you built strategies around near-zero rates, you face real adjustment decisions across equity duration, credit quality, currency exposure, and cash management, and they are unlikely to resolve in a single FOMC cycle.
Past performance does not guarantee future results. Financial projections are subject to market conditions and various risk factors.
When the Fed might shift, and what to watch for
The obvious question now is when this all changes. Rather than hand you a rate forecast, here is something more useful: the three signals that would tell you the restrictive stance is genuinely turning.
- PCE inflation trajectory. Signal achieved when PCE shows a sustained, durable move back toward 2%, not a single soft month. Remember it has run above target since March 2021, so the bar for “durable” is high.
- Labour market deterioration. Signal achieved when conditions soften materially over multiple months, not on one weak jobs print. Schmid has repeatedly noted the labour market remains broadly balanced, which is why the pivot bar sits high here.
- QT communications. Signal achieved when the Fed explicitly signals slowing or ending the balance-sheet runoff. Given the October 2025 economist concerns about funding-market strain, watch reserve levels and any language about the pace of QT.
Knowing what to watch beats any forecast, because these three are the Fed’s own stated criteria. When all three move in the same direction at once, a genuine shift becomes plausible rather than wishful.
Why the pivot trade has disappointed investors before
Markets love to price a pivot early, and they have been burned for it. Through 2021 and 2022, traders repeatedly priced in an imminent Fed turn that simply did not arrive.
The structural reason is the expectations channel working in reverse. Markets price the shift they want, but the Fed responds to data, not to market pricing. Schmid’s own 31 October 2025 dissent, when he voted against a rate cut because “inflation remains too high” and policy was only “modestly restrictive,” shows exactly how high the hawkish wing sets the bar. If you track the three signals directly instead of reacting to pivot narratives, you position on evidence rather than anticipation.
Fed Chair credibility is itself a market variable, because a central bank whose independence is questioned faces a higher bar to shift expectations through forward guidance alone, and the Nixon-Burns episode confirmed that political accommodation of loose policy can entrench inflation for years rather than months.
Reading the Fed’s playbook as an investor, not a spectator
Strip everything back and the framework is simple. Rate policy sets the price of money today; QE and QT manage the quantity and availability of money in the system. Right now, both levers point in the same restrictive direction.
The current read fits on a single line: a 3.75%-4.00% funds rate, a $6.75 trillion balance sheet still shrinking through QT, inflation near 3% against a 2% target, and a unanimous FOMC prepared to stay restrictive until disinflation is clearly secured. “Higher for longer,” in the words of both Schmid and J.P. Morgan, is the operating posture until the disinflation path is durable.
Dual mandate alignment shifted briefly in August 2026 when July payrolls contracted by 23,000 and core CPI fell simultaneously, the first time both sides of the mandate pointed toward easier policy in the current cycle, before September’s unanimous hike reset the tightening narrative.
That framework is your practical filter for everything ahead. When the next Fed statement lands or a data release moves markets, you can now tell a pause in hikes apart from a genuine pivot, and a QT slowdown apart from actual easing. That is the difference between reading signal and reacting to noise, and it is a level of precision most market commentary does not offer.
This article is for informational purposes only and should not be considered financial advice. Investors should conduct their own research and consult with financial professionals before making investment decisions.