
The European Central Bank raised its deposit facility rate to 2.50% on 10 September 2026, and its most dovish Governing Council member, Olli Rehn, declined to push back against market expectations for still-higher rates. Yet the evidence for the hawkish case, the second-round inflation effects that would justify prolonged restrictive policy, is conspicuously missing from the data.
That gap between the tone and the numbers is the tension investors in the euro are currently being asked to price.
The structural backdrop makes it sharper still. The Federal Reserve holds its funds target at 3.75-4.00%, roughly 125-150 basis points above the ECB, and its September dot plot lifted the median end-2026 projection to 4.1%, up from 3.8% in June. ECB hawkishness is not being assessed in isolation; it is being weighed against a Fed still projected to climb.
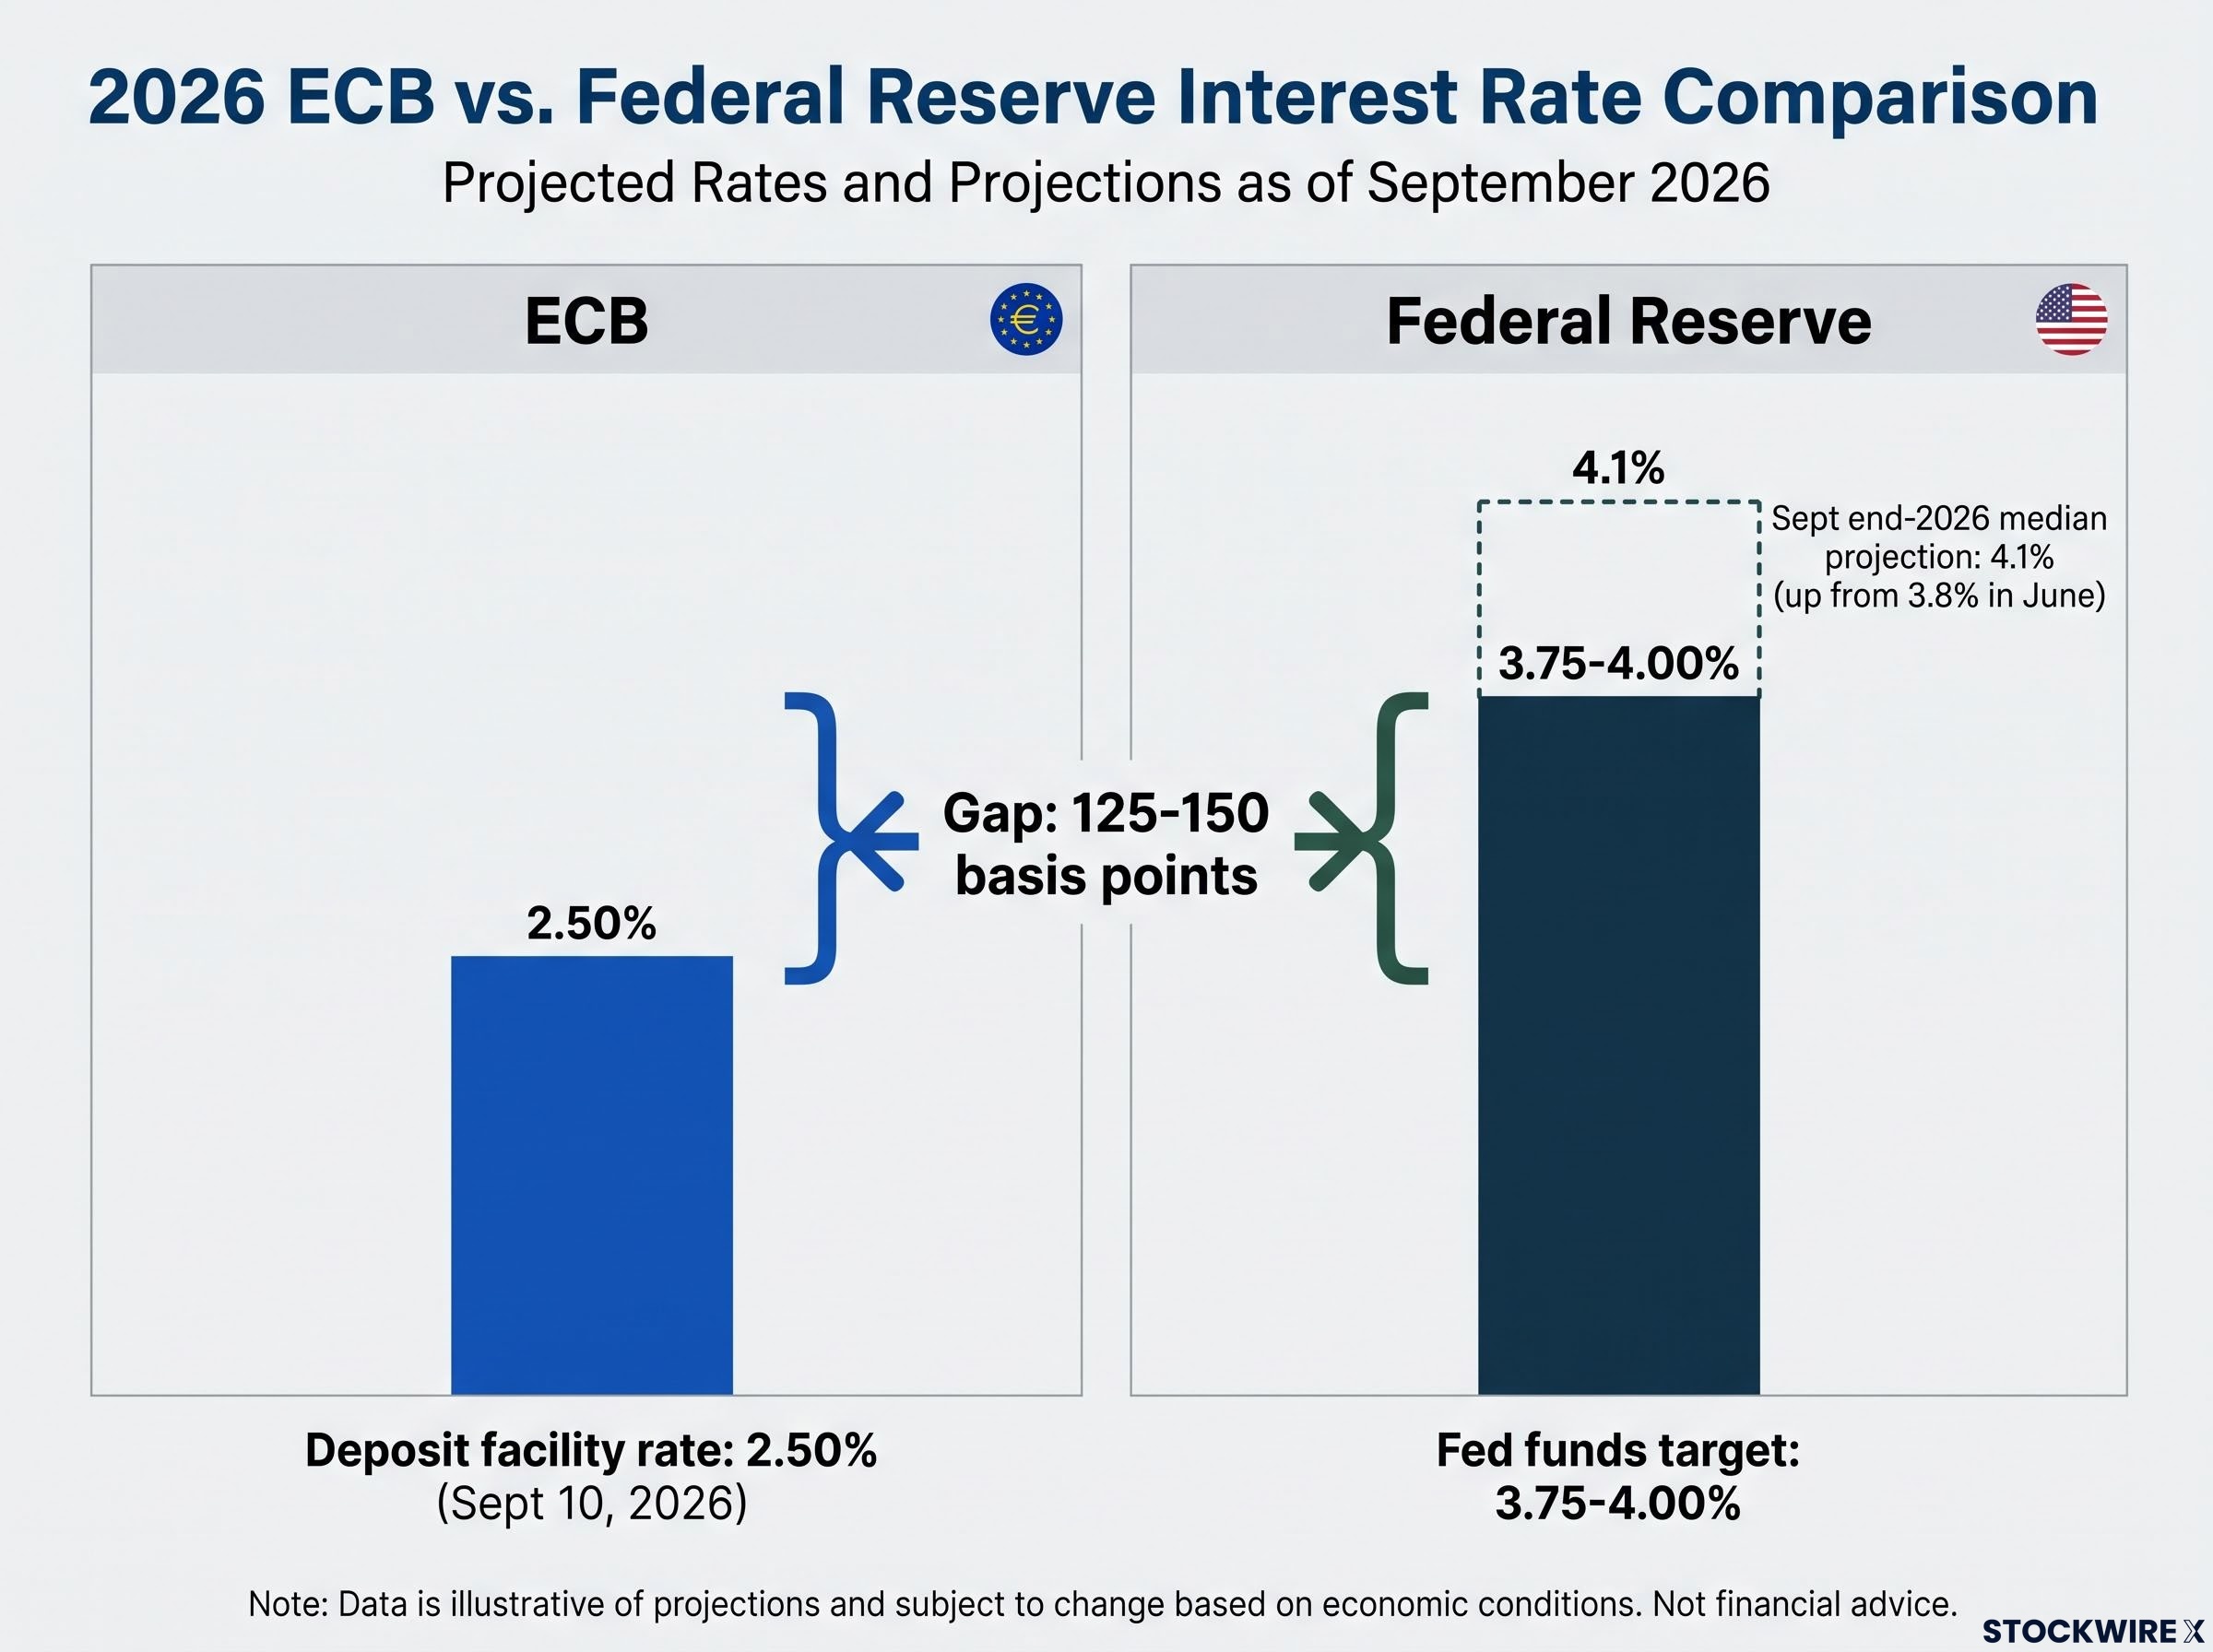
This analysis equips you to read ECB communications for what they actually signal, identify the precise conditions under which the hawkish floor narrative holds, and recognise the specific triggers that would push EUR/USD toward the 1.140 downside level ING has flagged.
The ECB Governing Council’s hawk-dove split, and why the dovish silence matters
Three Governing Council members spoke after the September decision, and their remarks sit along a spectrum rather than a single line. Where each landed tells you more about the internal balance of power than the rate decision itself.
The ECB September 2026 monetary policy statement confirmed the 25 basis point increase to the deposit facility rate, bringing it to 2.50% effective 16 September, and set the formal institutional backdrop against which all subsequent Governing Council communications have been interpreted.
- Gabriel Makhlouf (neutral-to-hawkish): treated every upcoming meeting as a live decision point, keeping an October increase on the table.
- Ante Žigman (the most hawkish of the three): stressed the strength of economic growth and the continued need to bring inflation down.
- Olli Rehn (among the Council’s most dovish voices): adopted a neutral stance and, notably, did not challenge the market’s pricing of higher rates.
Rehn’s silence is the analytically meaningful signal here. When the Council’s most dovish member stops resisting the hawkish tide, that is not evidence of genuine consensus. It reads as capitulation, a sign the dovish contingent currently holds limited sway over the messaging.
ING’s read on the internal balance ING interprets Rehn’s neutral posture as confirmation that the dovish faction is relatively weak at present, and does not expect the ECB’s overall tone to shift in the near term.
There is a further wrinkle worth holding onto. All three members publicly acknowledged that there is no evidence of second-round inflationary effects, the wage-price dynamics that would normally underpin a prolonged tightening bias.
Christine Lagarde was also scheduled to speak, though ING expected little new information from her given how recently the last policy meeting concluded.
The practical value for you is this: central bank internal dynamics are hard to observe directly, but the stated positions and the pointed silences of named policymakers are among the most reliable early indicators of where policy is heading. The durability of the ECB’s hawkish stance now hinges on whether incoming data eventually forces that restraint to break. Until it does, the hawkish floor rests on communication, not conviction.
When big ASX news breaks, our subscribers know first
Why the second-round inflation contradiction undermines the hawkish case
To understand what the ECB is nominally responding to, start with the distinction it is built around. First-round inflation comes from direct shocks, energy and food prices spiking. Second-round effects occur when workers and firms re-anchor their wage and price setting to that earlier inflation, so pay chases past price rises, unit labour costs climb, and services inflation stays sticky because services are labour-intensive.
That self-reinforcing loop, the wage-price spiral, is precisely what a hawkish central bank sets out to prevent. The problem is that the data has not been cooperating with the narrative.
What the evidence actually shows on wage dynamics
Euro area wages have accelerated, but not in a pattern that looks like a runaway spiral. The institutional record consistently points the other way.
- The International Monetary Fund (IMF) World Economic Outlook concluded there was little evidence of self-sustaining wage-price spirals in advanced economies, including the euro area, and characterised most wage gains as partial catch-up after a period of real-wage compression.
- ECB Chief Economist Philip Lane and ECB staff analysis have similarly held that wage increases, while above pre-pandemic norms, appear consistent with inflation converging back to target over time, provided they do not accelerate further.
- All three Governing Council members who spoke in September confirmed the same thing: no clear evidence of second-round effects.
That last point is the striking one. The policymakers making the hawkish case are themselves acknowledging the absence of the data that would justify it.
The ECB’s credibility problem with supply-side inflation is not new to September 2026; as early as June, analysts were arguing that rate increases apply the wrong policy tool to an energy-driven price surge that rate hikes cannot resolve by producing more supply.
ING’s observation on the disconnect ING notes that the ECB’s rhetoric has at times looked more hawkish than the wage and core-inflation data would warrant, suggesting the stance may be about signalling resolve and supporting the euro rather than responding to confirmed second-round pressures.
Here is what that tells you about how to weigh the ECB’s posture. If the hawkishness is primarily a tool for anchoring expectations rather than a response to entrenched inflation dynamics, then it is fragile by nature. It is a communication strategy, not a data-backed commitment, and softer growth or inflation prints could force a retreat faster than current market pricing implies.
The distinction matters directly for positioning. Data-driven hawkishness is durable; expectation-management hawkishness is reversible. The current ECB posture leans toward the second kind, which means any euro support it provides should be treated as conditional rather than assured.
How historical ECB-Fed divergence episodes resolve, and what they predict now
Three past episodes of ECB-Fed divergence are worth treating not as history but as a pattern-recognition exercise. Read together, they carry an uncomfortable message: hawkish ECB policy has repeatedly provided only a temporary floor under the euro.
The mechanics of central bank divergence confirm that the trajectory of a rate gap matters more than its absolute level; what drives EUR/USD is whether the differential is still widening, stable, or starting to close, not the size of any single decision.
| Episode | ECB stance | Key condition | EUR/USD outcome |
|---|---|---|---|
| 2011 (Trichet) | Hawkish, rate hikes mid-crisis | Deteriorating fundamentals, sovereign debt stress | Initial strength, then reversal as growth damage surfaced |
| 2014-2015 | Easing toward QE | Fed preparing to tighten, widening gap | Large, sustained euro depreciation |
| 2017-2018 | Signalling gradual exit | Policy gap narrowing, cyclical recovery | Euro strengthened from its lows |
| Current (2026) | Hawkish, second-round effects unconfirmed | Fed at 3.75-4.00%, dot plot median 4.1%, gap set to widen | Contested; 1.140 flagged as downside risk |
In 2011, under Jean-Claude Trichet, the ECB raised rates as the sovereign-debt crisis intensified. The euro firmed briefly on the hawkish contrast, then reversed sharply once the growth damage became visible and policy had to be unwound.
Around 2014-2015, EUR/USD fell heavily as the Fed prepared to tighten while the ECB moved toward quantitative easing, reportedly dropping from levels near 1.40 toward 1.05. That figure is flagged as unverified in the underlying research, so treat it as directional rather than precise, but the direction is the point: a persistent policy gap favouring the US can drive large, sustained euro weakness even without daily drama.
The 2017-2018 episode ran the other way. As the ECB signalled a slow exit and the euro area showed cyclical recovery, EUR/USD rose from its lows.
Mapping the current setup onto the historical pattern
The pattern that emerges is clear enough to act on. Hawkish ECB policy supports the euro only when it is matched by durable Eurozone growth and a narrowing gap with the US. It fails when growth disappoints or the differential widens further.
The current configuration resembles the warning-sign episodes more than the supportive one. The Fed sits at 3.75-4.00% with a dot plot median of 4.1%, the ECB at 2.50%, and second-round effects remain unconfirmed, so the rate gap is set to widen, not narrow.
That makes 2011 the most relevant cautionary analogy. A hawkish ECB stance running ahead of the underlying inflation data can hold the euro up for a while, but it cannot prevent depreciation once the growth damage accumulates. The value of the precedent for you is not prediction but probability: it narrows the plausible range and warns against treating ECB hawkishness as unconditionally euro-positive.
What could tip EUR/USD toward 1.140, and which signals matter most
Turn now from the retrospective to the forward look. The point of ING’s 1.140 level is not to forecast it but to stress-test the euro against the causal chains that would have to activate for it to be reached.
ING’s near-term downside anchor ING identifies a move toward the 1.140 level as a realistic near-term downside risk for EUR/USD.
Positioning analysis from August 2026 identified the 1.14-1.15 support zone as the floor below which a dollar-weakness-driven EUR/USD rally becomes structurally fragile, which is directly consistent with ING’s September identification of 1.140 as the realistic near-term downside anchor.
There are five distinct pathways that could carry the euro there, each with its own leading indicator to monitor.
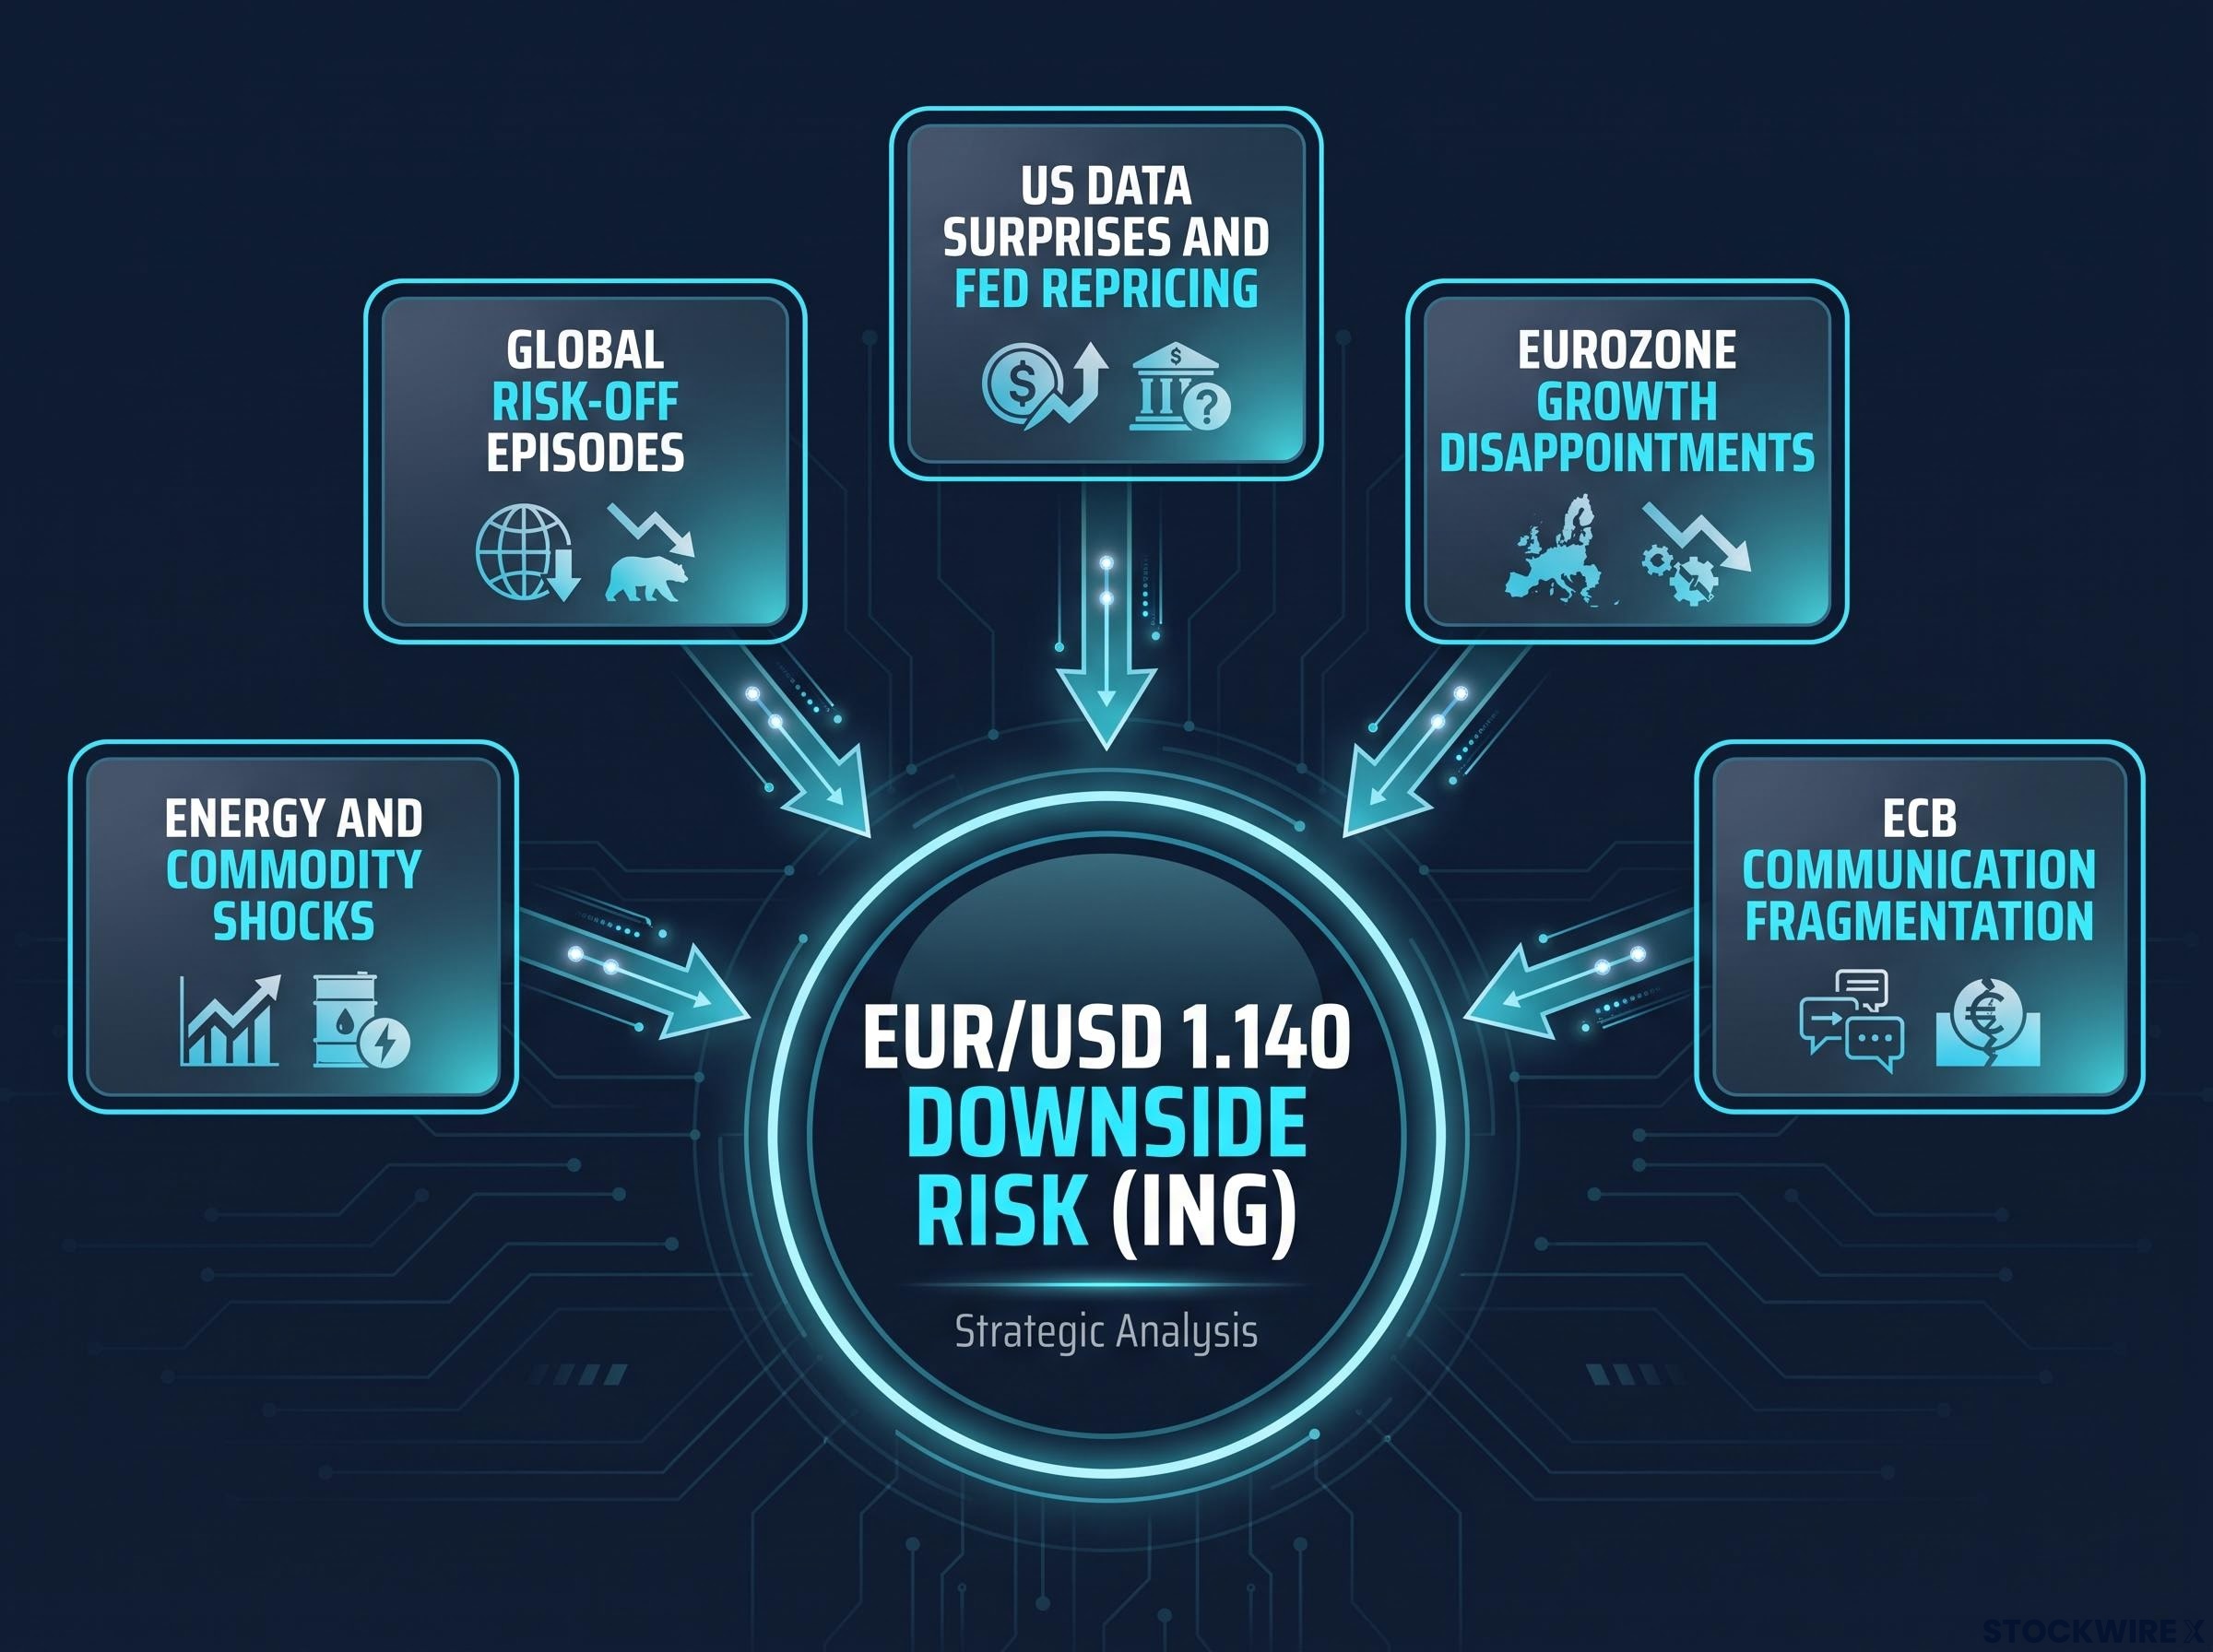
- Energy and commodity shocks. A renewed spike in oil and gas prices hurts the euro area’s terms of trade more than the US, given Europe’s higher import dependence, and can produce a stagflationary mix that is squarely euro-negative. Watch for: sustained rises in European gas and oil benchmarks.
- Global risk-off episodes. In risk aversion, capital moves into US Treasuries and dollar cash, a safe-haven bid that can overpower any ECB support. Watch for: sharp equity sell-offs or geopolitical shocks driving demand for the dollar.
- US data surprises and Fed repricing. Stronger US growth or inflation could push markets to price an even more restrictive Fed than the 4.1% median implies, widening the differential. ING singles this out as a specific near-term risk. Watch for: upside surprises in US data lifting short-term US yields, particularly around key releases.
- Eurozone growth disappointments. Weaker industrial production, PMIs, or labour data could make markets doubt the sustainability of a hawkish ECB and price earlier cuts. Watch for: downside misses in Eurozone activity indicators.
- ECB communication fragmentation. Visible hawk-dove divisions or a perceived readiness to backtrack once growth weakens could erode the euro’s policy premium. Watch for: conflicting Council signals or dovish hints from previously hawkish members.
The framework that matters most is the split between what the ECB can offset and what it cannot. Rhetoric can steer expectations around communication risk and, to a degree, around growth narratives. It cannot control US yield dynamics or global risk-off flows.
Here is what that means for your positioning. The 1.140 level is not a tail scenario; it becomes realistic if even two of these vectors activate together, and the two most likely to fire, US repricing and global risk-off, sit outside the ECB’s control. That should temper how much protective weight you place on ECB hawkishness alone.
Resolving the contradiction, conditions for a durable ECB floor versus a temporary one
Everything laid out so far forces a binary question rather than a balanced shrug. Under what conditions does the hawkish ECB floor actually hold, and under what conditions does it give way?
Two schools of thought frame the answer. The first, associated with ING and several European bank desks, holds that a resolute anti-inflation ECB places a floor under EUR/USD by supporting euro-area real yields and reinforcing inflation-fighting credibility. The second, favoured by many US-based strategists, holds that EUR/USD is driven primarily by US growth surprises, Treasury yields, and global risk sentiment, forces a hawkish ECB cannot outrun.
The evidence in this piece tilts the resolution. With the differential at 125-150 basis points and the dot plot median at 4.1%, the US rate advantage is set to widen before it narrows, and the ECB’s hawkishness looks more like expectation management than a data-backed commitment.
That points to a clean framework for what a durable floor requires.
- Necessary condition: continued hawkish ECB communication, which ING expects in the near term and which provides some support.
- Sufficient condition: that hawkishness matched by holding Eurozone growth, a stable-to-narrowing rate gap, and, crucially, no upside US data surprise that reprices the Fed higher.
ING’s positioning call ING cautions against aggressively pursuing EUR/USD lower from current levels, citing the ECB’s hawkish stance, and anticipates near-term stabilisation rather than an immediate sharp decline.
Here is the single outcome that should most change your view over the next four to six weeks. Watch US non-farm payrolls and CPI. If either prompts a further upward revision to the Fed’s dot plot, that is the clearest signal that US yield dynamics have reasserted dominance, and the ECB floor is temporary support rather than a genuine floor. Absent that, the near-term stabilisation ING expects is the more likely path.
For investors wanting to understand why the Fed’s dot plot median carries greater market-moving weight in the Warsh era than it did under prior communication regimes, our full explainer on Fed dot plot uncertainty covers how the removal of forward guidance converts every data release into a live rate-expectations repricing event.
This article is for informational purposes only and should not be considered financial advice. Investors should conduct their own research and consult with financial professionals before making investment decisions. Past performance does not guarantee future results. Financial projections are subject to market conditions and various risk factors. These statements are speculative and subject to change based on market developments.