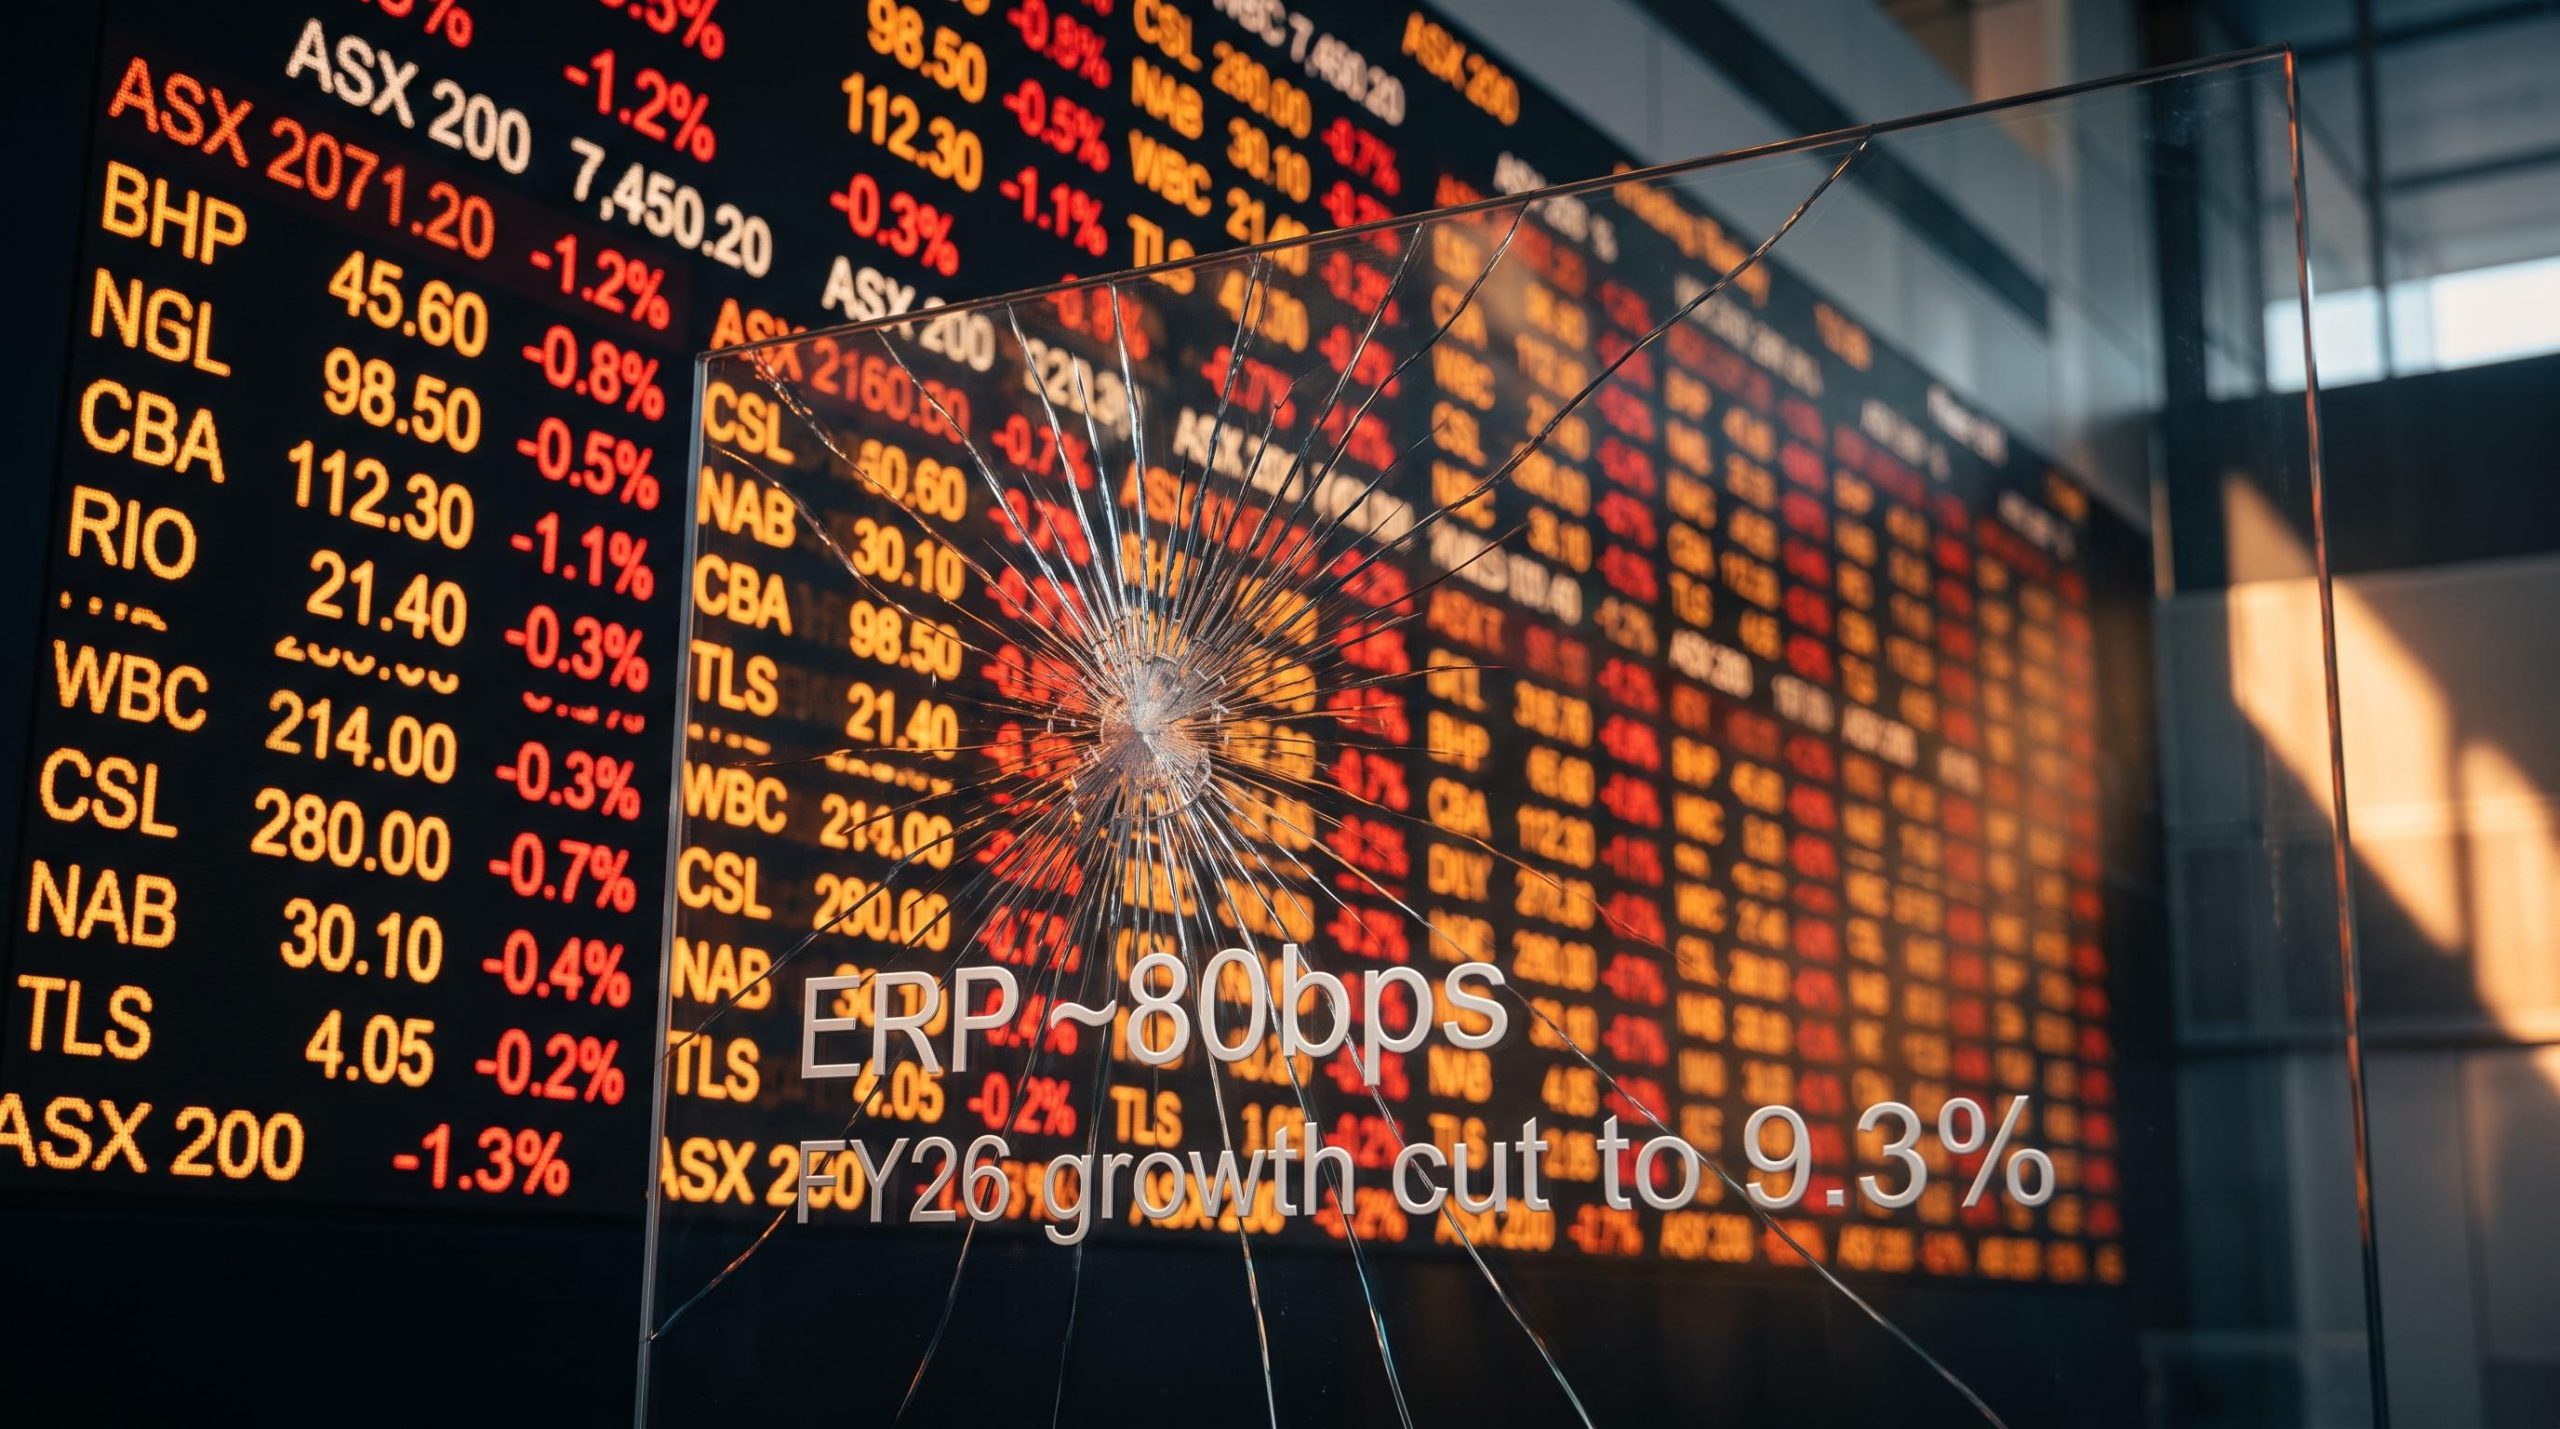
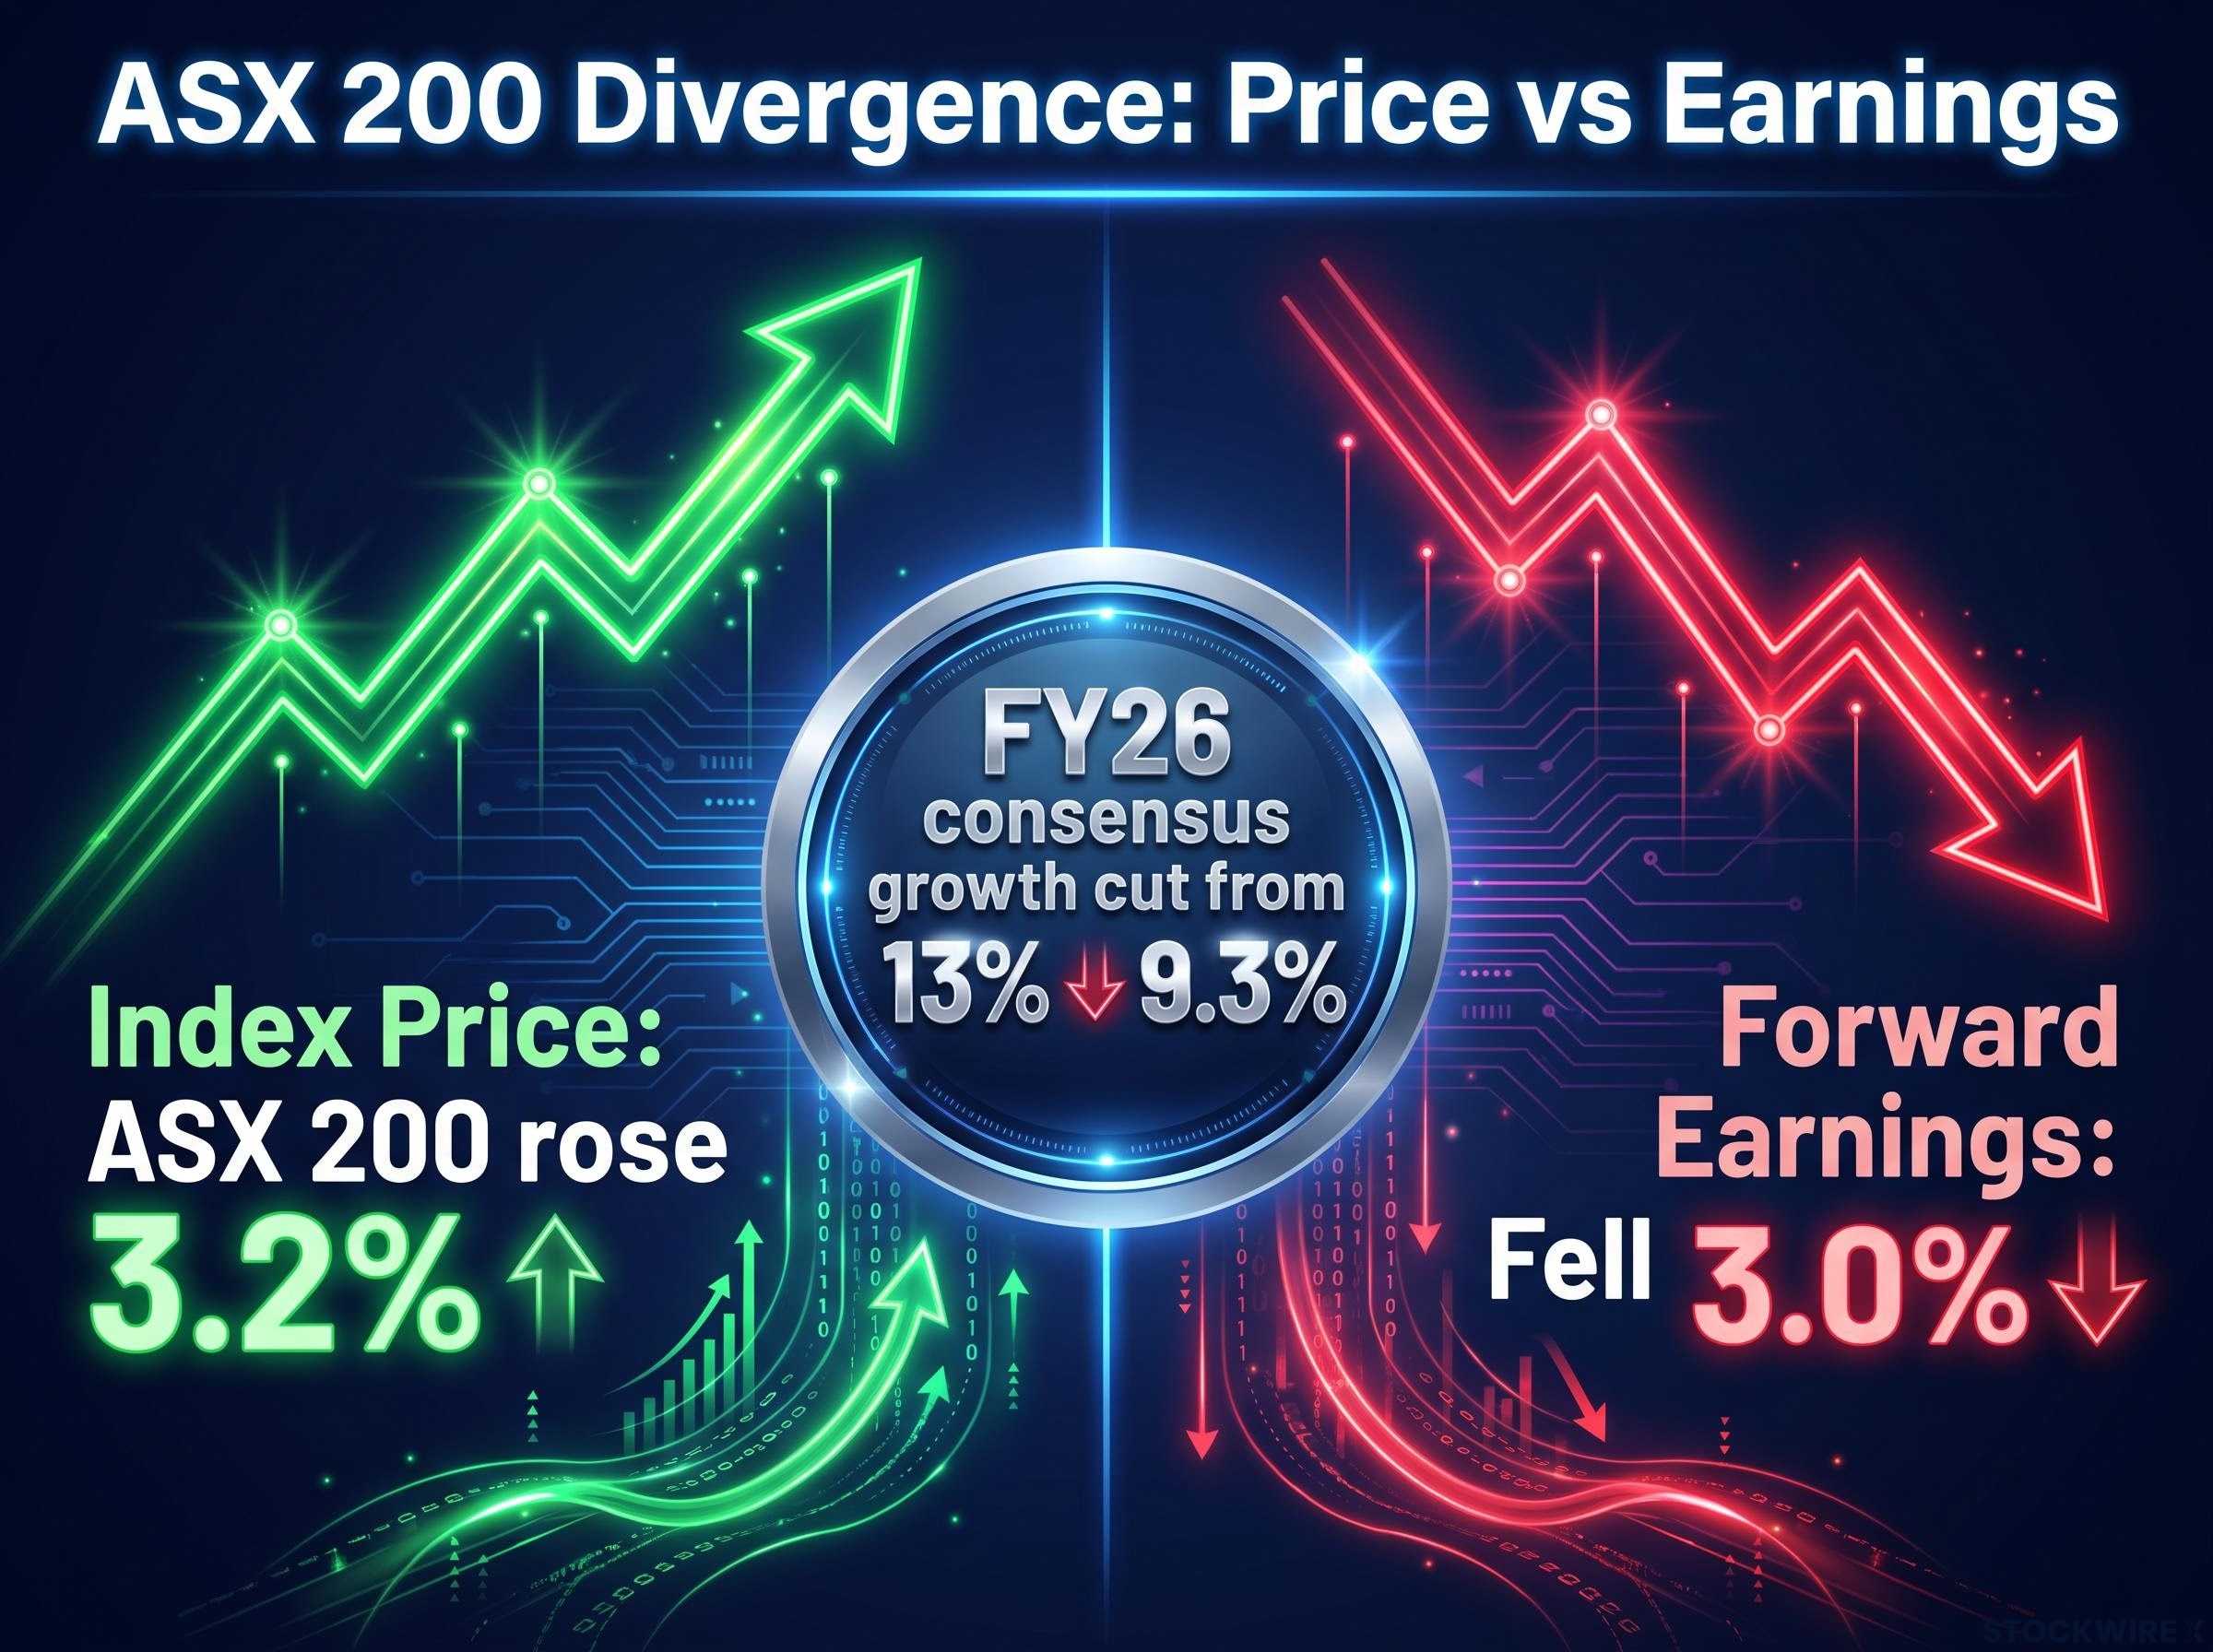
The ASX 200 rose 3.2% through the August 2026 reporting season. Over the same stretch, forward earnings fell 3.0%. Strip away the noise and one uncomfortable fact remains: every point of index gain came from paying more for less.
That gap matters right now, not as an abstraction. The RBA cash rate sits at 4.35% with market pricing implying further tightening, consensus earnings growth for FY26 has been cut from 13% to 9.3%, and nearly half of all ASX 200 constituents moved more than 5% on their own reporting day, a record.
These are the conditions Australian investors are navigating today, not footnotes to it. This analysis gives you a clear framework for reading which parts of the market the data is genuinely warning about, and why the strategic question is no longer whether to hold Australian equities, but how.
The reporting season that exposed the gap between price and profit
Read the August 2026 reporting season on its surface, and the numbers look reassuring. According to Bloomberg, almost half of the S&P/ASX 200 delivered better-than-expected profits, with beats outnumbering misses by roughly 1.5:1.
That is the takeaway most investors would walk away with: companies delivered, the economy held up, earnings proved resilient.
The trouble is that the beat ratio measures what already happened. It says nothing about where earnings are heading, and the forward-looking picture told a very different story.
What the beat ratio misses about the outlook
For every two companies analysts upgraded on forward earnings per share (EPS), three were downgraded. Aggregate earnings for FY26 and FY27 were trimmed by around 1-2%, and consensus FY26 earnings growth was cut sharply, from 13% to 9.3%.
Both numbers are true at once. The 1.5:1 beat ratio and the 3:2 downgrade ratio are measuring different things: one looks backward at reported profit, the other looks forward at estimates. What drives index valuations over the medium term is not how many companies beat last quarter, but the direction estimates are moving. Right now, that direction is down.
| The backward-looking read | The forward-looking read |
|---|---|
| Beats outnumbered misses roughly 1.5:1 on reported profits | Downgrades outnumbered upgrades 3:2 on forward EPS |
| Headline suggests earnings resilience | FY26 growth revised from 13% to 9.3% |
| Index price rose 3.2% through the season | Aggregate FY26/FY27 earnings cut approximately 1-2%; forward earnings fell 3.0% |
The single sharpest datapoint: Consensus FY26 earnings growth was cut to 9.3% from 13%, a downgrade that reframes the entire season.
The clearest sign of how much uncertainty the market is pricing sits in the event-day price swings. According to Global X and corroborated by Goldman Sachs, nearly half of all ASX 200 constituents moved more than 5% on their reporting day, well above the long-run average of 28% and a record.
Stocks lurched even when reported profits were strong, usually because forward guidance was cautious. What this tells you is that companies delivered on the past but are hedging on the future, and the market is repricing violently on every hint of what comes next.
The pattern of violent earnings-day price swings is structural rather than exceptional: JPMorgan data from February 2026 showed more than a third of ASX 200 companies recording moves exceeding three standard deviations on their reporting day, the highest rate in the dataset since 2015.
When big ASX news breaks, our subscribers know first
Why the ASX 200 keeps climbing when earnings are falling
If forward earnings are being cut, why does the index keep setting records? The answer is less about confidence than about mechanics, and once you see the mechanics, the current valuation level starts to look like inertia rather than conviction.
Three forces are doing most of the work:
- Sector concentration: Resources climbed roughly 15%, with Materials growing about 9% and Financials about 8.6%, carrying the headline index while the broader earnings picture stalled.
- Passive and offshore flows: Benchmark-driven passive money and international capital rotating into ASX heavyweights have propped up valuations in expensive banks and miners.
- The “earnings certainty” premium: Investors are paying peak-like multiples for perceived reliability in large financials and resources, while quietly downplaying the warning signs in domestic consumption and housing.
Put together, these forces explain how the index can rise while the fundamentals soften. Since the federal budget, the FY27 earnings estimate for the market fell 2.9%, yet the ASX 200 rose 4.7% over the same window. Price and profit are moving in opposite directions.
That divergence has a cost, and it shows up in the equity-risk premium: the extra return investors demand for holding shares instead of safer assets like cash or bonds. At a forward P/E of 17.5x to 17.8x, against a long-term average near 15x and a trailing P/E of roughly 20x, with the cash rate at 4.35%, that premium has been squeezed to approximately 80 basis points.
The equity risk premium on the ASX 200 has been thin for several months: Morgan Stanley flagged as early as May 2026 that the multiple sat at the upper boundary of the range historically consistent with Australian bond yields in the 5%-6% band, and the revision trail since has only reinforced that warning.
The valuation cushion, quantified: An equity-risk premium of around 80 basis points is historically thin. It means the market is leaving almost no reward for the risk it is taking on.
For you, that thin premium is the whole point. When the buffer is this compressed, any negative surprise on inflation, earnings, or global risk appetite can trigger a repricing the valuation simply cannot absorb.
Not everyone reads it this way. UBS expects around 12% aggregate EPS growth for FY26, which would be the strongest in four years, and argues the multiple remains within the post-Covid range. That is the genuine bull case. But it rests on earnings catching up, and the revision trail so far is pointing the other way.
The distinction matters for how you read the index. Most investors see a rising ASX 200 and infer broad market health. The tools above let you check whether the gains are coming from earnings growth or simply from the market agreeing to pay more for the same earnings. Those are fundamentally different risk propositions.
What the ASX’s own history says about markets that outrun their earnings
This setup is not new, and the most instructive precedent is one the ASX produced itself. In 2019, aggregate EPS expectations for the market were slashed from nearly 9% to 1.6%, and analyst downgrades outnumbered upgrades 7:1.
On the fundamentals, 2019 was a poor year. Yet the ASX 300 delivered a total return of 23.8%.
Where did that return come from? Almost entirely from the market deciding to pay more. Roughly 5% came from dividends, but the earnings revisions dragged returns down by 4.3%, and a 23% expansion in the P/E multiple did the rest. It was a rally built on valuation, not profit.
That is precisely the shape of today’s market: multiple expansion doing the heavy lifting, earnings estimates falling, index leadership concentrated in a handful of heavyweight sectors, and the risk premium squeezed thin.
Forward P/E limitations matter here because the ratio uses analyst estimates as its denominator, and the direction of those estimates, not the level of the ratio itself, is what determines whether a multiple of 17x is comfortably priced or dangerously exposed to a downward revision cycle.
| Condition | 2019 ASX | 2026 ASX |
|---|---|---|
| Forward P/E vs long-run average | Multiple expanded ~23% | 17.5x-17.8x vs ~15x |
| Direction of earnings revisions | EPS cut from ~9% to 1.6% | FY26 growth cut from 13% to 9.3% |
| Primary driver of returns | P/E expansion (earnings a -4.3% drag) | Multiple expansion (forward earnings fell 3.0%) |
| Equity-risk premium context | Compressed under restrictive conditions | ~80 basis points, historically thin |
The 2019 parallel does not forecast a crash. What it tells you is that when multiple expansion drives all of the return, the eventual correction tends to arrive from whichever direction earnings or macro disappoints first.
The global pattern that makes this more than a local concern
The ASX is not alone in producing this setup, and the international record is consistent. Studies of the 1929, 1999 and 2007 markets, alongside cyclically adjusted P/E (CAPE) analysis, which measures valuations against a decade of inflation-adjusted earnings to smooth out short-term swings, point the same way.
When market multiples stretch well above 20x without earnings to support them, the outcome has repeatedly been poor long-run returns or a sharp correction.
Independent models currently put the ASX at an aggregate price-to-fair-value of around 1.23x, above what the fundamentals justify. Heavily concentrated indices like the ASX 200 are especially exposed if the momentum in a few dominant sectors fades.
Rethinking how to hold Australian equities, not whether to hold them
The evidence does not point toward abandoning Australian shares. It points toward a sharper question: which parts of the index carry the valuation risk, and which offer a more defensible earnings base?
That distinction matters because the risk is not spread evenly. Domestic consumption and housing-linked names sit directly in the path of the macro headwind, and the data is already flashing.
ASX small-cap valuations tell a materially different story from the index headline: Morningstar Q2 2026 data showed equal-weighted coverage trading at a 3% discount to fair value while the size-weighted reading sat at a 10% premium, a 13-percentage-point gap driven entirely by the largest names being bid up by passive flows.
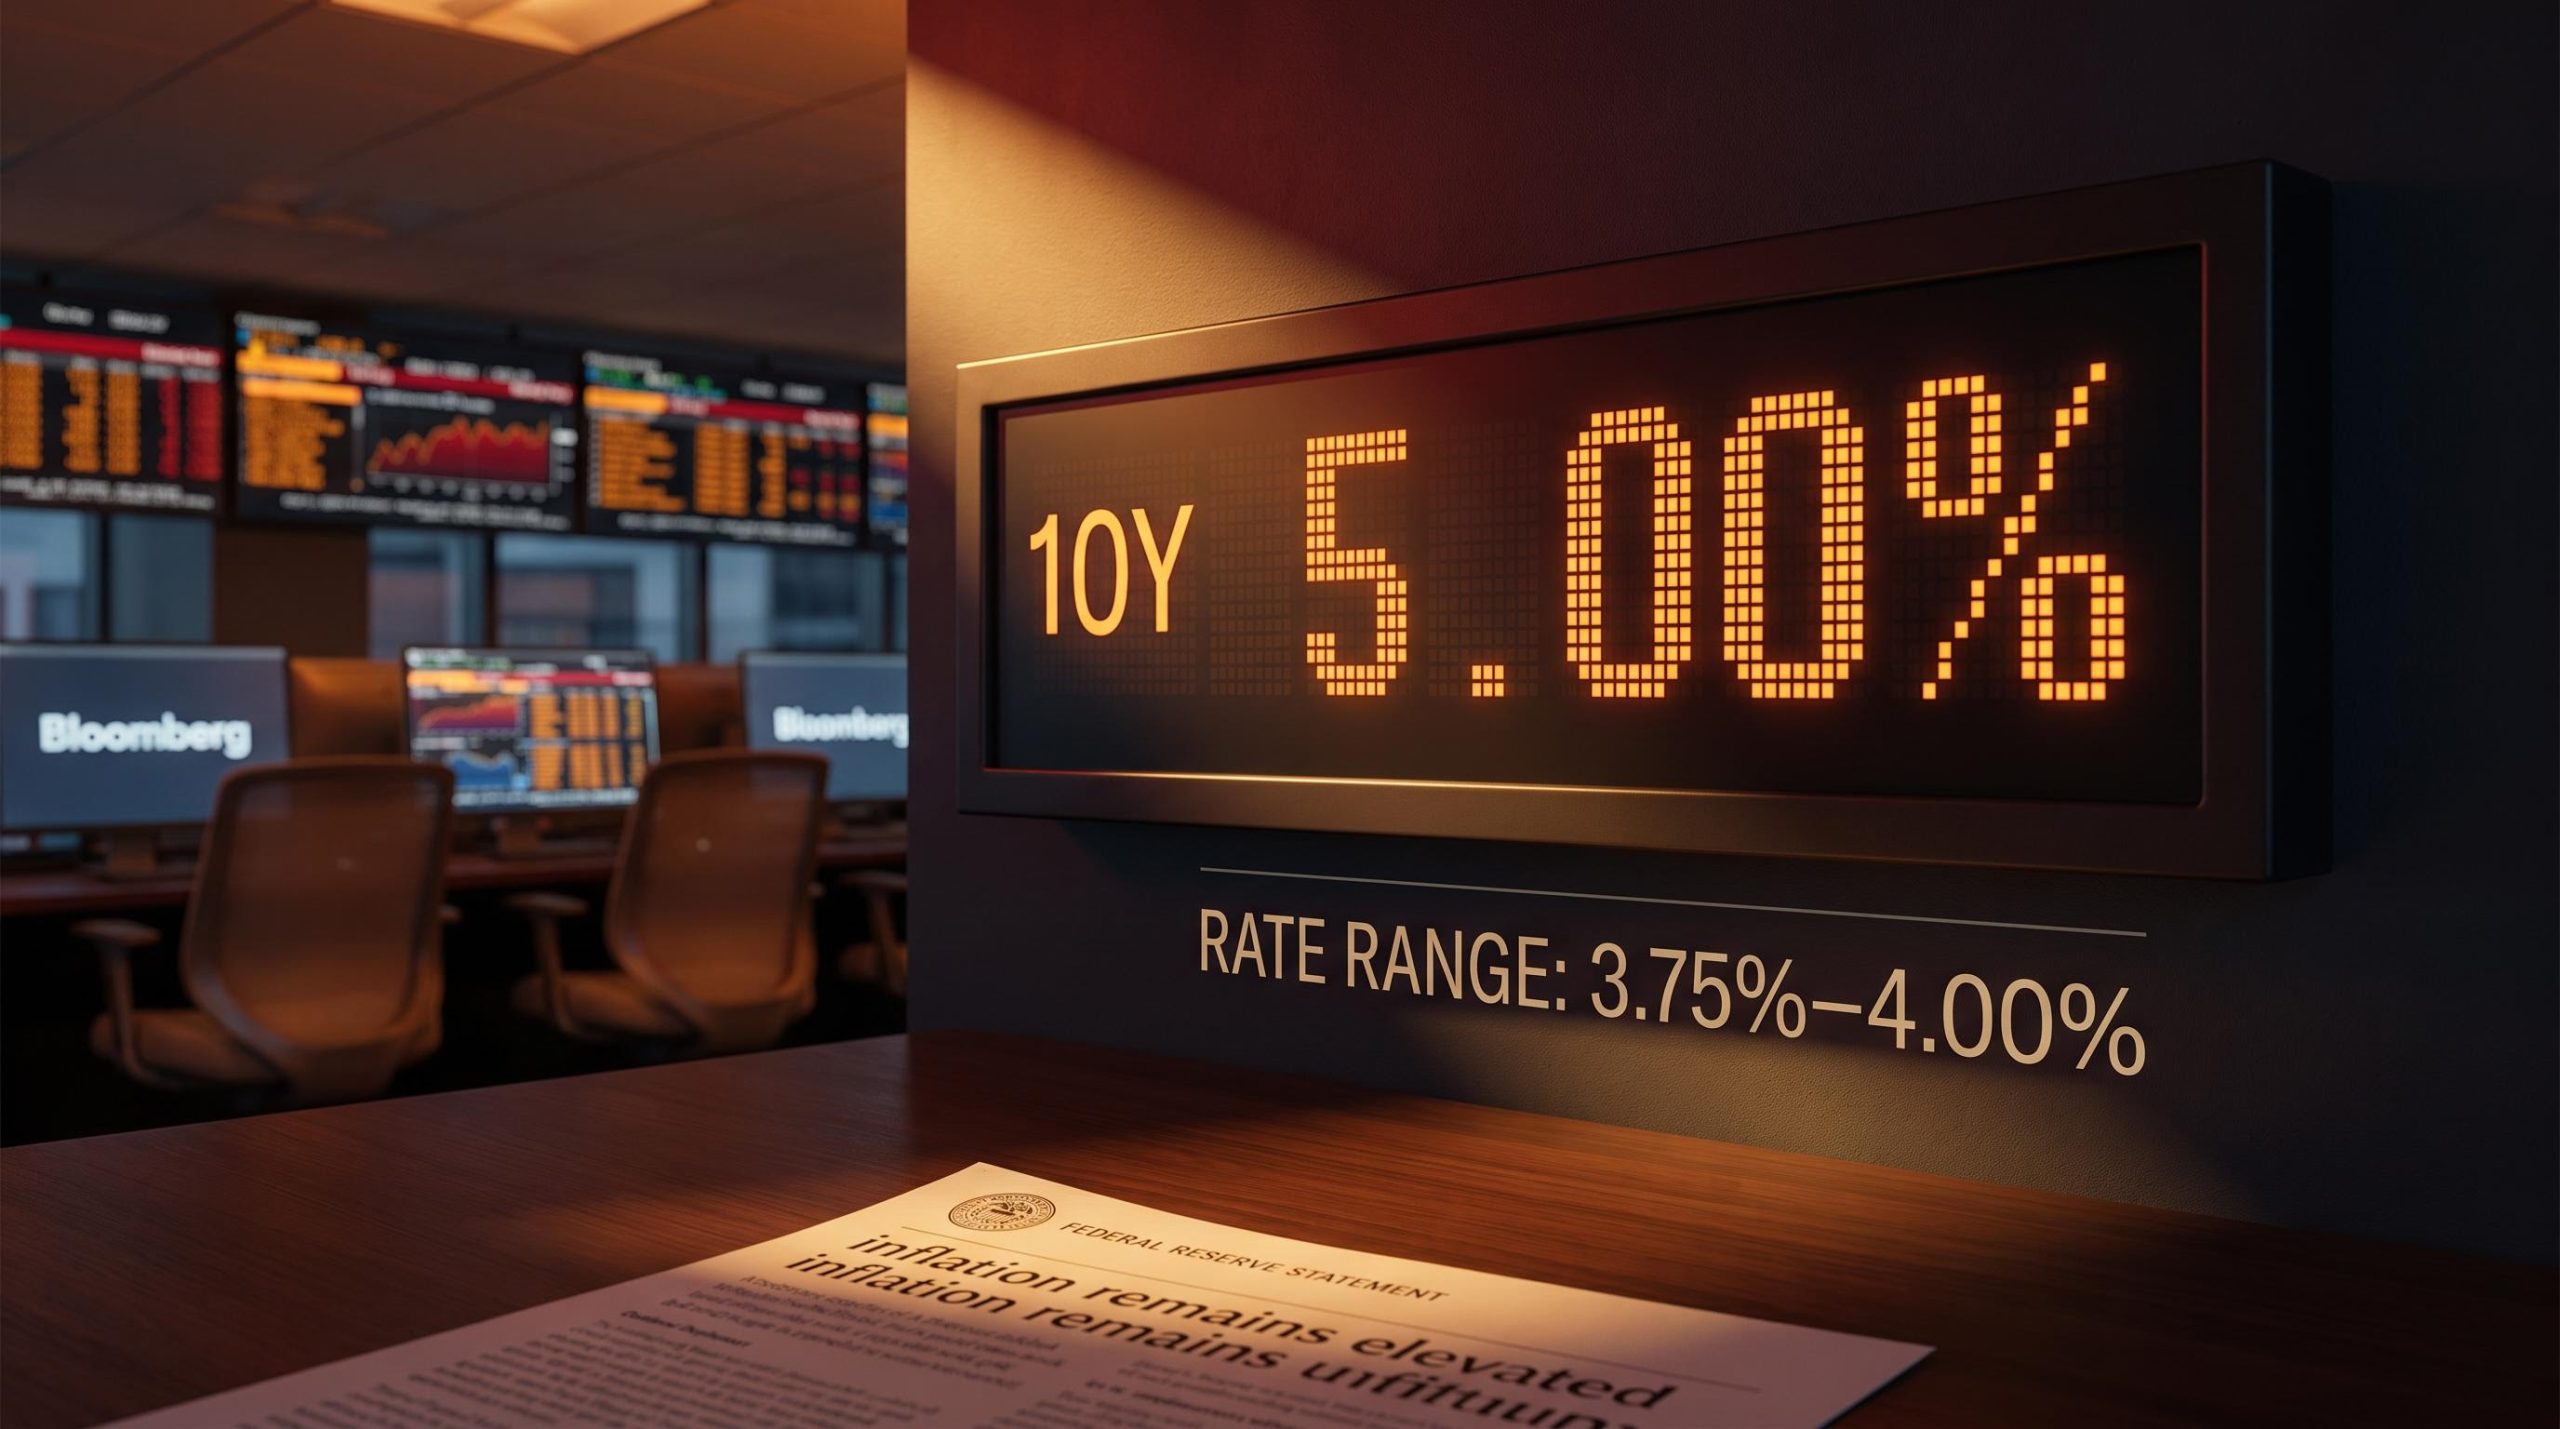
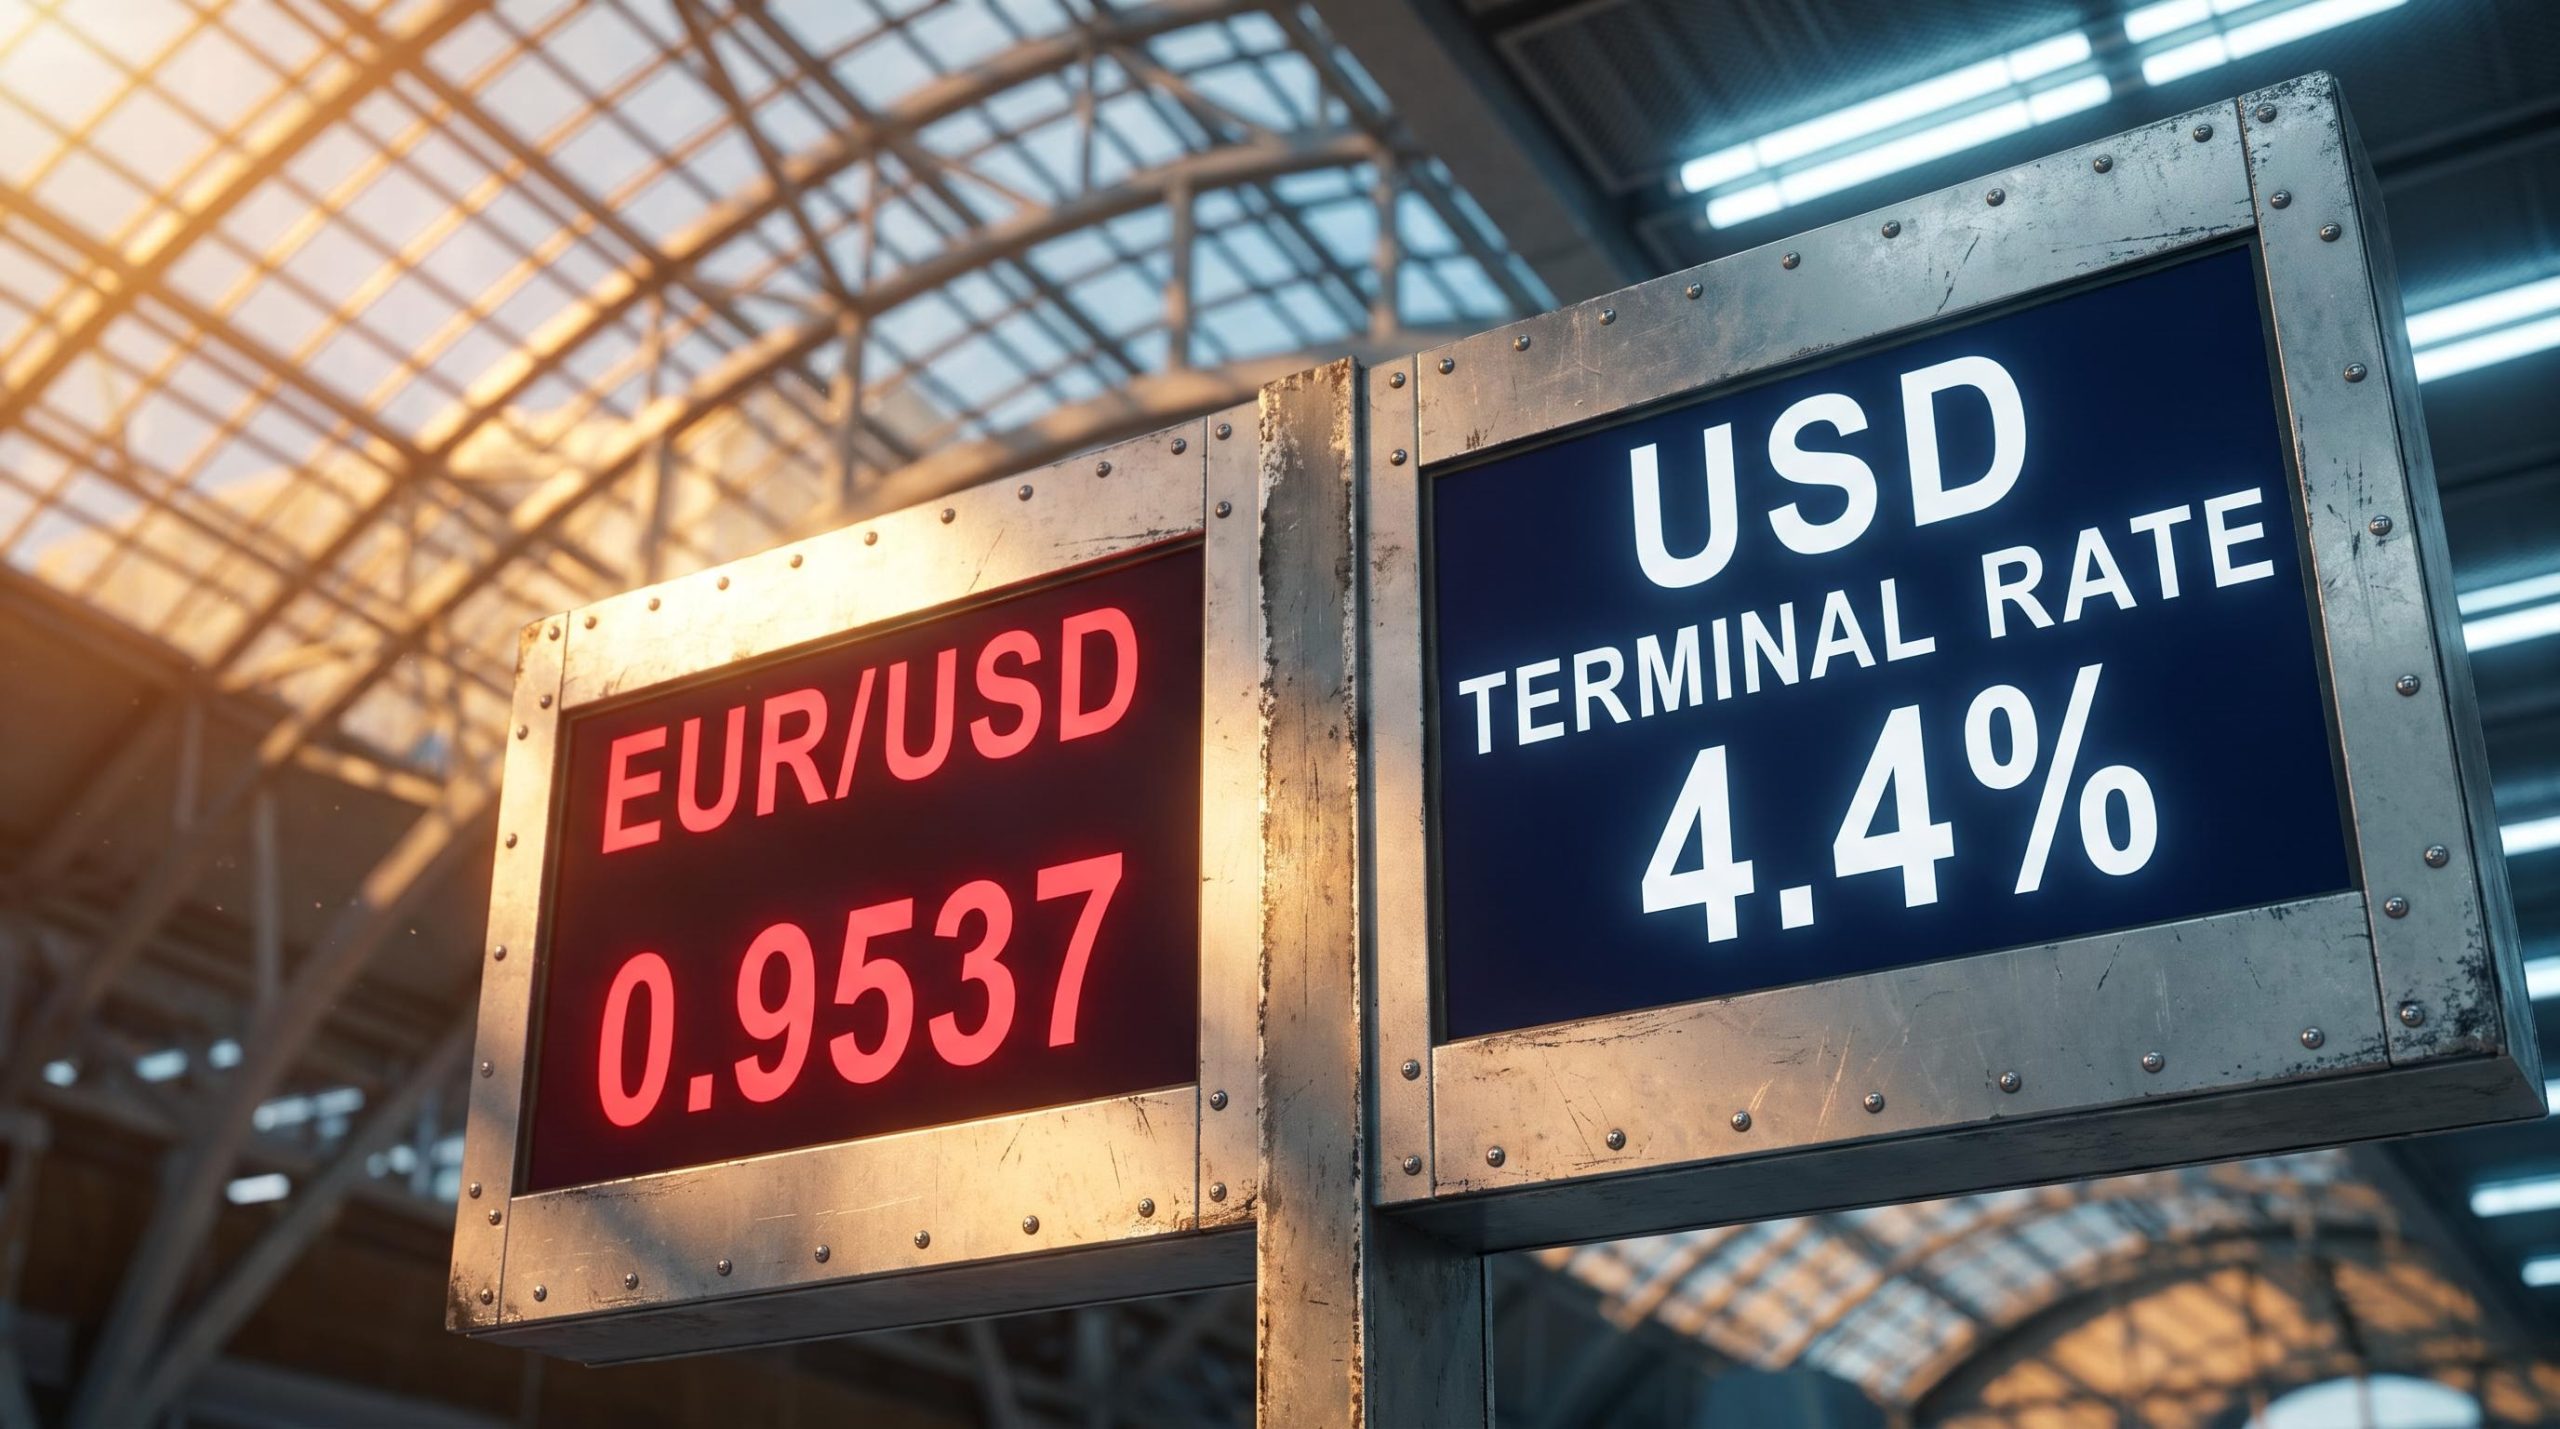
The RBA cash rate stands at 4.35% (effective 12 August 2026), with market pricing implying up to 60 basis points of further tightening by year end. On the housing side, KPMG forecasts national house prices to fall 1.1% in 2026, concentrated in Sydney, Melbourne and Canberra, while Commonwealth Bank expects dwelling prices to stay flat. Westpac projects a 34% fall in new investor activity and a 20% decline in total turnover, warning of an “air pocket” in the market.
KPMG’s August 2026 residential property report attributes the cooling trajectory to affordability stress compounded by higher rates and weaker investor sentiment, factors that flow directly into reduced consumer spending capacity and, in turn, into the forward earnings of consumer-facing ASX constituents.
The RBA’s August 2026 Statement on Monetary Policy confirms the cash rate held at 4.35% while flagging that inflation is not expected to return to target until early 2028, a timeline that leaves the tightening bias firmly in place and directly narrows the earnings cushion for rate-sensitive sectors.
Falling house prices tend to depress consumer spending, and that flows straight through to corporate earnings in consumer-facing and property-linked sectors. The strategic split looks like this:
- Higher-risk exposures: domestic consumption, housing-linked names, and highly valued consumer discretionary stocks facing the combined weight of rate and property pressure.
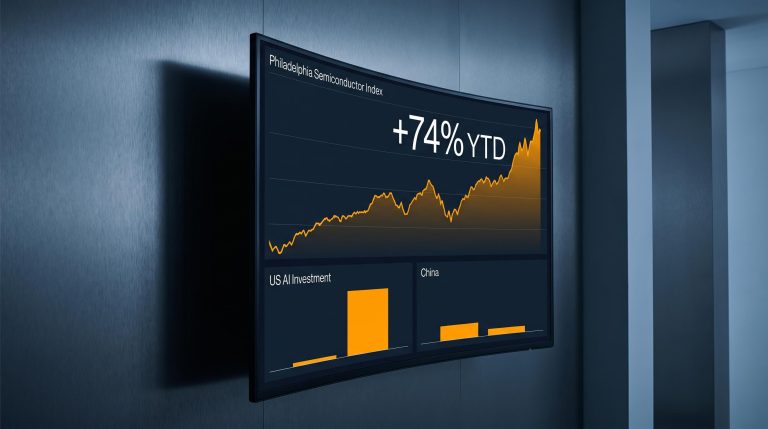
- More defensible tilts: commodities, quality franchises with durable earnings, diversified defensives, and structural themes including AI-adjacent positions.
The credentialed framing: Macquarie Asset Management describes the backdrop as “broadly supportive” for equities, but only for portfolios that tilt toward quality and structural themes. That conditional is the whole strategy.
The rate trajectory reinforces the caution. A Reuters poll recorded 30 of 33 economists expecting a hike, with more than a third anticipating the cash rate reaching at least 4.60%. For consumer and property-linked earnings, that is a direct headwind, not a background risk.
So the practical question becomes whether your portfolio is concentrated in exactly the parts of the ASX most exposed to the downturn the data is already signalling. Three checks let you audit it:
- What proportion of your ASX exposure sits in housing or consumer-linked sectors?
- What is your implied equity-risk premium at your weighted average purchase price?
- Do your sector weightings match the structural themes the evidence identifies as more defensible?
This article is for informational purposes only and should not be considered financial advice. Investors should conduct their own research and consult with financial professionals before making investment decisions. Past performance does not guarantee future results, and financial projections are subject to market conditions and various risk factors.
Where the data leaves Australian equity investors in September 2026
Pull the threads together and the picture resolves. Australian equities are not obviously overvalued on every metric, but the combination of a compressed equity-risk premium near 80 basis points, multiple expansion outpacing earnings, and a macro backdrop still tilted toward tightening creates a risk profile that passive index exposure does not adequately price.
The index level tells one story. As of 17 September 2026 the ASX 200 sits around 8,696, off its 2026 record of 9,271.6, with a forward P/E of 17.5x-17.8x against a long-term average near 15x. The earnings revision trail, with FY26 growth cut to 9.3%, tells another.
Three variables will decide which story wins out. Watch them as a brief, not a forecast:
- The RBA decision on 29 September 2026 and the guidance that follows, against market pricing of roughly 60 basis points of further tightening by year end.
- The trajectory of FY27 earnings revisions through the next reporting season.
- Q4 2026 housing and consumer data as a leading indicator of consumer spending.
The market can be near record highs and structurally exposed at the same time. Your job now is to make sure your portfolio posture reflects the earnings-level story, not just the index-level one.
These statements are speculative and subject to change based on market developments and company performance.