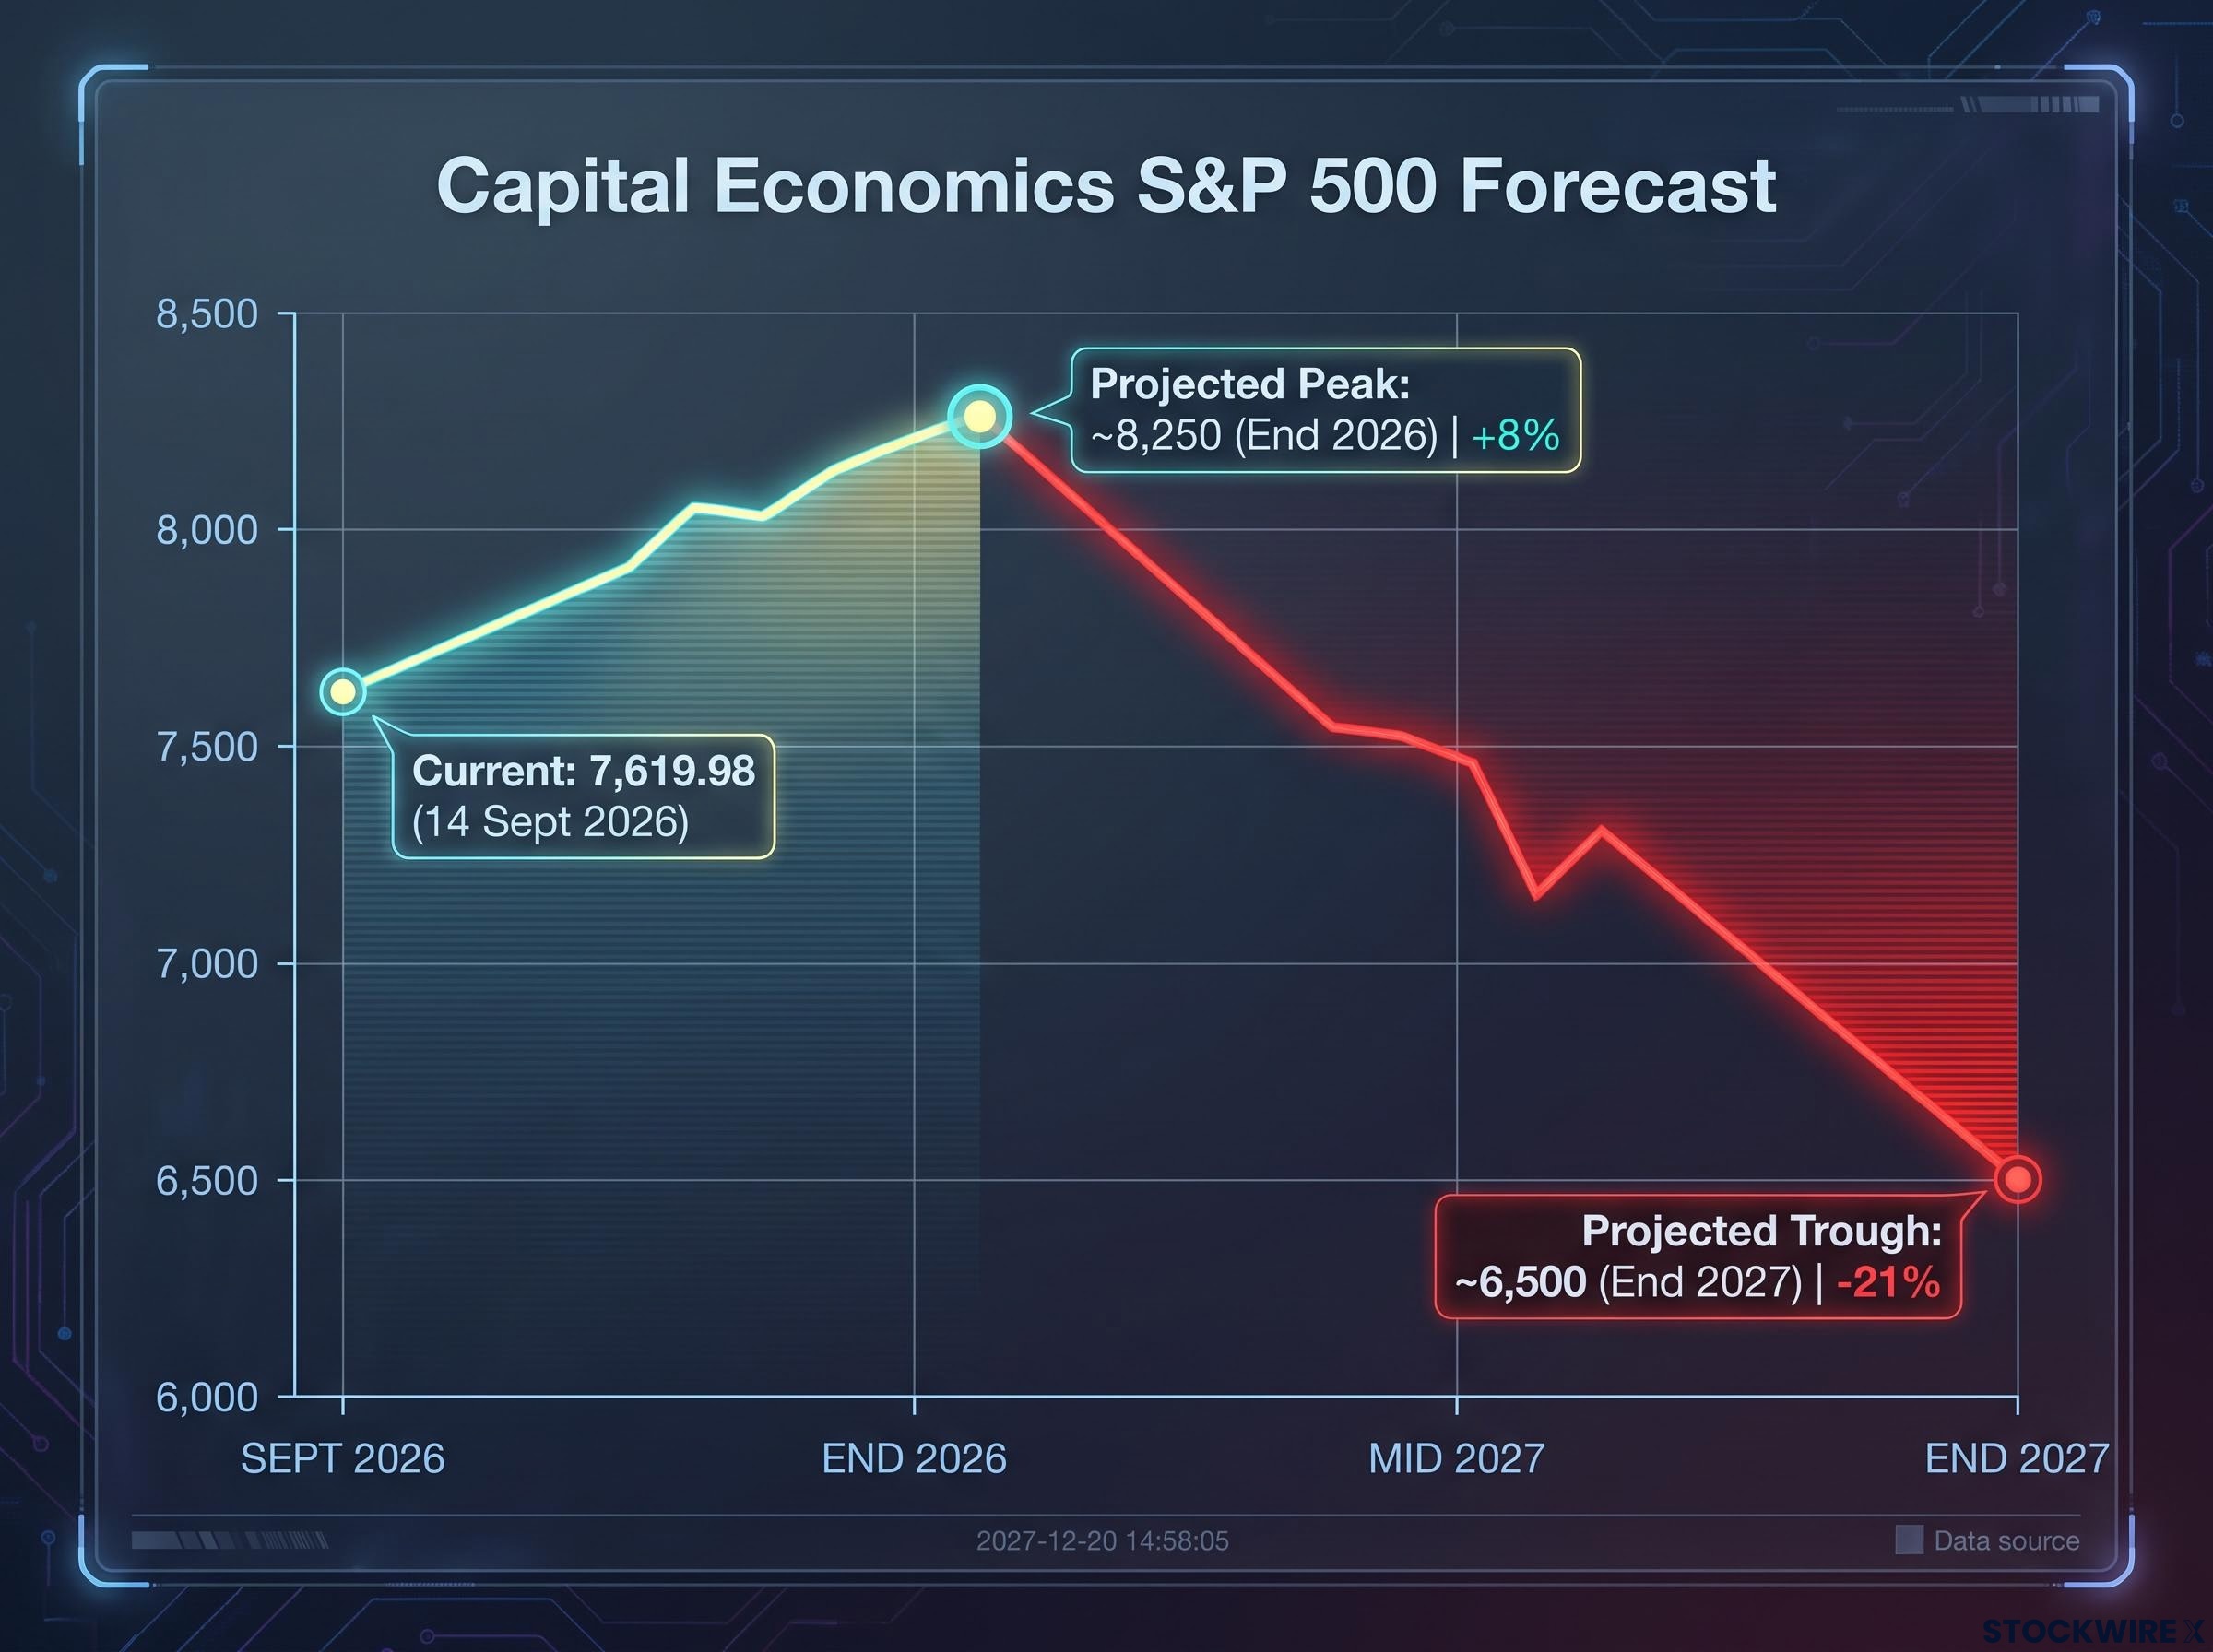
The S&P 500 is sitting near 7,620 today, and Capital Economics is projecting it will peak around 8,250 by year-end before falling to roughly 6,500 by the end of 2027. That is not a dip. It is a drawdown of a magnitude that has occurred only seven times in the past century.
The firm’s chief economic adviser, John Higgins, has published a cross-asset forecast arguing that AI investment sits in a late-stage bubble. His central evidence: the Shiller cyclically adjusted price-to-earnings ratio (CAPE) has climbed more than 12 points since early 2023 to above 40, a level last seen before the dot-com collapse. This is not framed as a tail risk. It is a base case, and its implications reach well beyond stocks into corporate credit, Treasury bonds, and the dollar itself.
Here is what the full forecast means across your portfolio, not just your equity sleeve. This piece works through the numbers, weighs them against the dot-com precedent where the parallels hold and where they fall apart, examines why the usual hedges may not cushion the fall, and closes with what the cross-asset picture actually tells a U.S. investor assessing risk right now.
What Capital Economics is actually forecasting, and how severe the numbers are
Start with where the market sits. The S&P 500 closed at 7,619.98 on 14 September 2026. That is the launch point for a forecast that moves in three distinct stages, and the shape of it matters more than any single figure.
Stage one is the climb that has not finished yet. Capital Economics projects the index pushes higher into a peak near 8,250 by the end of 2026. In other words, there is still upside baked into the call before the trouble starts.
Stage two is the fall. From that projected peak, the firm sees the index dropping back to approximately 6,500 by the end of 2027, a decline of roughly 21% from top to bottom.
Then comes the figure that reframes everything. Higgins anticipates the total peak-to-trough drawdown could reach a minimum of 30%, not the 21% implied by the peak and trough projections alone.
The difference between those two numbers is where your read on current risk lives. A 21% fall from a peak the index has not reached yet is a forecast about the future. A 30%-plus peak-to-trough drawdown suggests a meaningful slice of the damage could be measured from levels the market touches on the way up, which means the distance from today’s price to the eventual floor is narrower than the headline 30% might imply.
| Stage | S&P 500 Level | Approximate Date | Move (%) |
|---|---|---|---|
| Current baseline | 7,619.98 | 14 September 2026 | – |
| Projected peak | ~8,250 | End 2026 | +8% from today |
| Projected trough | ~6,500 | End 2027 | -21% from peak |
A peak-to-trough fall of 30% or more has happened only seven times in the past century. This is not a routine correction on the firm’s own framing.
What is driving the bubble: valuation expansion, not earnings
The reason Capital Economics treats this as a bubble rather than an expensive bull market comes down to what is powering the rally. Roughly two-thirds of the S&P 500’s gains since early 2023 have come from CAPE expansion, meaning investors paying more for the same dollar of earnings, rather than from earnings actually growing.
That distinction is the whole argument. Durable bull markets are usually built on rising profits. A rally built mainly on a rising multiple is a rally built on sentiment, and sentiment is the first thing to reverse. With the Shiller CAPE above 40 for the first time since the dot-com peak, the firm’s view is that the willingness to pay has stretched far ahead of the earnings underneath it.
Shiller’s CAPE dataset, maintained continuously at Yale University, shows that readings above 40 have historically clustered around two periods: the late-1990s dot-com peak and the post-pandemic expansion, giving the current valuation level a very short list of precedents.
When big ASX news breaks, our subscribers know first
How this compares to the dot-com collapse, and where the analogy breaks
The similarities to 2000 are genuinely uncomfortable, and they deserve to land before any reassurance does.
On valuation, the gap is small. The Shiller CAPE currently sits at 40-41, close to the dot-com peak of approximately 44. On concentration, the picture is arguably worse: the Magnificent Seven mega-caps now command 33-34% of the S&P 500’s total market value, exceeding the top-seven concentration recorded at the 2000 peak. And in private markets, AI startups routinely command revenue multiples of 25-100x, an echo of the speculative fever of the late 1990s.
The index concentration risk created by the Magnificent Seven reaching 33-34% of the S&P 500 is structurally distinct from the valuation argument: Cisco investors were right that the internet would reshape civilisation and still lost 80-90% of their capital for more than two decades, a precedent that applies regardless of whether today’s AI leaders are fundamentally superior businesses.
Stack those three facts together and the alarm is understandable. By two of the metrics that defined the last great tech unwind, today looks comparable or more extreme.
Then the analogy starts to break, and it breaks on the one thing that matters most: profitability.
At the 2000 peak, core technology companies traded at forward price-to-earnings ratios of roughly 50-150x, and many carried no durable earnings at all. Today’s AI leaders mostly trade in the 17-30x range, generate immense cash flows, and sell to real enterprise and government customers. That is a structural difference, not a cosmetic one.
- Profitability of the leaders: the 2000 names were often loss-making speculators; today’s are cash-rich incumbents with proven business models.
- Quality of the capex funding: although inflation-adjusted U.S. tech investment in 2025 reached nearly double the late-1990s peak, much of today’s spending is funded by profitable incumbents rather than fragile, debt-laden companies.
- Speed of revenue realisation: AI is monetising faster because it runs on mature cloud networks, unlike dot-com firms that spent years struggling to turn traffic into revenue.
| Metric | Dot-Com Peak (2000) | AI Cycle (2026) |
|---|---|---|
| Shiller CAPE | ~44 | 40-41 |
| Top index concentration | Top seven at 2000 peak | 33-34% (Magnificent Seven) |
| Forward P/E of cycle leaders | 50-150x | 17-30x |
| Profitability of leaders | Often loss-making | Cash-generative incumbents |
| Projected credit aftermath | Severe defaults | Less severe (Capital Economics) |
This is where the reframing gets useful. Goldman Sachs strategist David Kostin argues that public AI leaders have seen share-price gains largely matched by earnings, and that the real speculative bubble sits in private markets, where startup valuations have run ahead of anything sustainable. If he is right, the most dangerous excess may not be in the listed names most retail investors actually own.
The profitability gap is the reason a severe equity correction does not automatically become the economic wreckage of 2001 to 2003. Capital Economics itself projects that corporate credit losses from an AI bust would be less severe than the defaults that followed the dot-com crash. If you assume the old playbook applies wholesale, you risk misreading both the danger and the eventual recovery.
Why bonds and the dollar may not cushion the fall this time
A 30% equity drawdown usually sends money running toward safety. The uncomfortable part of this forecast is that the assets investors normally run to may not behave the way they used to.
Start with Treasuries. Capital Economics anticipates only a modest decline in developed-market 10-year sovereign bond yields by the end of 2027, which means only a modest rise in bond prices. That is a world away from the powerful Treasury rally that followed the roughly 47% dot-com drawdown. The firm’s reasoning is that there is far less room for term premia to compress from here.
The bigger structural shift is in the hedge itself. State Street Global Advisors and analyst Lyn Alden note that since 2022, long-duration Treasuries have lost much of their power to offset equity losses. The equity beta of Treasuries has drifted toward zero, and during some equity drawdowns long bonds have actually delivered negative average returns as fiscal pressure and forced selling took hold.
Then there is the dollar, which historically firms up in a crisis. Capital Economics assesses the U.S. dollar as more overvalued today than it was at the dot-com peak, and both Goldman Sachs and UBS point to fiscal strain and a steepening yield curve as forces likely to push it lower. A weakening dollar during an equity selloff removes yet another traditional cushion.
Here is the practical shape of the problem for a U.S. investor:
- Treasuries: expected to rally only modestly, not the sharp move that historically offset stock losses.
- The dollar: assessed as overvalued and more likely to fall than provide safe-haven support.
- Corporate credit: spreads compressed to levels that leave almost no room for error.
For a standard 60/40 portfolio, or one heavily weighted toward dollar-denominated assets, that combination points to a cross-asset drawdown with fewer natural offsets than history would lead you to expect. The pieces that are meant to zig when equities zag may not zig at all.
Credit spreads near multi-decade lows, and what that means for bondholders
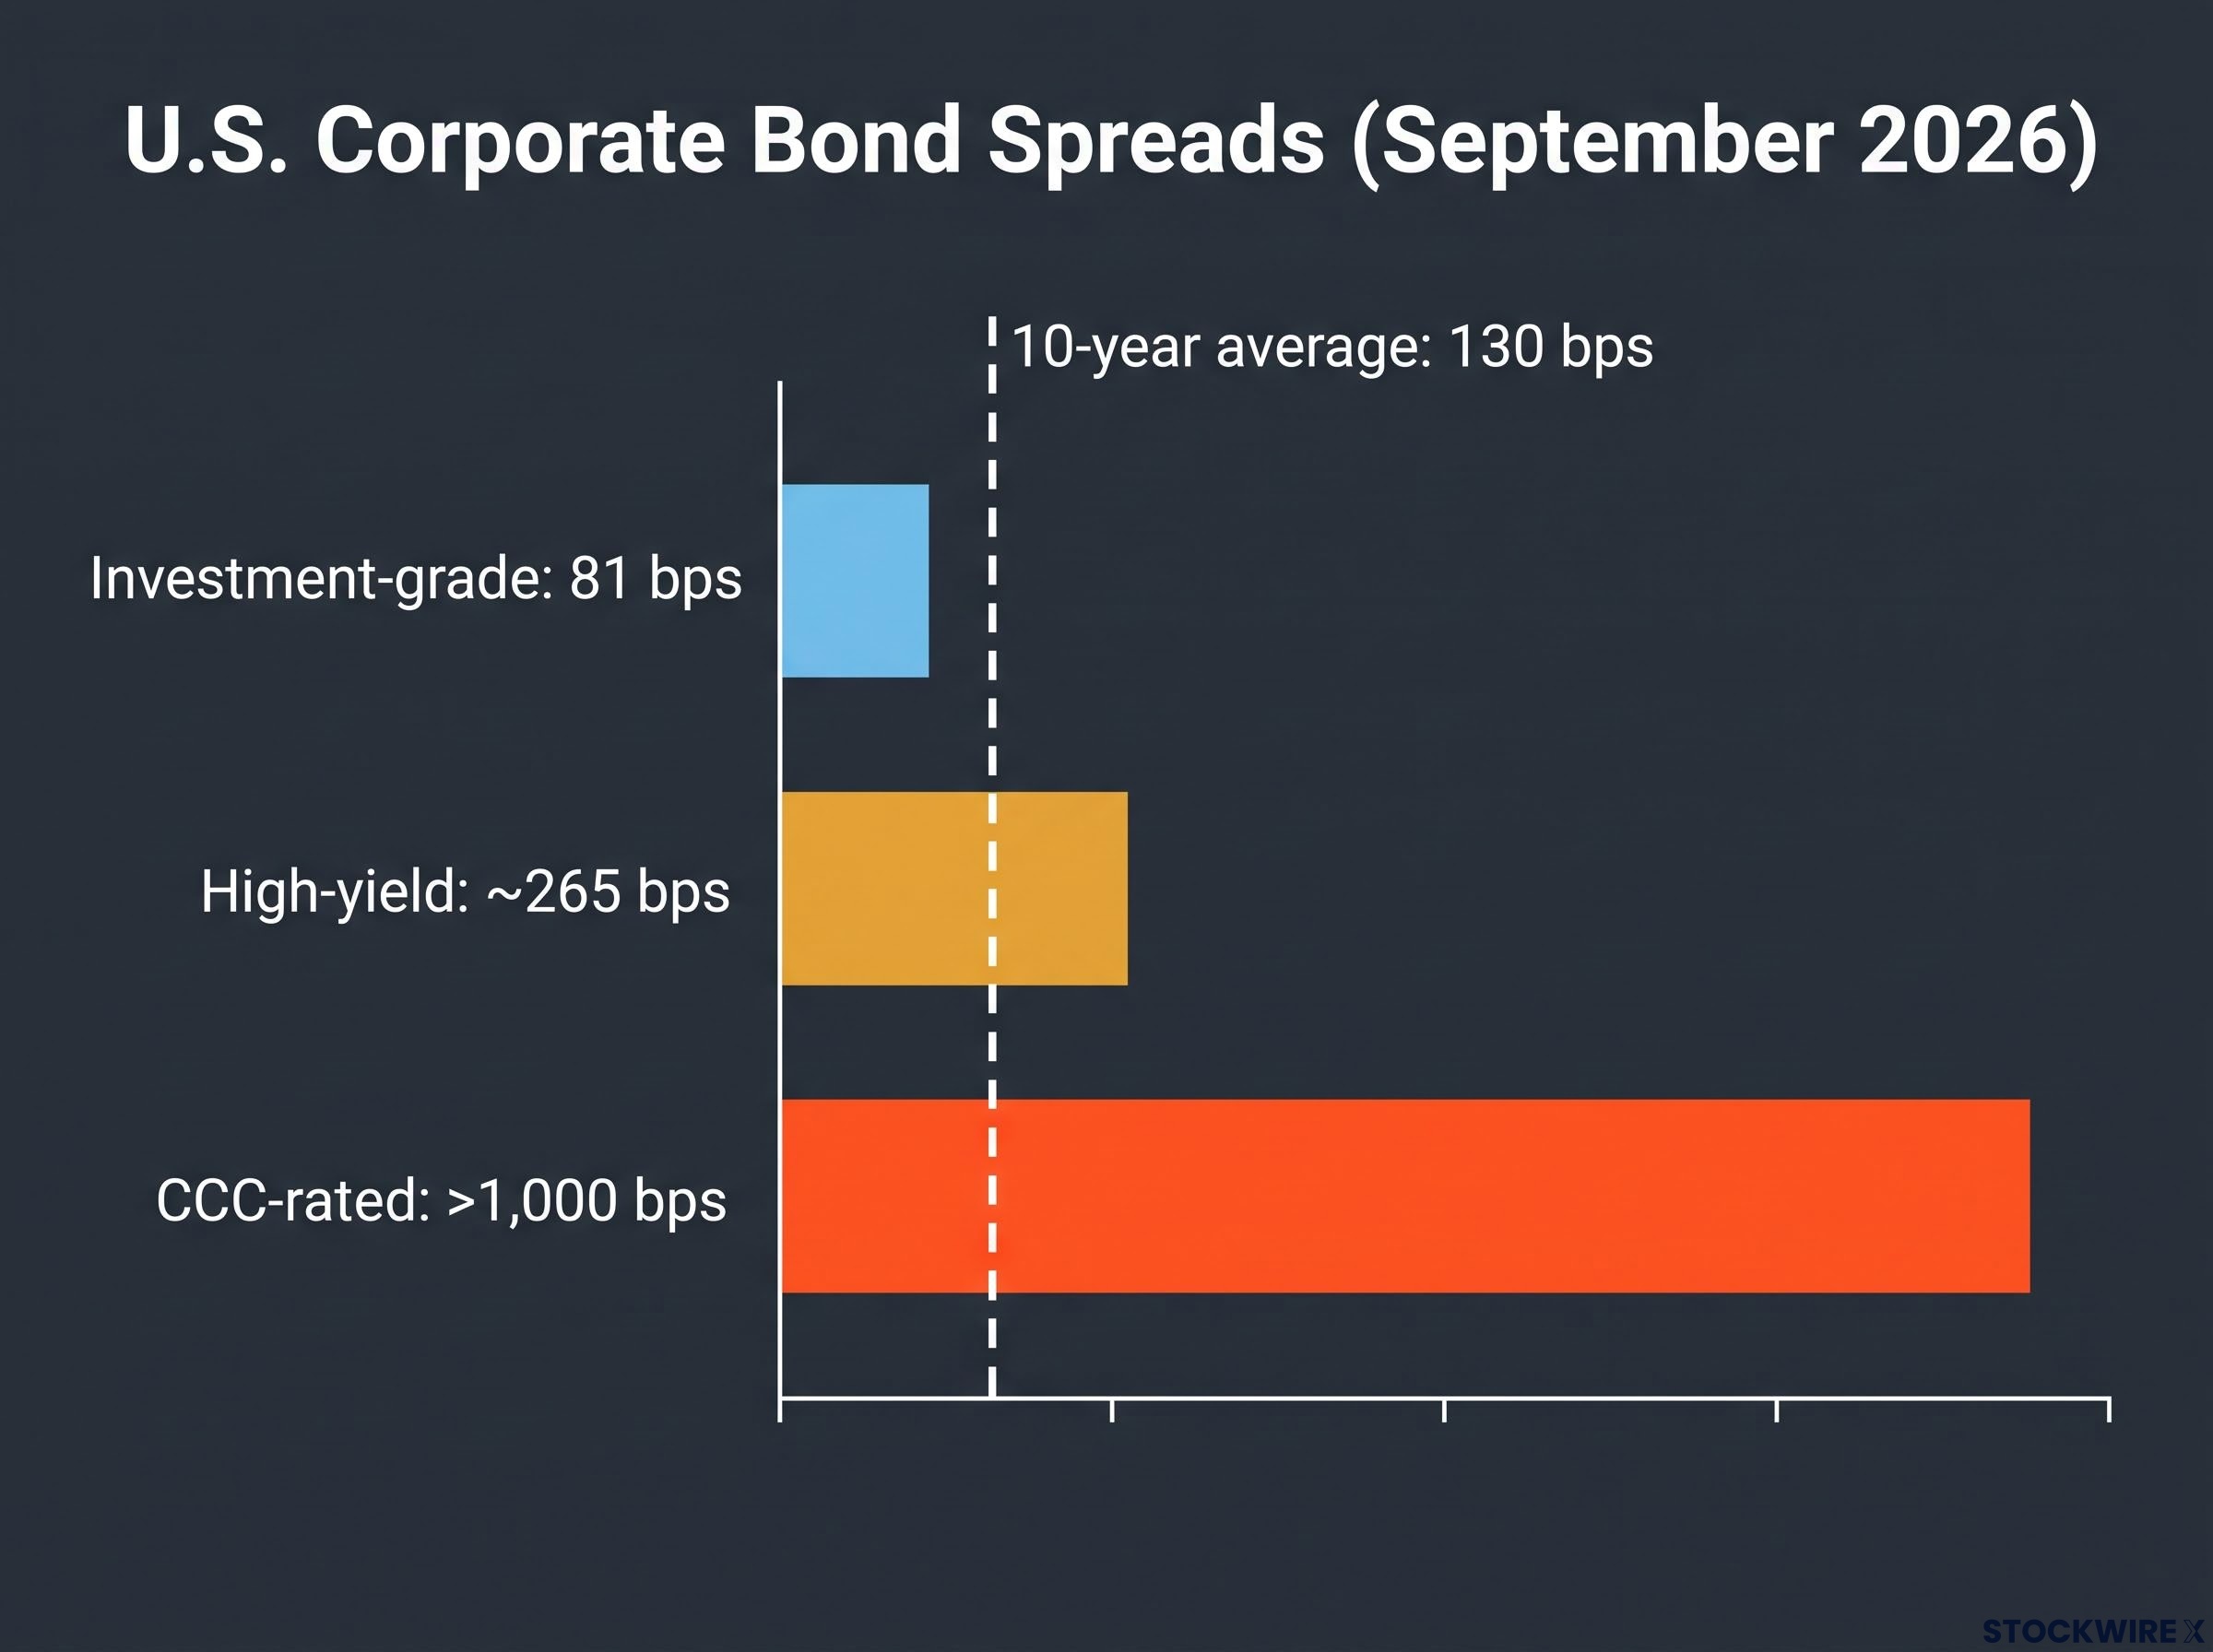
Corporate bond spreads are the clearest illustration of how little cushion exists. As of September 2026, U.S. investment-grade corporate option-adjusted spreads sit at about 81 basis points, well inside the 10-year average of roughly 130 bps. High-yield spreads have tightened to around 265 bps.
Investment-grade spreads of 81 bps against a 10-year average near 130 bps: that is the cushion that is not there.
AI bond market issuance is distorting the investment-grade spread signal the article relies on: Goldman Sachs estimates close to $500 billion in AI-related debt issuance in 2026 alone, and hyperscaler bonds now represent approximately 15% of the U.S. investment-grade market, meaning the 81-basis-point aggregate spread partly reflects supply pressure from highly rated names rather than a clean read on systemic credit health.
A spread is the extra yield a corporate bond pays above a Treasury of similar maturity to compensate for default risk. When spreads are this tight, you are being paid almost nothing extra for taking on that credit risk, which means any repricing event hits harder because there is no buffer to absorb it.
The headline high-yield number also flatters the underlying picture. Beneath it, CCC-rated spreads already exceed 1,000 bps, according to Lighthouse Canton and AllianzGI, signalling that stress is already visible in the lowest-quality tier even while the top of the market looks calm.
What the institutional consensus says about positioning now
The risk picture is heavy. The useful question is what to do with it, and here a cluster of major institutions has converged on a single idea.
The rotation thesis is the clearest articulation. Citi, Morgan Stanley, and Jefferies each advocate shifting away from what they call “AI compute beta,” the crowded semiconductor and mega-cap tech trade, toward “cash-flow alpha,” meaning high-quality, cash-generative cyclicals and defensives across consumer goods, healthcare, financials, and industrials.
The move, in the institutions’ own framing, is from AI compute beta to cash-flow alpha: away from the crowded trade, toward companies whose cash flows do the work.
That multiple large houses are pointing the same direction is itself the signal. When the smart money starts repositioning in unison, it raises the question of how long the current crowded positions can hold before the exit gets narrow.
Rules-based rebalancing enforces a sell-high discipline on concentrated positions automatically, without requiring any market forecast, which is precisely the property that makes it useful when the bubble verdict is genuinely unresolved and acting on a binary exit call carries its own documented opportunity costs.
The recommended approach is not a binary escape from technology. It is a set of ordered levers you can weigh against your own portfolio:
- Rotate away from compute beta: trim the crowded semiconductor and mega-cap concentration in favour of cash-flow-rich cyclicals and defensives.
- Build a barbell within tech: T. Rowe Price and Morgan Stanley suggest keeping exposure to high-quality hyperscalers while pairing them with cyclical value names, rather than exiting tech entirely.
- Upgrade credit quality in fixed income: favour investment-grade and upper-tier high yield (BB/B) while strictly avoiding CCC credits, given the default risk already visible in that tier.
- Diversify currency and geography: with dollar weakness expected, Goldman Sachs advises considering currency hedges, and State Street stresses rebalancing into international equities to manage U.S. tech concentration risk.
The through-line across all four is the same instinct: reduce dependence on the crowded, dollar-heavy, compute-driven trade without abandoning quality growth altogether.
What stays true regardless of whether Capital Economics is right
The Capital Economics view is not the consensus, and honesty about that matters. Allianz and Deutsche Bank read the current environment as a fragile boom underpinned by real fundamentals, pointing to genuine revenue growth and healthier balance sheets. Amundi classifies the AI wave as a displacement phase, the moment a technology attracts attention and capital, rather than full-blown euphoria. VanEck and Goldman Sachs both stress that today’s leaders are profitable in a way the late-1990s names were not.
So the bubble debate is genuinely unresolved. Reasonable institutions are looking at the same data and reaching different conclusions.
Here is why you do not need to settle that debate to act. The structural conditions the forecast rests on are observable right now, whatever the eventual outcome:
- Shiller CAPE above 40, a valuation level last seen before the dot-com bust.
- Investment-grade spreads at 81 bps, far inside their 10-year average, offering almost no cushion.
- Magnificent Seven at 33-34% of the index, a concentration exceeding the 2000 peak.
Those three facts describe a risk environment worth adjusting for even if the eventual correction lands well short of Capital Economics’ 30% base case. The decision in front of you is not whether to believe one firm’s forecast. It is whether the risk and reward of your current positioning reflects what the valuation, concentration, and spread data are already showing.
For investors wanting to move from risk awareness to concrete action, our full explainer on professional downside protection strategies covers tail-risk sleeve construction, value investing with a margin-of-safety framework, and a three-layer portfolio structure built for exactly the elevated-CAPE, compressed-spread environment the current data describes.
This article is for informational purposes only and should not be considered financial advice. Investors should conduct their own research and consult with financial professionals before making investment decisions. Past performance does not guarantee future results. Financial projections are subject to market conditions and various risk factors, and the forward-looking statements referenced here are speculative and subject to change based on market developments.