EUR/USD is falling on the day the Federal Reserve opens its September meeting, and it is doing so even though the European Central Bank raised rates five days ago and its officials spent the weekend warning that inflation is not finished. Something is overriding the hawkish euro-zone signal entirely.
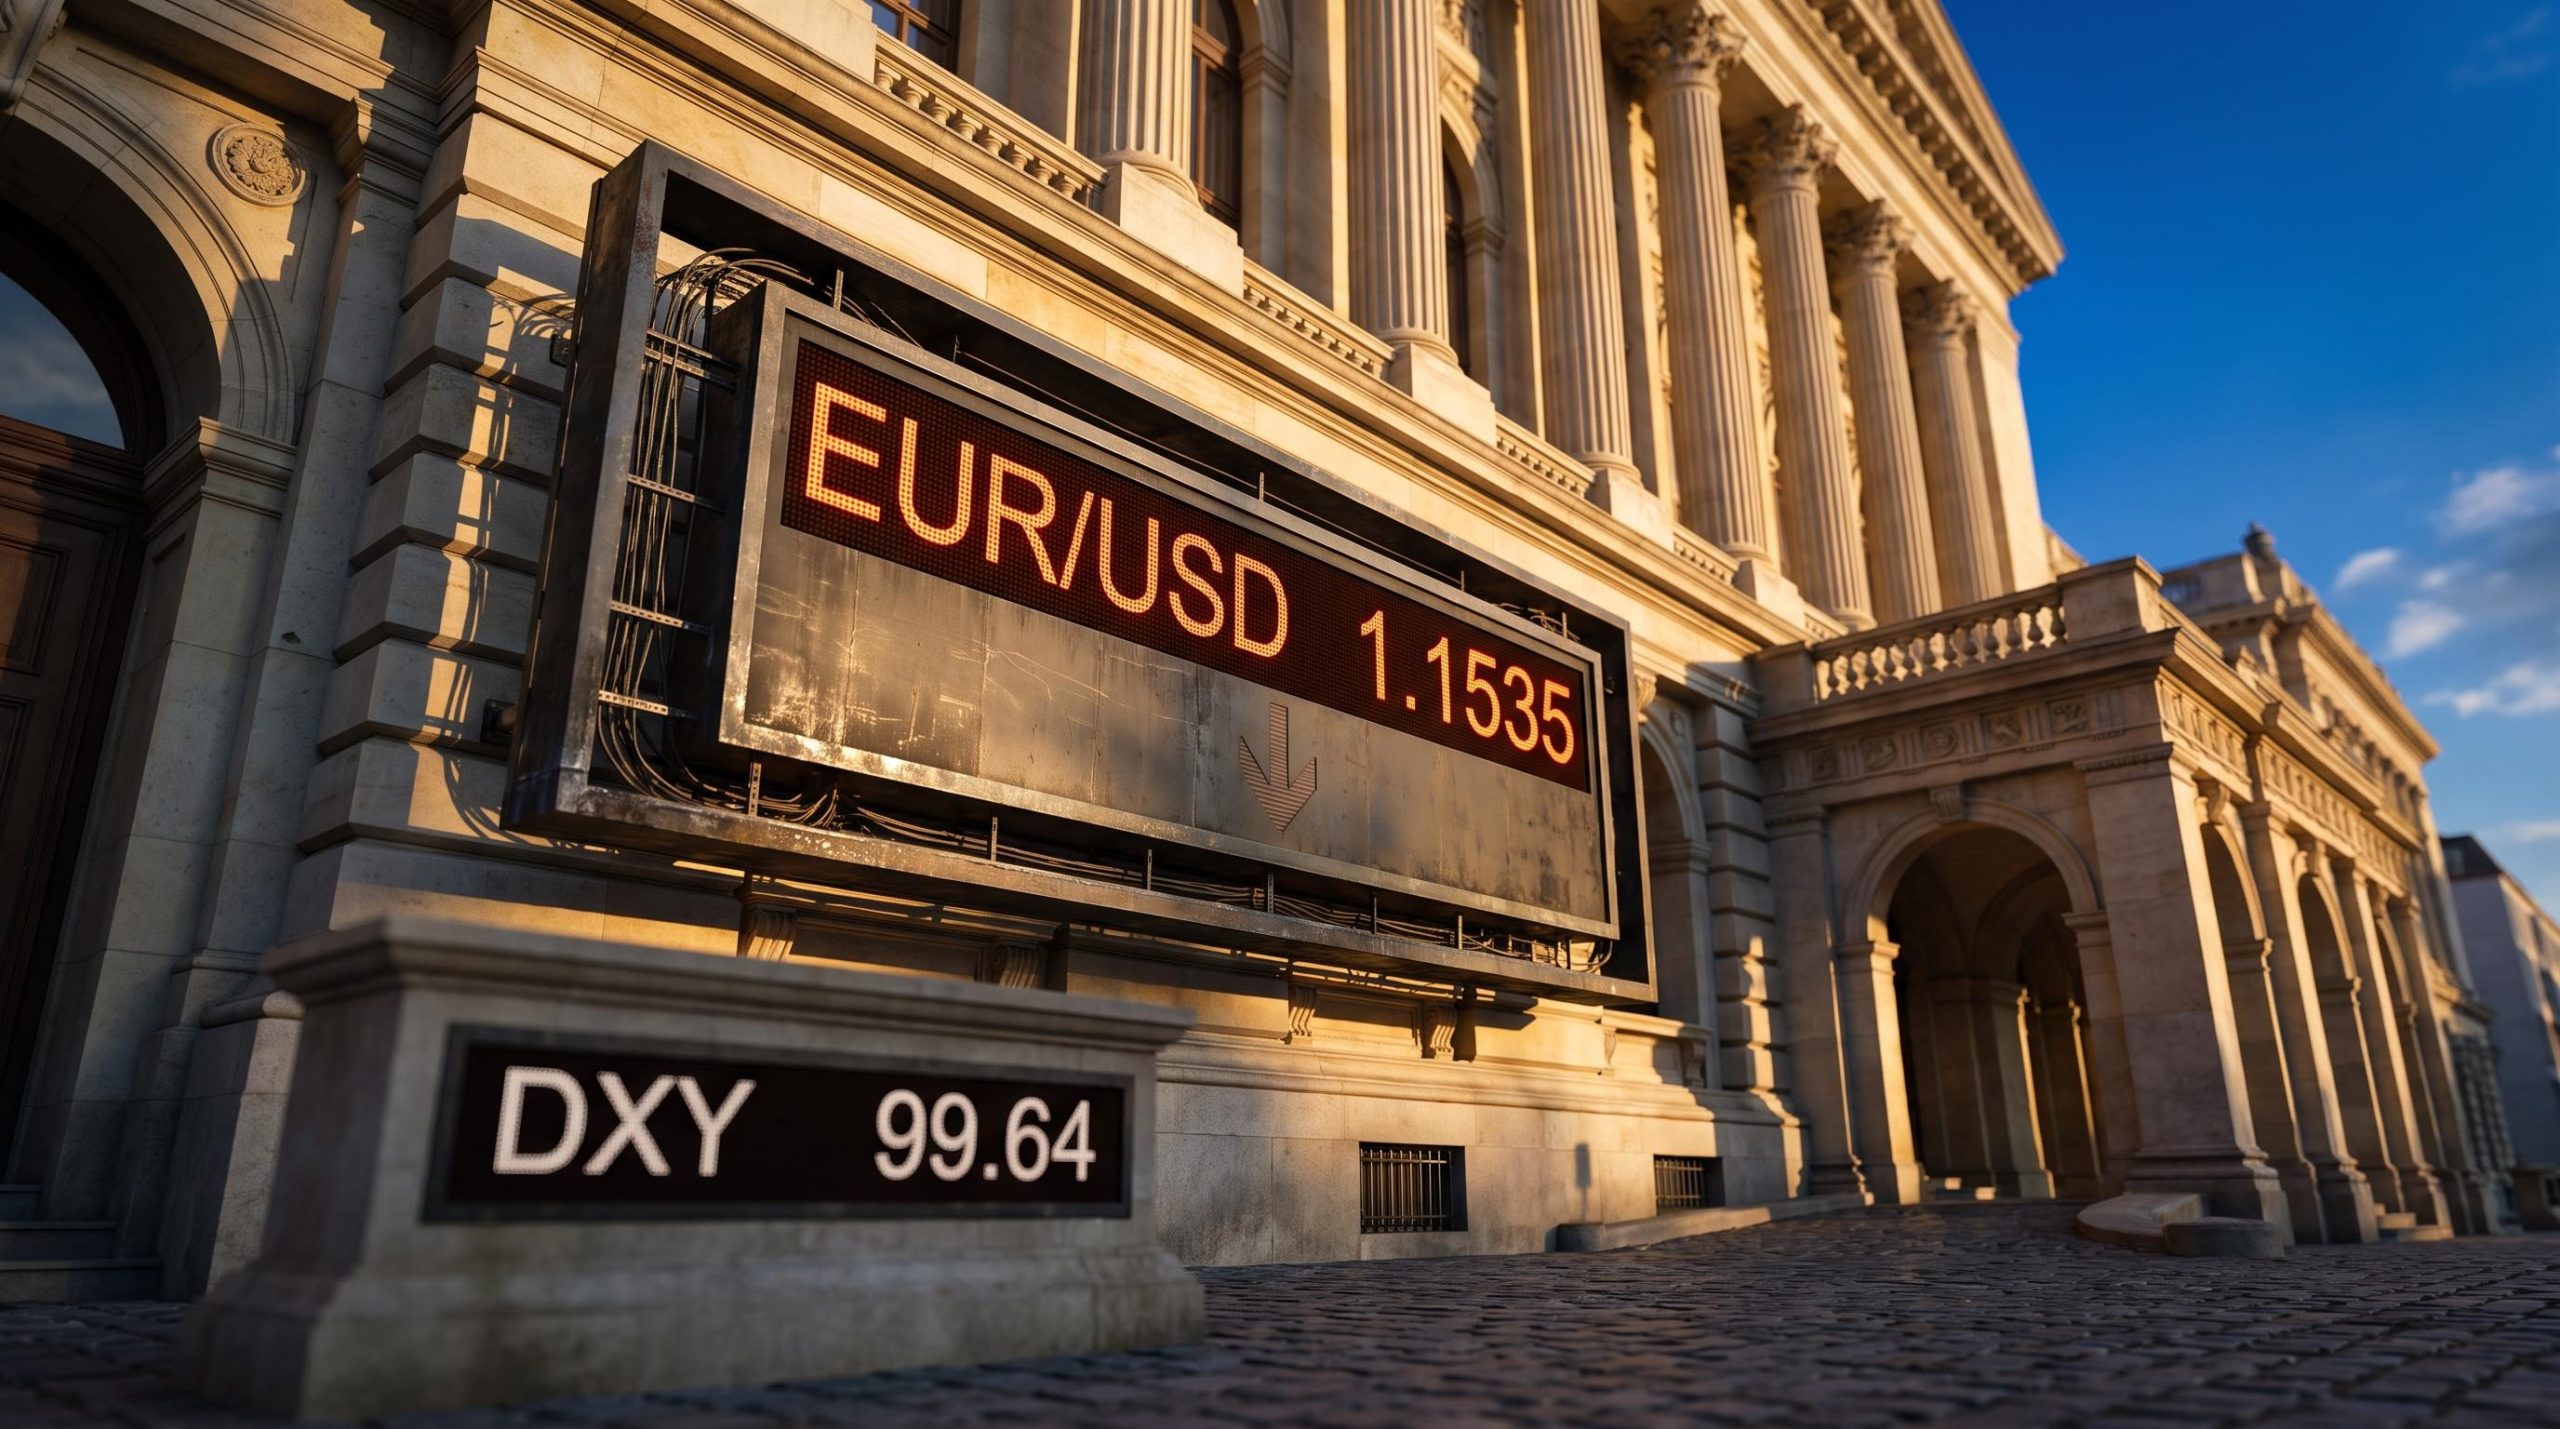
As of the early European session on 15 September 2026, EUR/USD is trading near 1.1535, down roughly 0.12% on the day, while the US Dollar Index (DXY) pushes toward 99.64. The 10-year US Treasury yield sits just below 5%, its highest since October 2023.
The ECB lifted its deposit facility rate to 2.50% on 10 September 2026, and Christine Lagarde, Isabel Schnabel, and Martins Kazaks all signalled more tightening ahead. None of it has been enough. The pair remains pinned below its 20-day exponential moving average near 1.1594 and is drifting toward the 1.1500 floor.
This is a currency analysis of a genuine paradox. Here is why the chart and the policy story are telling you the same thing, what the technical levels reveal about near-term direction, and what Wednesday’s Fed decision could do to the picture either way.
EUR/USD’s technical picture: resistance above, a psychological floor below
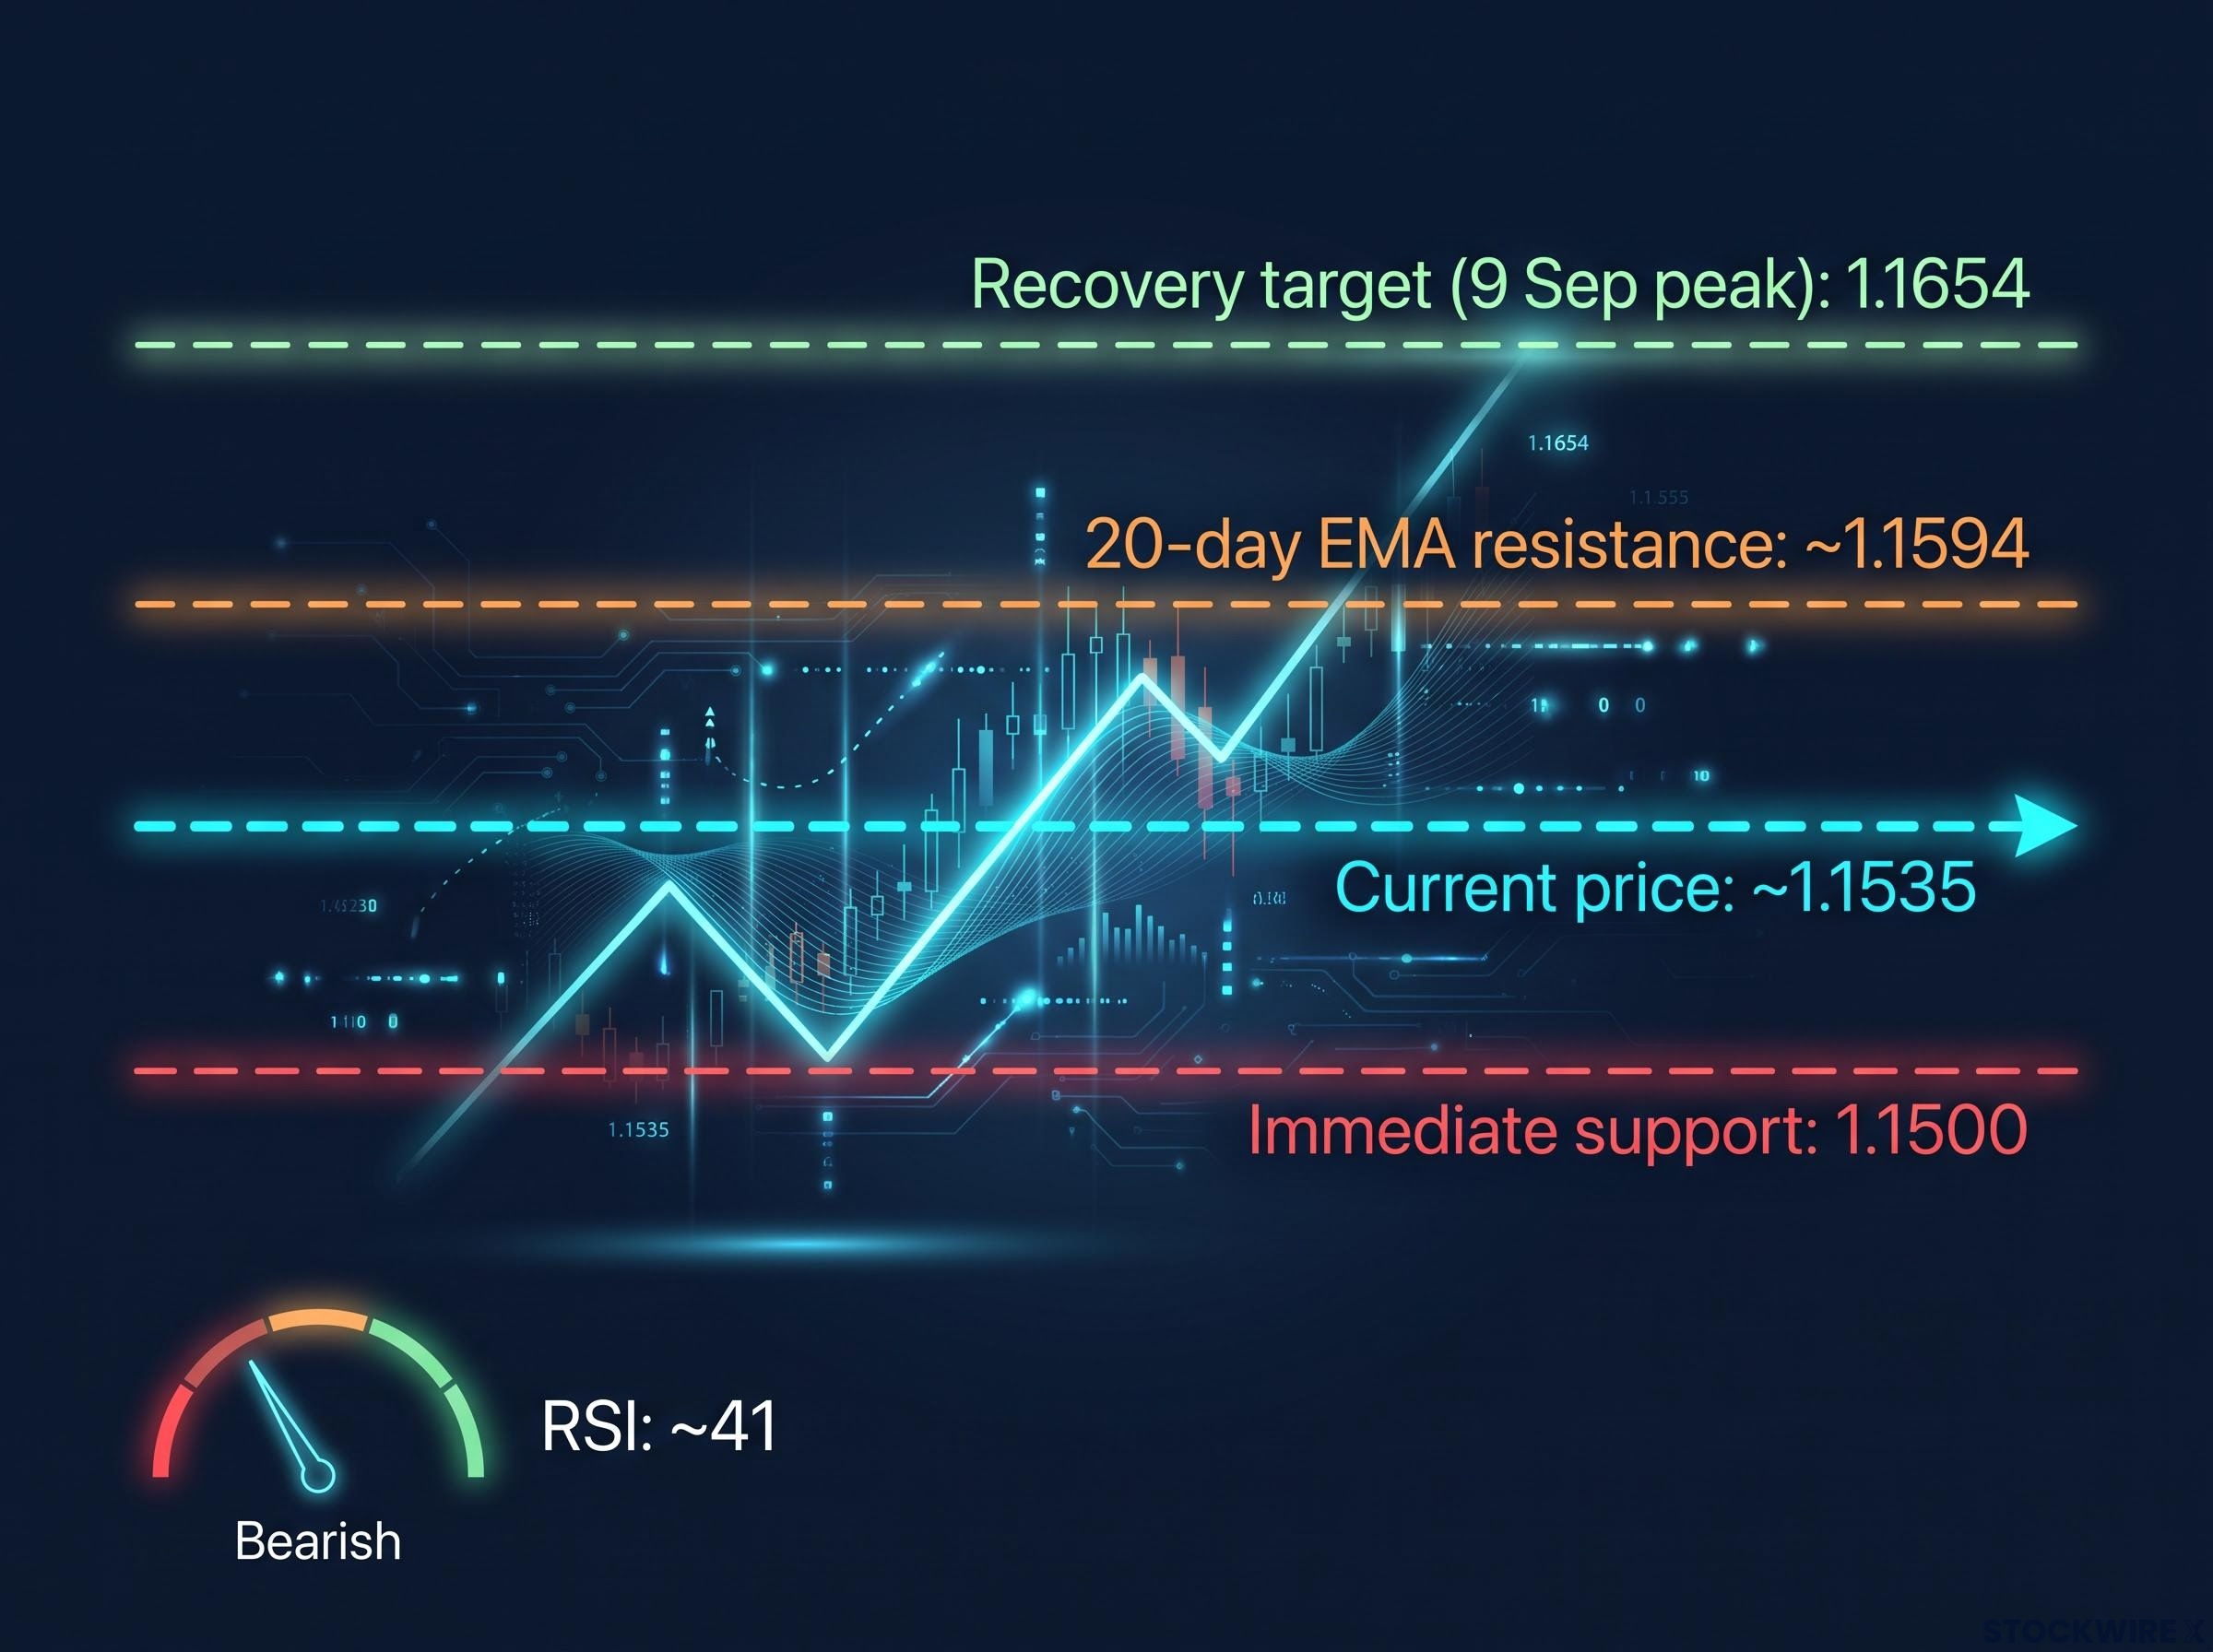
Start at the top of the chart, because that is where the pair keeps getting turned away. The 20-day exponential moving average, a trend indicator that weights recent prices more heavily, sits near 1.1594. EUR/USD has repeatedly failed to close a day above it.
That line is the divider. Above it, the recent selling looks like a pause in a recovery attempt. Below it, where the pair sits now, the structure reads as a continuation lower.
Momentum tells the same story from a different angle. The Relative Strength Index, a gauge that runs from 0 to 100 and flags when a market is stretched, registers around 41. That is soft and pointing down, but it is not below 30, the level that typically triggers mechanical buying interest.
The read for you is this: at 41, the pair is not washed out yet. A technical bounce is not imminent, and the path of least resistance stays lower until a catalyst forces a reassessment.
The floor that matters is 1.1500. It is a round number that traders defend on psychology alone, and it is also the point below which the technical picture deteriorates in a more meaningful way.
Here is the map of where the pair is trapped:
- Current price: approximately 1.1535 (down from 1.1541 on 14 September 2026)
- 20-day EMA resistance: near 1.1594
- RSI: approximately 41
- Immediate support: 1.1500
- Recovery target: the 9 September 2026 peak at 1.1654, which requires a daily close back above the EMA
The dollar is doing its part too, with the DXY advancing about 0.18% to 99.64, adding downward weight from the other side of the pair.
The macro floor Analysis from fxvexx describes EUR/USD’s slide toward the 1.1520 area after the ECB decision as exposing a “macro floor” and underlying fragility in the euro’s bid, tightening interpreted as defensive rather than a sign of strength.
| Indicator | Level | Directional signal |
|---|---|---|
| Current price | ~1.1535 | Soft, below key resistance |
| 20-day EMA | ~1.1594 | Resistance, capping rallies |
| RSI | ~41 | Weak, not yet oversold |
| Support | 1.1500 | Psychological floor |
| Resistance peak | 1.1654 | Recovery target (9 Sep) |
When big ASX news breaks, our subscribers know first
Why ECB hawkishness has not lifted the euro
If a central bank raises rates and its officials keep warning about inflation, the textbook says its currency should strengthen. The euro is not following that script, and the reasons peel back in layers.
What the ECB did on September 10
The Governing Council raised all three key rates by 25 basis points on 10 September 2026, effective 16 September 2026. That put the deposit facility rate at 2.50%, the main refinancing rate at 2.65%, and the marginal lending facility at 2.90%.
The ECB rate decision on 10 September confirmed the deposit facility rate at 2.50%, with Eurosystem staff projections placing eurozone headline inflation above the 2% target through 2027 and markets pricing close to 40 additional basis points of tightening before year-end.
The commentary that followed was pointed. Three officials made the hawkish case in the days before the Fed meeting:
- Christine Lagarde, ECB President, said the energy disruption is likely to last longer than initially expected and that price volatility will continue, while acknowledging risks to growth.
- Isabel Schnabel, Executive Board member, warned on 14 September that petroleum refining infrastructure has been substantially curtailed and cannot be quickly restored, sustaining upward pressure on prices.
- Martins Kazaks, Latvia’s central bank governor, said on 14 September that rising fuel costs risk feeding into wages and broader prices, strengthening the case for more tightening.
Schnabel on the supply side Schnabel flagged that petroleum refining infrastructure has been substantially curtailed and cannot be rapidly restored, a supply constraint that keeps energy costs, and inflation, elevated.
Yet the tightening path is not unanimous. Dutch central bank chief Olaf Sleijpen, in a Reuters interview, stopped short of endorsing an immediate further hike, saying policymakers should watch whether higher energy prices are feeding into other indicators first. Scotiabank characterised ECB rhetoric as progressively more hawkish, singling out Schnabel’s commentary as particularly notable.
Why each hawkish signal landed with diminishing force
Here is the structural answer: the market already bought it. According to LSEG and StoneX data, swaps assign roughly 90-94% odds to another quarter-point ECB hike in December. When December is nearly fully priced, each fresh hawkish comment confirms what traders already hold rather than giving them something new to buy.
That is the mechanism you need to understand. The euro would need a genuinely surprising upward shift in the expected terminal rate to generate a durable rally from here, not another statement pointing in a direction the market has already committed to.
ECB monetary policy tools move the euro largest when the outcome deviates from what OIS and Euribor curves already price; the current episode illustrates the inverse precisely, with hawkish delivery confirming rather than surprising market expectations and generating no new buying impulse.
There is a second layer. Markets are reading the ECB’s move as defensive tightening, fighting a supply-side energy shock, rather than growth-supportive tightening. That framing pushes investors to rebalance away from euro-zone assets rather than into them, which undermines the euro’s bid even as rates rise.
The dollar’s case: yields near 5%, an FOMC meeting, and the safe-haven bid
The euro’s weakness is only half the story. The dollar has its own momentum, and understanding it explains why this is two-sided pressure rather than a single-source problem.
The engine is the yield. The US 10-year Treasury yield reached 4.943% on 10 September 2026, its highest since October 2023, and sat at 4.97% on 14 September. With the fed funds target range at 3.50-3.75% and the ECB deposit rate at 2.50%, US assets simply pay more, which pulls capital toward the dollar regardless of what the ECB does.
Then there is Wednesday. A two-day FOMC meeting opened on 15 September 2026, with the decision due 16 September. What makes it interesting is a split in expectations.
Economists lean one way, markets the other A Reuters poll published 9 September 2026 found a majority of economists expect the Fed to hold rates steady at this meeting and through the rest of 2026.
Markets have positioned differently. CME FedWatch readings across early September ranged from roughly 56% to 88.5% for a 25 basis-point hike, a spread that reflects day-to-day volatility rather than disagreement between sources. Either way, traders are leaning toward a hike even as the economist consensus says hold.
That gap matters for you. It means Wednesday carries asymmetric risk: a hold would likely trigger a sharper dollar pullback than a hike would add to its gains, because the market has positioned more aggressively for tightening than consensus expects.
Three tailwinds are supporting the dollar into the decision:
The dollar’s 2026 rebound has been driven primarily by the rate-differential pillar, meaning Fed communications remain the single most important variable to monitor, and Morningstar’s valuation model flagging the DXY as approximately 15% overvalued adds a structural caveat to the current yield-driven momentum.
- Treasury yields pressing toward 5%, widening the yield advantage over euro-zone alternatives
- Pre-FOMC positioning tilted toward a hike
- Safe-haven demand, reinforced by higher oil prices and strong US producer-price data
| Indicator | Federal Reserve | ECB | Market signal |
|---|---|---|---|
| Current policy rate | 3.50-3.75% | 2.50% (deposit) | US yield advantage |
| Most recent decision | Pending | +25 bp (10 Sep) | ECB already moved |
| Next decision date | 16 Sep 2026 | December 2026 | Fed is live catalyst |
| Next-move probability | ~56-88.5% hike | ~90-94% Dec hike | Both leaning hawkish |
What breaks the deadlock, and what keeps the pressure on
For EUR/USD to change direction, specific conditions have to line up. This is a decision-tree, and one outcome is harder to reach than the others.
Near-term: the FOMC decision as the immediate catalyst
The recovery case has a clear technical requirement: a daily close above the 20-day EMA near 1.1594, which would reopen the path toward the 9 September peak at 1.1654. But the technical trigger needs fundamental fuel, and that only comes from a Fed hold surprise or a material softening in US yield expectations.
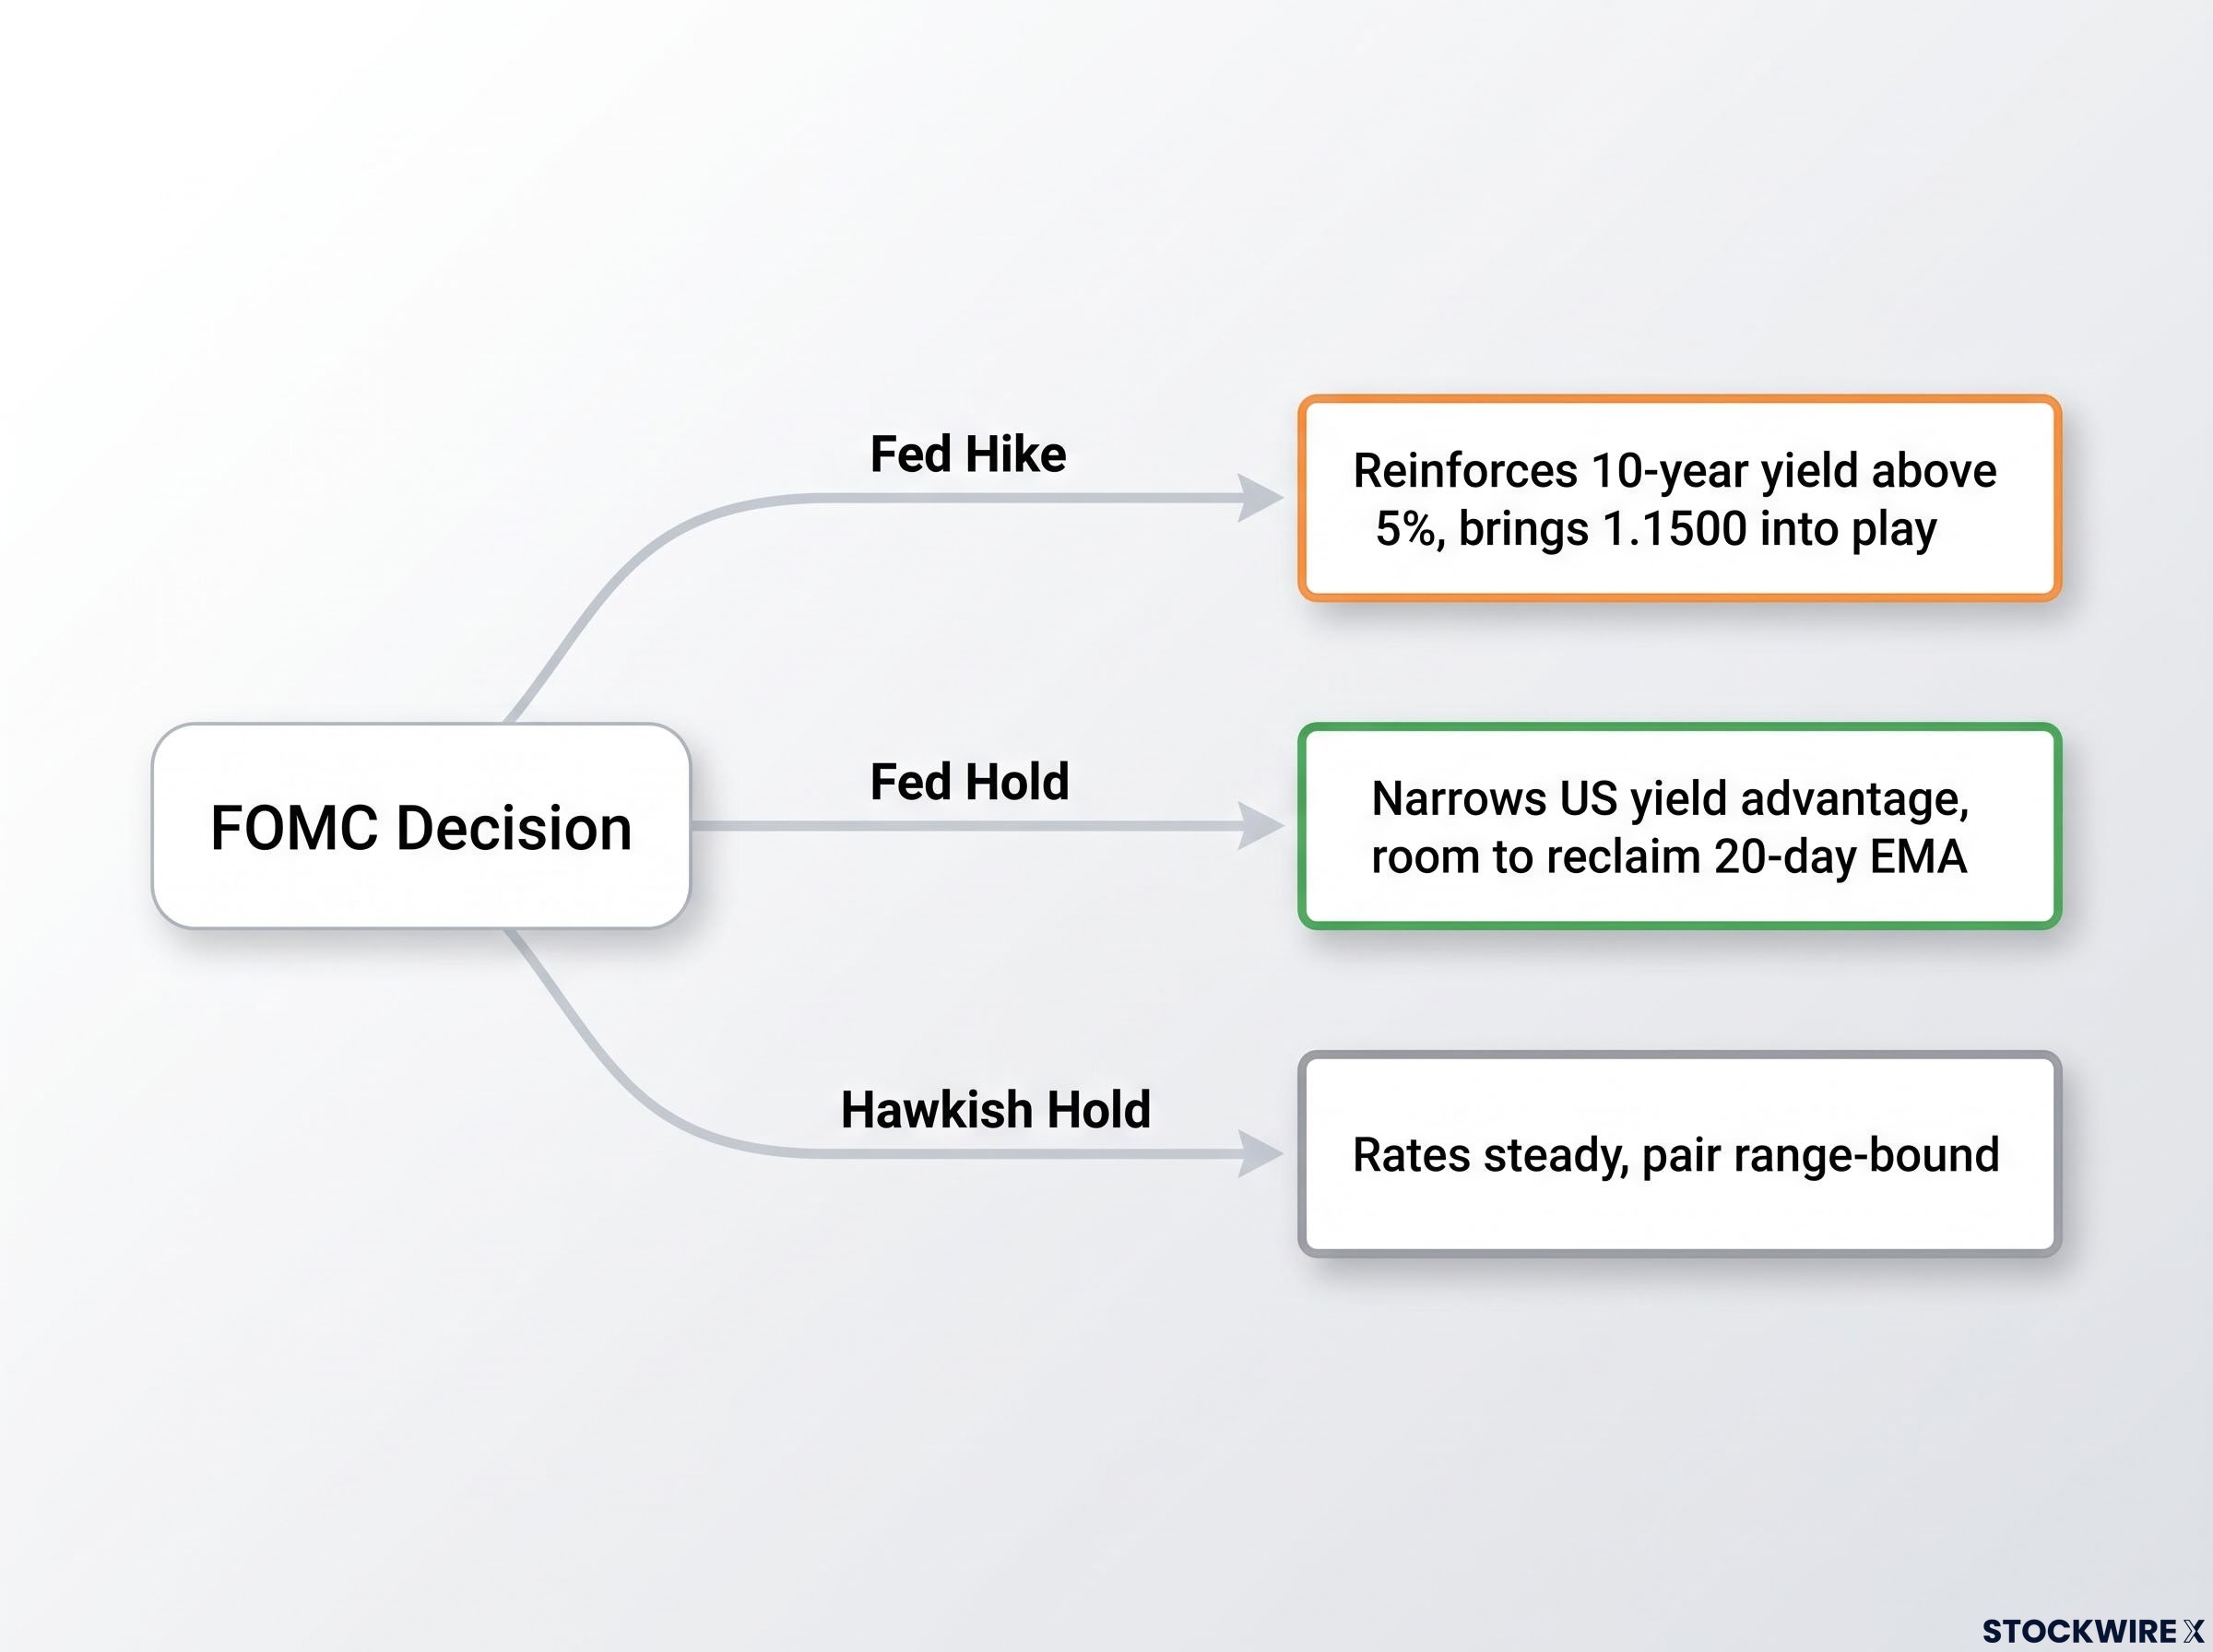
Here is how the three scenarios stack up:
- Fed hike: Reinforces the 10-year yield above 5%, removes the main path to near-term euro stabilisation, and brings 1.1500 into active play.
- Fed hold: The bigger surprise, given market positioning. Would likely narrow the US yield advantage and give EUR/USD room to reclaim the EMA.
- Hawkish hold, unchanged language: Rates steady but no dovish shift. Modest relief for the euro, but nothing decisive, leaving the pair range-bound near current levels.
A stagflationary shock BIS speeches, including from Governing Council member Yannis Stournaras, characterise the current energy shock as stagflationary, pushing inflation up while weighing on growth through higher costs and weaker real incomes.
Longer-term: stagflation risk as the structural ceiling on ECB-driven euro strength
Even a December hike may not lift the euro much, and the reason is structural. An ECB blog found that adverse energy supply shocks drove roughly 90% of the increase in energy inflation between January and May 2026. When tightening is fighting a supply shock rather than sustaining growth, its currency effect is capped.
That is the interpretive point. As long as the market reads ECB hawkishness as defensive, the euro’s response stays muted even when the bank delivers.
Goldman Sachs, Citi, and Barclays already anticipate further ECB hikes into December 2026 and potentially March 2027. Whether those moves lift the currency depends on whether euro-zone growth holds up, which is far from certain. A separate variable could shift both sides at once: an easing of Iran war-related energy tensions would reduce the ECB’s tightening urgency and remove a dollar tailwind simultaneously.
The stagflation threat from sustained high oil prices has already pushed US real interest rates approximately 50 basis points higher from their April 2026 peak, adding a second channel through which energy disruption feeds dollar strength beyond the direct safe-haven bid.
This article is for informational purposes only and should not be considered financial advice. Investors should conduct their own research and consult with financial professionals before making investment decisions. Past performance does not guarantee future results, and these scenarios are speculative and subject to change based on market developments.
The verdict before Wednesday: a pair caught between two central banks and one energy shock
The core paradox comes down to one sentence. The ECB is tightening aggressively and it is not enough, because the dollar’s fundamental case, near-5% yields and a live rate decision, is stronger right now than the euro’s.
The conditions that would change the picture are specific and knowable. The 20-day EMA at 1.1594 is the technical trigger; a daily close above it signals a genuine recovery attempt. The Fed decision on 16 September 2026 is the fundamental one.
The Fed holds the surprise The ECB has already told the market what it plans to do, and roughly 90-94% of the December hike is priced. What remains unknown is the Fed’s move on Wednesday, the one variable with genuine surprise potential left in this setup.
Underneath both central banks sits the energy shock neither controls, driving around 90% of the euro zone’s inflation increase and rooted in the Iran war disruption. That slow-moving variable will ultimately decide whether the ECB’s hawkish path eventually lifts the euro or simply deepens the euro zone’s stagflationary bind. For now, the euro at 1.1535 is waiting on Washington, not Frankfurt.