Three of the most-watched names in U.S. equities are sitting just beneath key technical thresholds right now, and the distance between a genuine breakout and a costly fakeout is smaller than most retail traders appreciate.
Roblox gapped above a declining channel this week. Meta is making its third attempt to re-enter a channel it broke out of months ago. Apple is showing relative strength against a weak tech sector while approaching a flat-base buy point it has not yet cleared. Each setup carries a distinct risk profile and its own specific confirmation criteria.
This technical breakout watch maps the exact price levels, volume thresholds, and bar-by-bar sequencing that would confirm or invalidate each move. Read it through, and you finish with a monitoring framework you can apply in real time, so you are reacting to evidence rather than chasing price.
What genuine breakouts actually look like before you commit
Before any specific stock matters, the diagnostic logic has to be in place. A breakout is not a price crossing a line. It is a sequence, and the sequence either completes or it does not.
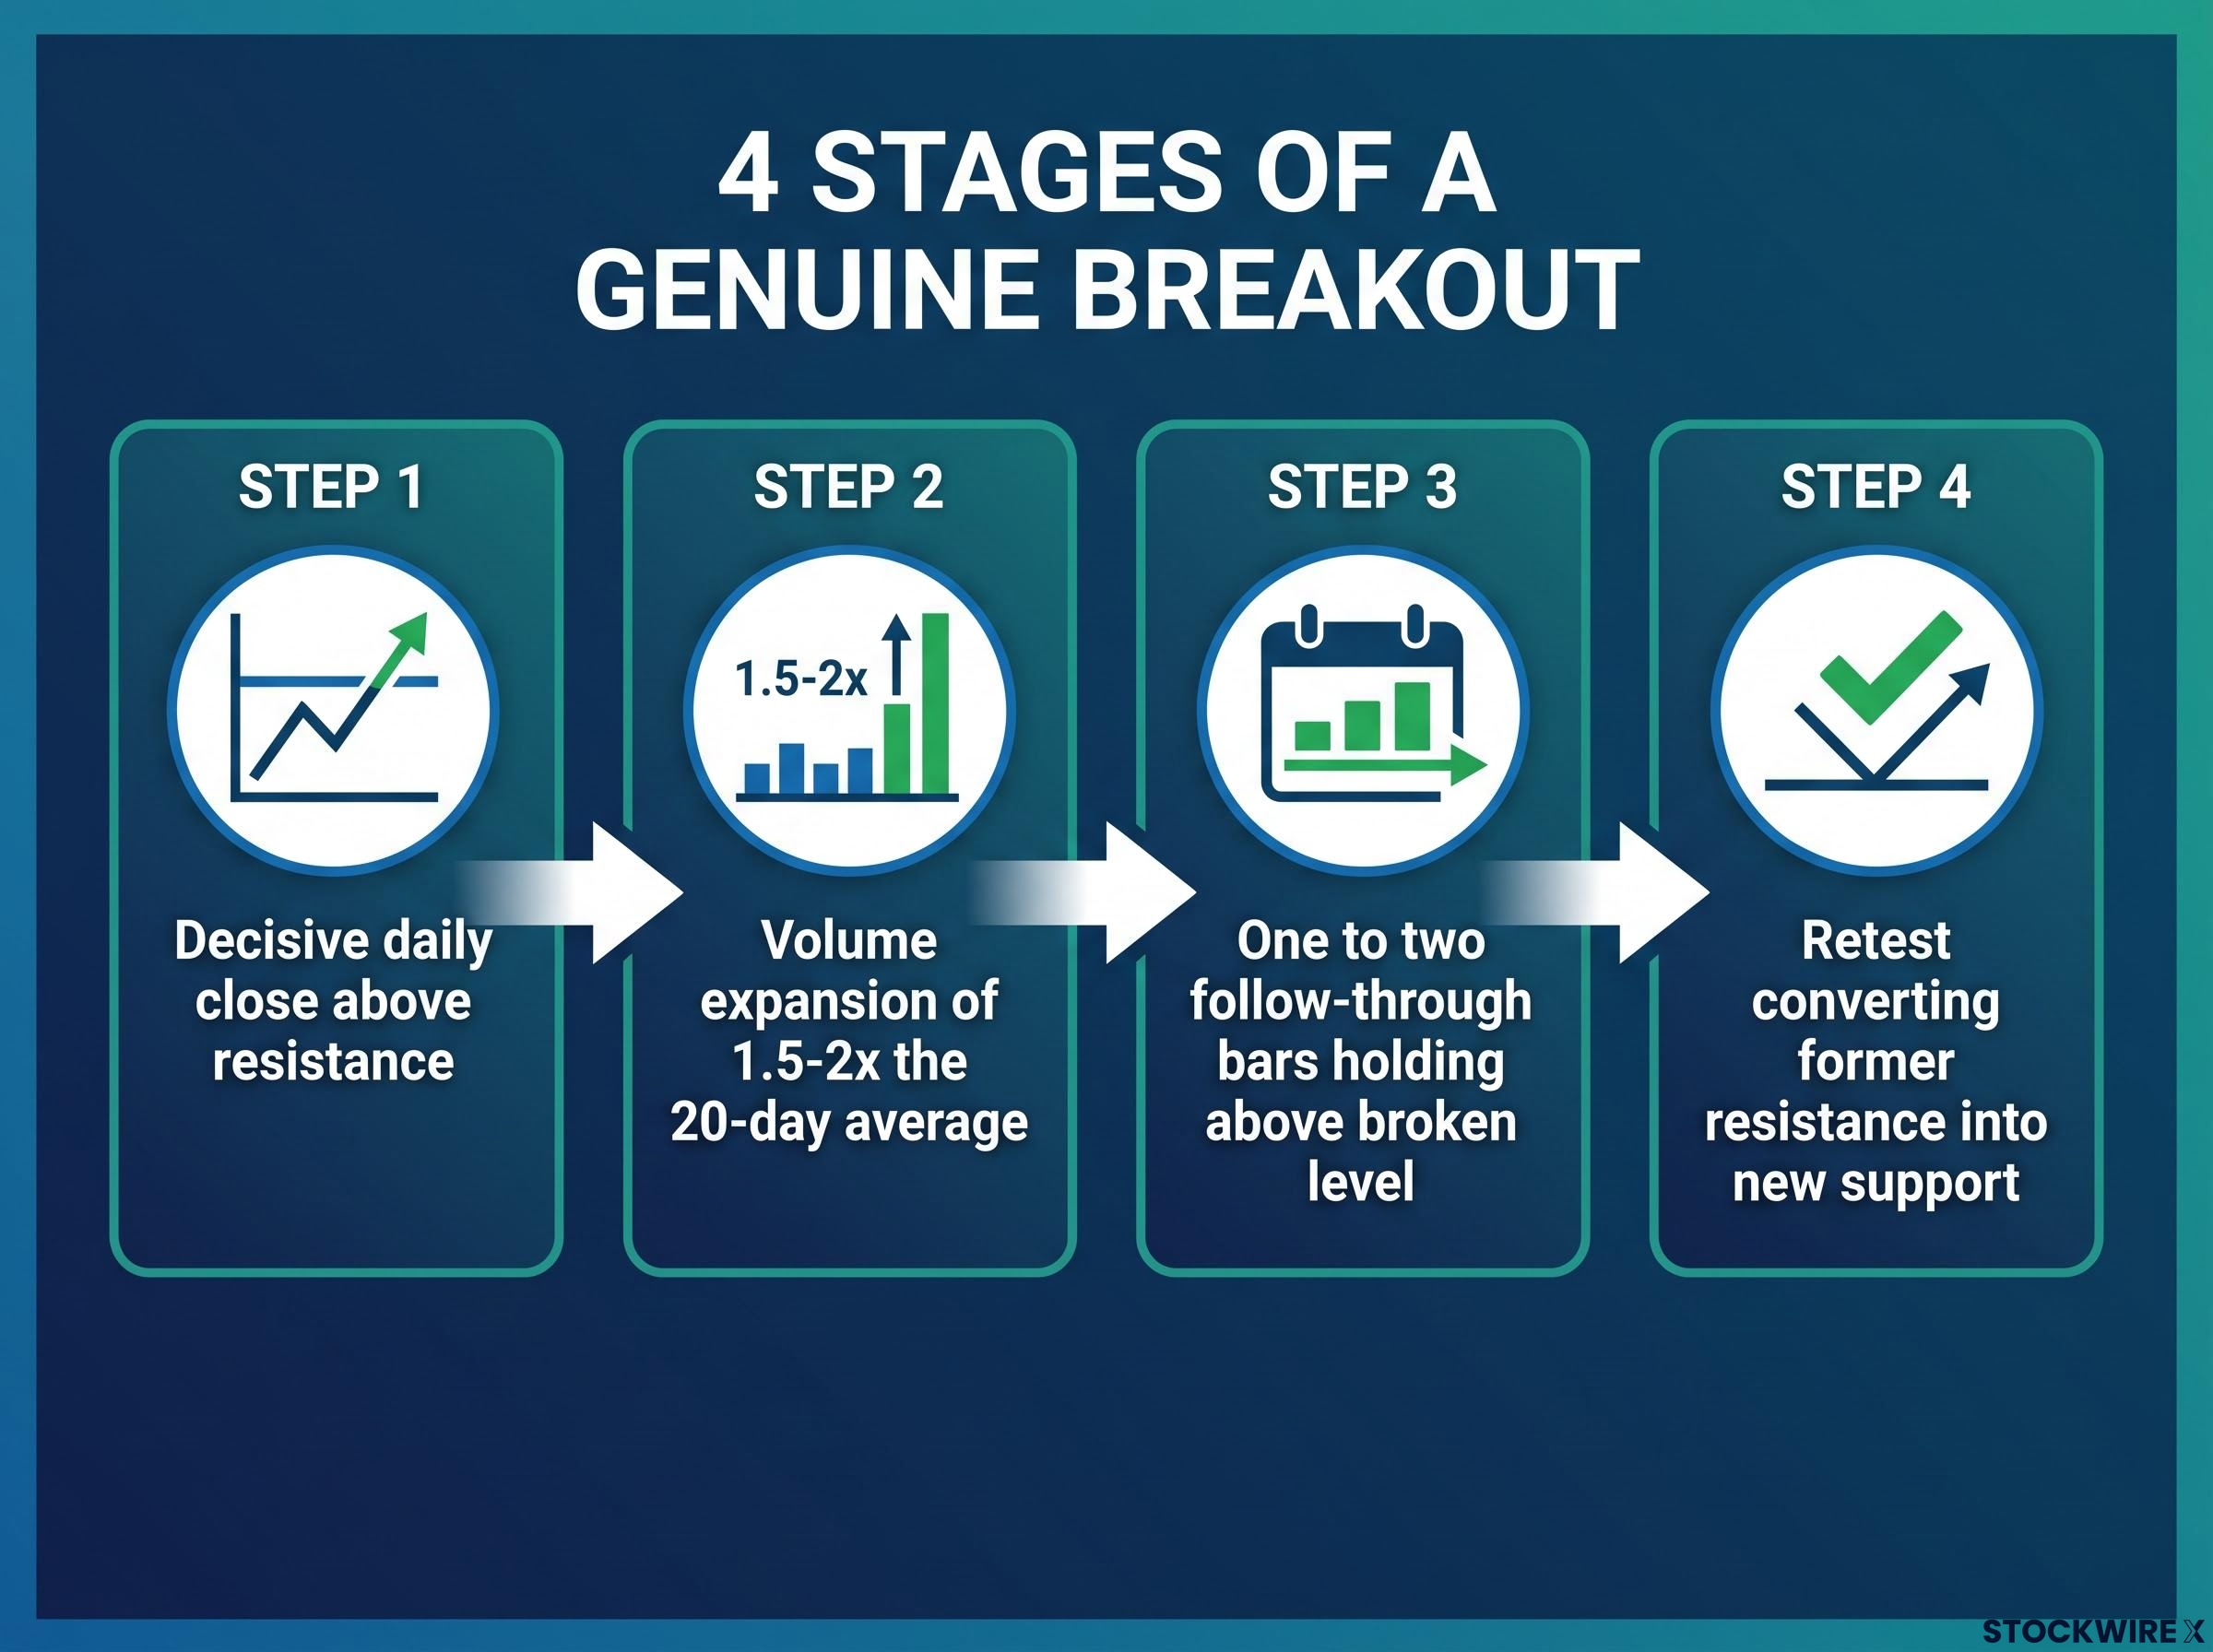
Genuine confirmation moves through four stages in order:
- A decisive daily close above resistance, not an intraday wick that gets sold back
- Volume expansion of roughly 1.5-2x the 20-day average for large-cap U.S. names
- One to two follow-through bars that hold above the broken level
- A retest that converts former resistance into new support
Empty that checklist and you are pattern-matching on price alone.
The 1.5-2x volume threshold is not arbitrary: volume confirmation at that level separates institutional participation from retail-driven price moves, and Guardant Health’s confirmed rally to $128 in May 2026 is one of the cleaner recent demonstrations of why the bar exists.
Breakouts in large-cap U.S. names that occur on 1.5-2x the 20-day average volume show meaningfully better follow-through than thin-volume moves.
The false-breakout signature is almost the mirror image. It shows up as average or sub-average volume on the initial push, a reversal within one to three bars, and a close that falls back inside the prior range. When that happens, the move was a liquidity event, not a trend signal.
Why does this checklist matter more than the chart pattern itself? Because the patterns fail more often than most traders assume. Technical literature, including Thomas Bulkowski’s failure-rate tables, shows a significant fraction of chart patterns never achieve even a 10-15% move before reversing. That tells you the confirmation sequence is not optional polish. It is the core risk-management act, the thing standing between disciplined entry and a trap.
There is one more condition worth internalising: alignment. A breakout in a single mega-cap is more trustworthy when the sector’s relative-strength line is breaking higher too. The clearest recent example came in August 2025, when the CIBR cybersecurity ETF broke falling channel resistance as the XLK technology sector pushed its relative-strength line above old resistance and retested it as support. Both kept leading afterward. NVIDIA’s dual trendline break in November 2025 told the same story: clean breaks supported by sector strength tend to hold. A break against sector fatigue or index consolidation is where the fakeouts cluster.
Sector relative-strength signals of this kind are most precisely tracked through a Relative Rotation Graph, which plots each sector’s momentum against its benchmark weight and shows clockwise rotation through leading, weakening, lagging, and improving quadrants before a transition is confirmed in price.
When big ASX news breaks, our subscribers know first
Roblox: gap above the channel, but the hard work starts here
Roblox gave the bulls their moment this week. Price gapped above the declining parallel channel that had contained it for most of 2026, closing the regular session at $51.29 on 14 September 2026, up 12.73% on the day. On the chart, that is the kind of move that pulls people in.
Here is where the frame needs tightening. The gap is the initiating signal, not the confirmation. Analysis attributed to Drew Dosek of Verified Investing frames the requirement plainly: bulls need a close above the gap-day session high to reframe former resistance as a support floor. A pullback toward the former channel upper boundary would then act as a potential re-entry zone.
The resistance that actually matters sits well above current prices, in the $58-$61.50 zone, with the next key level at $61.42 and an intermediate cluster near $58. There is a longer-term gap zone flagged between $59 and $66.34, though the claim that such gaps fill roughly 90% of the time is unverified and should not be treated as fact.
| Level | Price | Significance |
|---|---|---|
| Current price (14 Sept close) | $51.29 | Gap-day close, up 12.73% |
| Intermediate resistance | $58 | First cluster inside resistance zone |
| Upper resistance zone | $61.42-$61.50 | Next key upside test |
| Gap zone upper bound | $66.34 | Longer-term upside target (unconfirmed) |
| Analyst consensus target | $59.21 | Average across 31 analysts, Hold |
Analyst opinion is split and hardly euphoric. The average 12-month target sits at $59.21 across 31 analysts, with a consensus Hold. Wells Fargo’s Ken Gawrelski raised his target to $56 with an Overweight rating on 30 June 2026, and Wedbush’s Alicia Reese held Outperform at $65 on 24 July 2026. But a Simply Wall St update on 3 September 2026 cut its fair value estimate toward $48 as analysts reduced bookings assumptions.
The most important data point is not on the price chart at all. It is history. Roblox has attempted this exact type of move before, rejecting off a descending trendline on low volume in a prior episode. That tells you the stock has set this trap once already, and that the gap only becomes meaningful if volume and follow-through confirm what price is hinting at. Robinhood’s differently timed quote of $47.56 the same day is a reminder that even the current price is not perfectly clean.
What would actually confirm this move
The sequence from here is specific. The gap-day close has already happened. That was gate one.
Gate two is a next-session close above the gap-day high. Gate three is a test of the former channel upper boundary that holds as support rather than folding.
Any close back inside the channel invalidates the setup and resets the structure to the prior range. This is the highest-risk setup of the three: the resistance zone is still miles above current prices, and the stock has failed at comparable structure before.
Meta: three attempts, one question the chart cannot yet answer
Meta has now knocked on the same door three times. Price was contained within an ascending parallel channel from December 2023, broke down from it in March 2026, and is currently making a third attempt to climb back inside. Each attempt tells a story, but not yet a conclusion.
The near-term battleground is $663, the close that would trigger initial trend-line confirmation. On 11 September 2026 the stock reached $664.24 intraday, then failed to close above the level. It traded at $652.89 intraday on 14 September 2026, up from a previous close of $648.03, still short of the gate.
That repeated rejection is the diagnostic tension. Three approaches to a level, no close above it, and the chart genuinely cannot tell you yet whether you are watching accumulation or distribution. There are two credible readings, and both deserve equal weight.
The accumulation case treats each test as base-building, with weaker holders shaken out while stronger hands absorb supply, pressure quietly building toward a powerful break. The distribution case, drawn from the Wyckoff framework, reads the same pattern as institutional selling, where each failed attempt traps late longs before a larger decline.
Repeated failed breakouts at range highs, accompanied by volume divergence, are hallmarks of distribution rather than accumulation. Each failed attempt may represent an up-thrust that traps late long positions.
Wall Street, notably, is firmly on the bull side. The average 12-month target is $788.88 across 47 analysts with a Strong Buy consensus, and a high target of $1,000. J.P. Morgan’s Doug Anmuth upgraded Meta to Buy and lifted his target from $640 to $820 on 10 September 2026, and Bank of America’s Justin Post maintained Buy at $810 the same day. Wedbush’s Ygal Arounian was more measured, holding at Hold while raising his target from $595 to $650 on 11 September 2026.
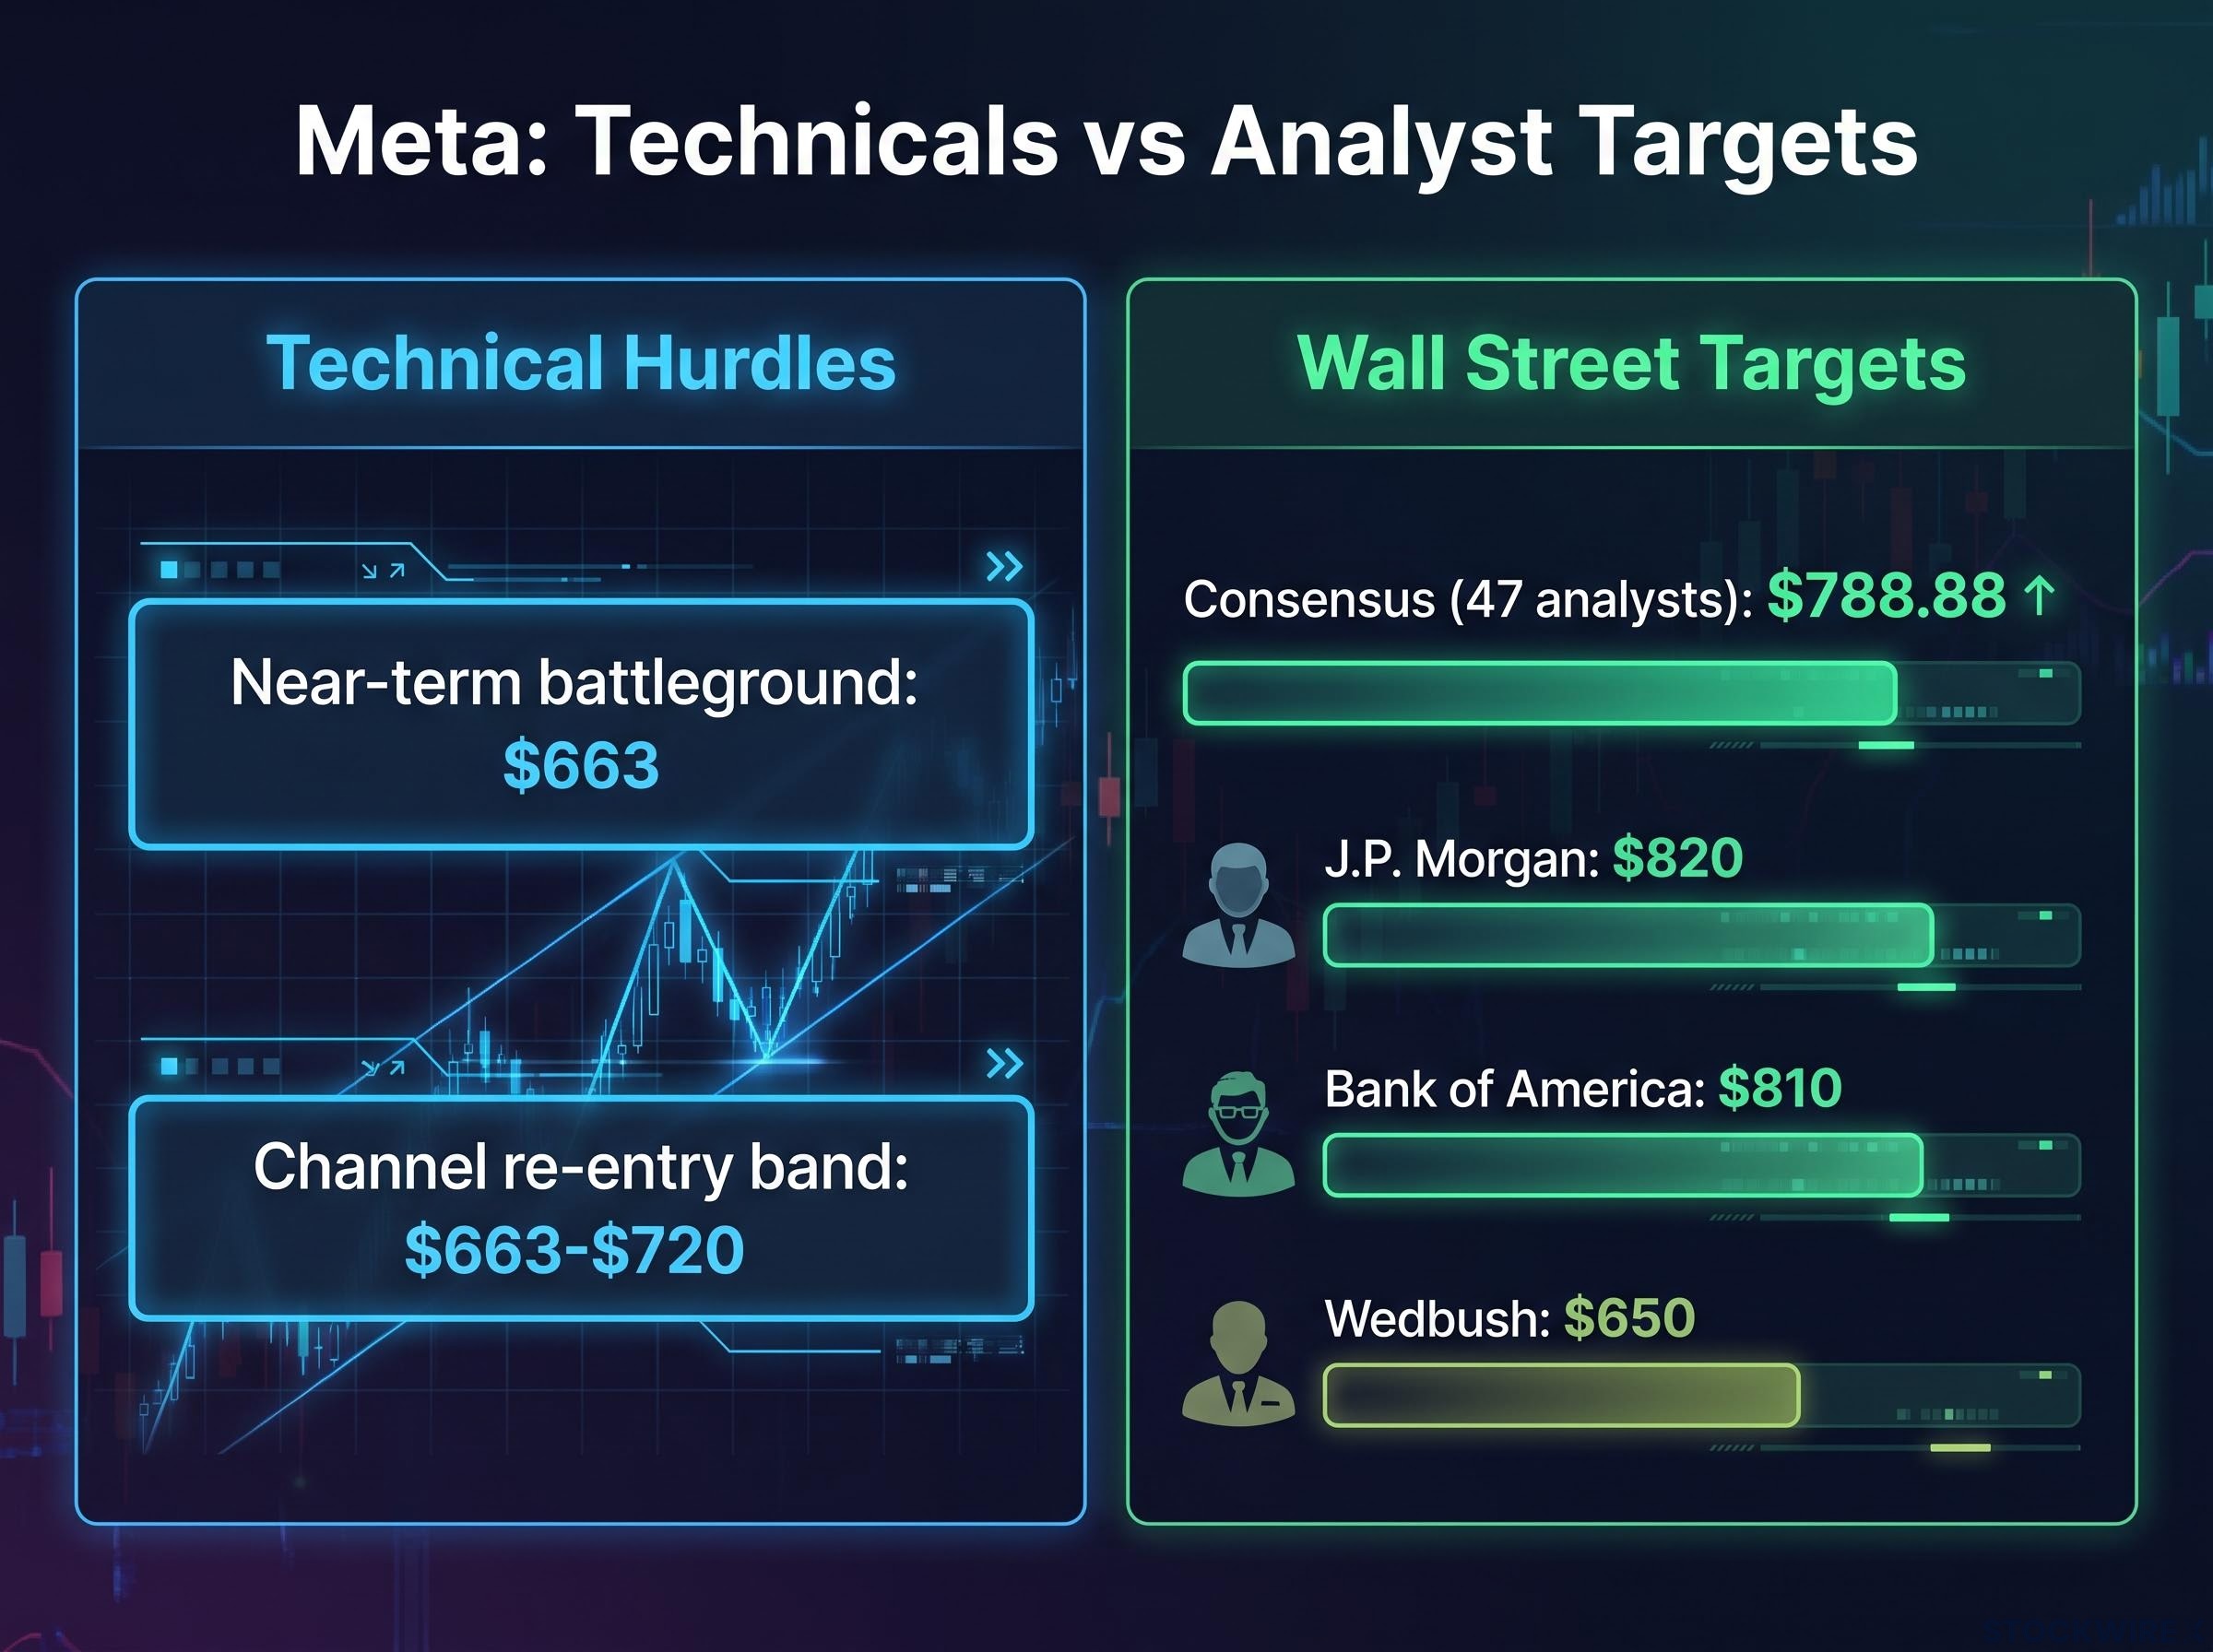
The gap between the $663 first gate and the roughly $789 consensus target is why the reward-to-risk math here is entirely conditional. It depends on which interpretation the volume eventually validates.
Accumulation or distribution: what to look for
The confirmation gates run in sequence:
- A close above $663, the initial trend-line confirmation
- A sustained hold within the $663-$720 channel re-entry band
- A reclaim of $720-$725, the level that fully negates the breakdown signal
The accumulation signature would show equal or higher volume on each test, shallower pullbacks, and eventually a close that sustains above the band. The distribution signature would show lower volume on each upside test, heavier volume on down days, and gap-ups that reverse. Price action alone will not settle this. Volume is the discriminating variable.
Apple: relative strength as a signal, not just a description
Apple’s setup is the quietest of the three, and arguably the highest quality for it. The stock is trending upward while much of the technology sector faces downward pressure. That relative outperformance is not just a description of what has happened. It is a leading indicator, and a stronger one than outperformance during broad market strength, because it shows demand holding when the tide is against it.
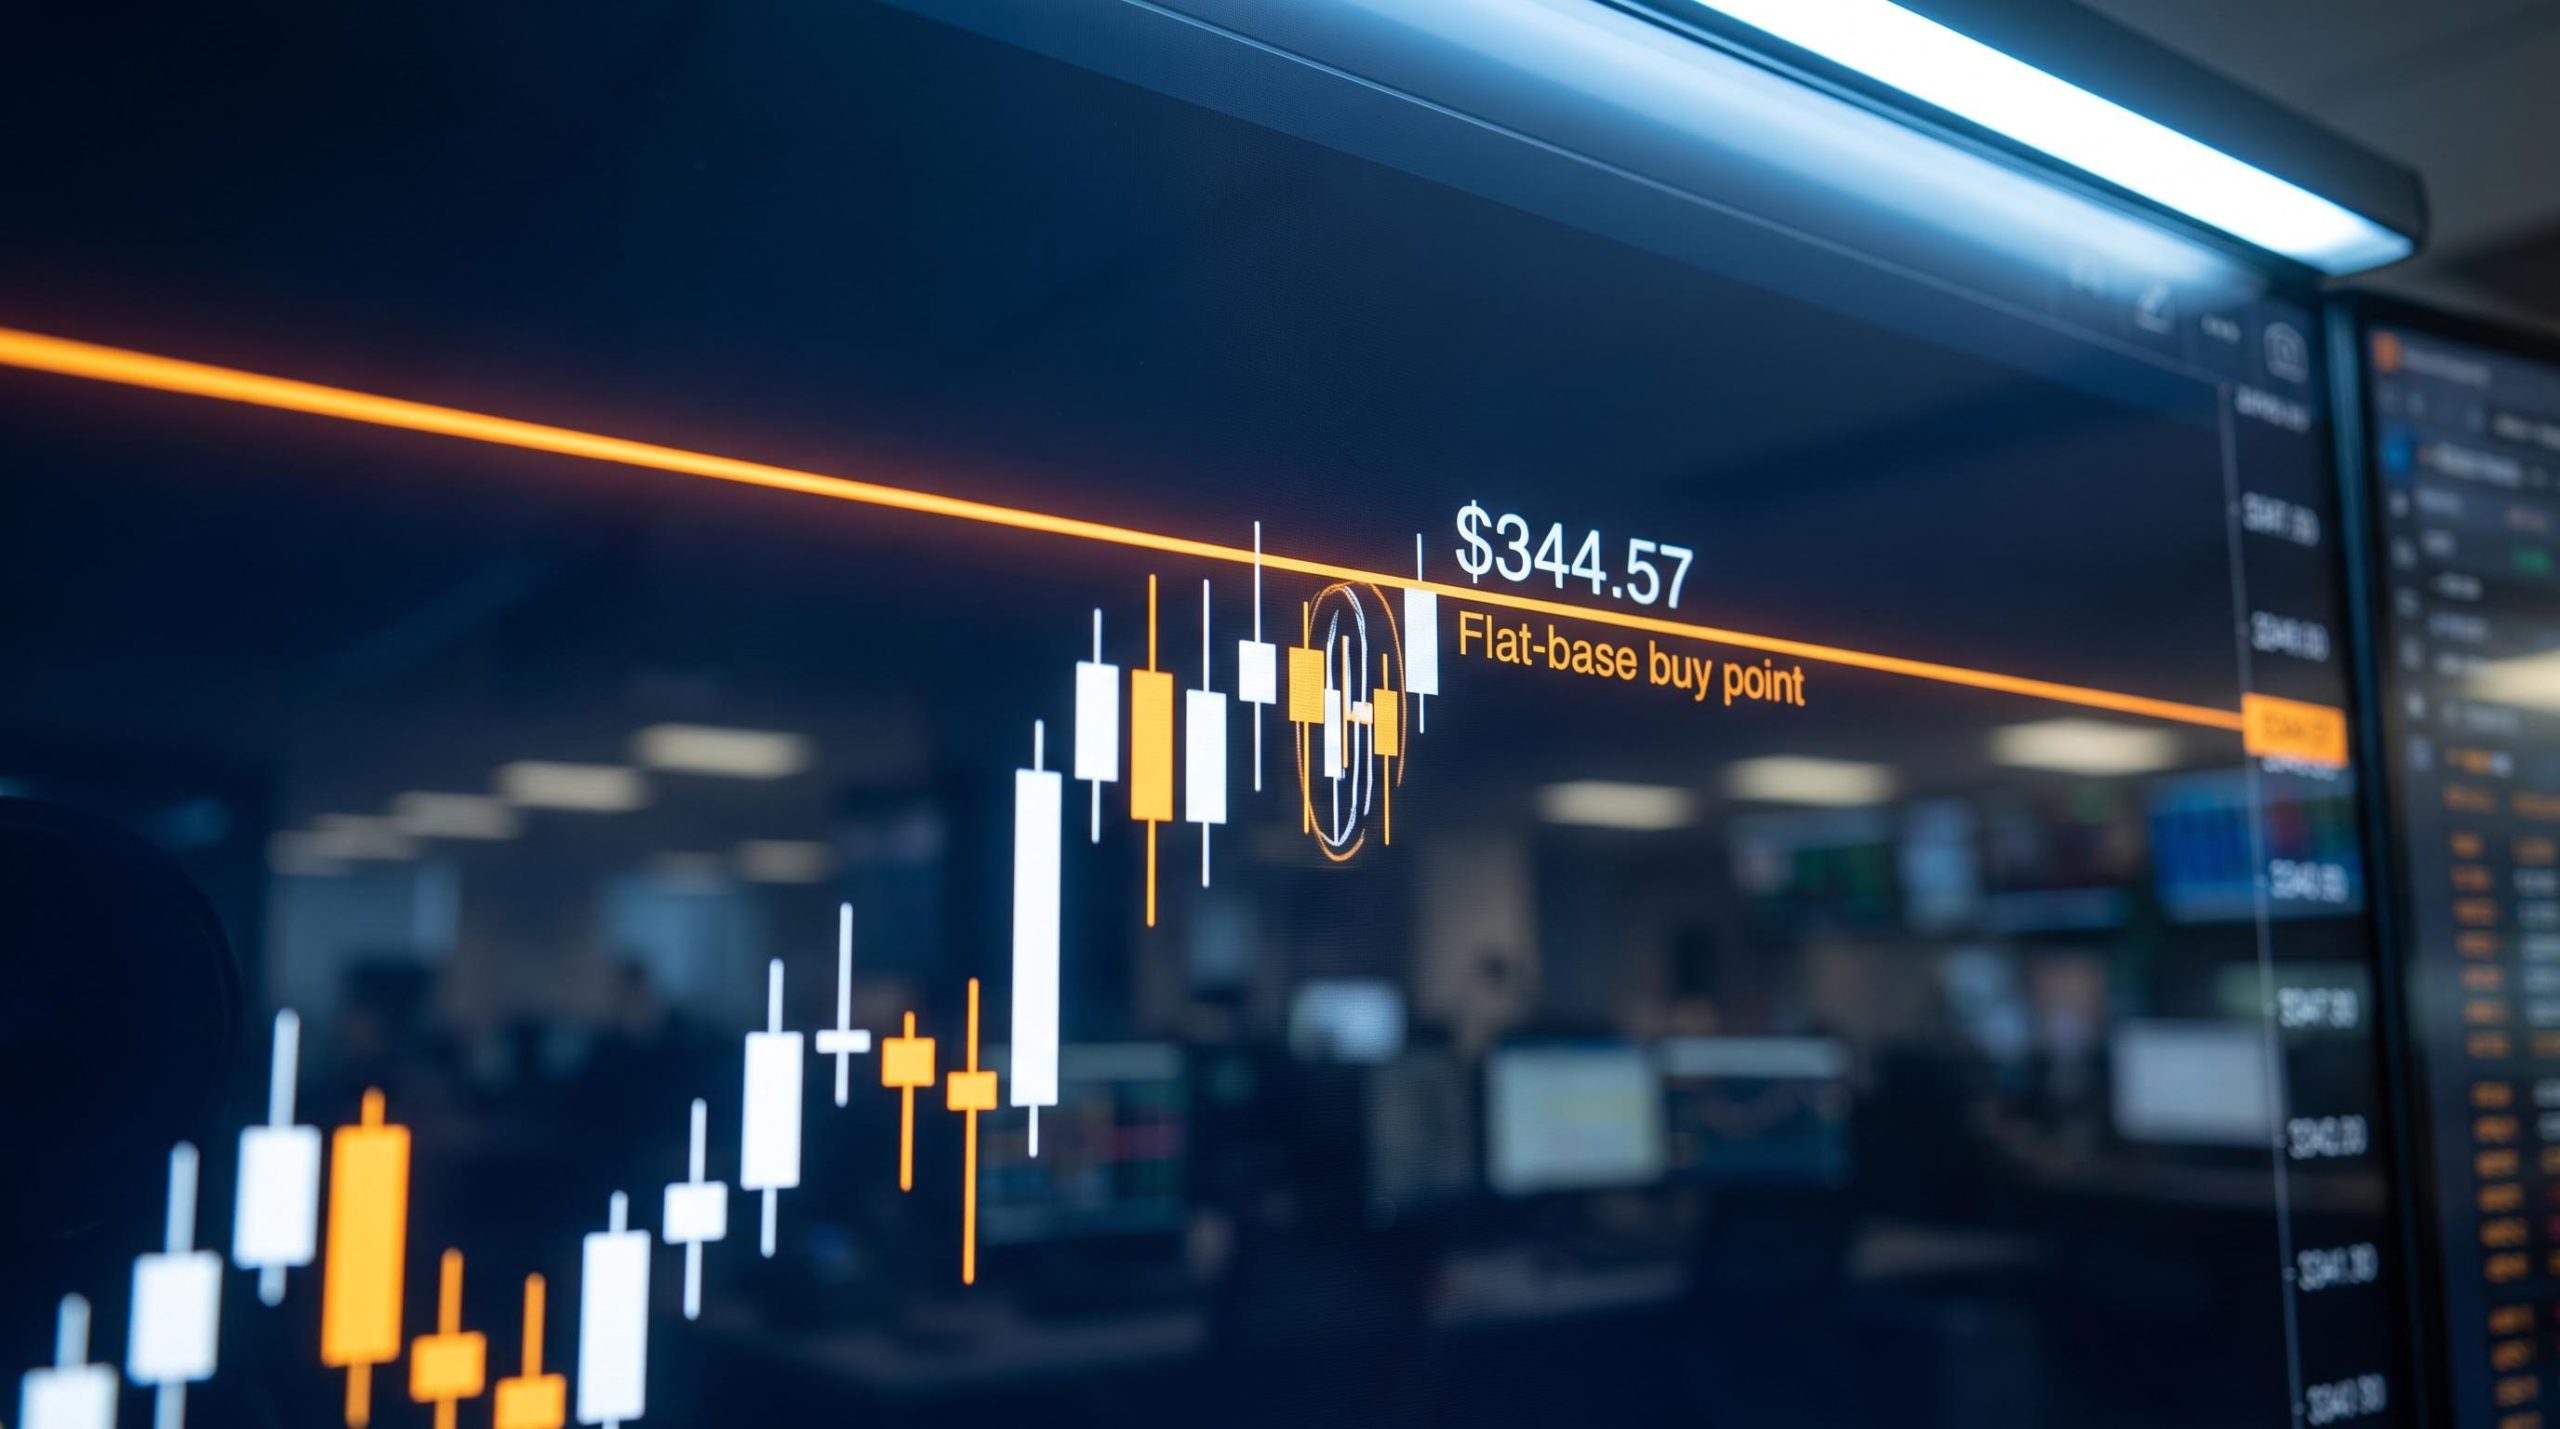
Apple is trending upward while much of the technology sector faces downward pressure, suggesting relative outperformance that, if sustained, sets up a test of the $344.57 flat-base buy point.
The level that would translate that leadership into a confirmed trend move is $344.57, the flat-base buy point derived from the topping-tail high on 29 July 2026. Investor’s Business Daily identifies it as a pending breakout trigger, and FXEmpire’s 1 September 2026 analysis references the same level as less than 6% above then-current prices, contingent on momentum. Crucially, it has not been cleared. Apple traded at $334.78 intraday on 14 September 2026, roughly 3-4% below the pivot, near 90% of a 52-week range of about $225-$344.
Analyst targets cluster right around the current price, and they disagree. MarketBeat’s average is $334.91 from 39 analysts (Moderate Buy), while Nexqual reports a mean of $324.40 across the same analyst count and period, a discrepancy likely down to averaging method or update timing. S&P Global’s consensus on 31 July 2026 was $321.66 from 46 analysts, with a high target of $400.
Here is what that consensus tells you. With MarketBeat’s average sitting barely above the previous close of $332.27, Wall Street is not pricing in the $344.57 breakout. A confirmed move through that level would be a positive re-rating, not simply catching up to expectations.
The confirmation checklist for Apple is clean:
- A decisive close above $344.57 on expanded volume
- One to two follow-through sessions holding above the level
- The sector relative-strength line continuing to break higher rather than reverting
Unlike Roblox’s gap or Meta’s repeated tests, Apple has not yet attempted its level. That makes it the cleanest pending setup of the three, and the one that rewards patience: the signal is in place, the trigger is close, and you have not already missed the move.
Three setups, one framework, three different risk profiles
Line the three up against the same four-stage framework and you are not looking at a ranking. You are looking at a decision tree, with each name sitting at a different point in the confirmation sequence.
Roblox is at stage one, a gap above the channel that needs its next close to advance. Meta is stuck between the first gate and full negation, its three-attempt structure unresolved. Apple has not yet attempted its trigger, its relative strength serving as the pre-breakout foundation.
| Stock | Price (14 Sept) | First Gate | Full Confirmation | Key Risk |
|---|---|---|---|---|
| Roblox | $51.29 | Close above gap-day high | $58-$61.50 zone | Prior low-volume rejection |
| Meta | $652.89 | Close above $663 | $720-$725 reclaim | Distribution signature |
| Apple | $334.78 | Close above $344.57 | Follow-through on volume | Level not yet tested |
Two macro conditions would move all three in parallel, and both are worth watching:
- Nasdaq directional strength versus consolidation, since individual breakouts are more fragile when the index is rolling over
- Whether the XLK relative-strength line continues to hold above former falling resistance, the sector-participation check
As of mid-2025 through mid-2026, technology and communications relative-strength lines have been sitting near the upper bounds of multi-year ranges, which historically favours breakouts in leaders over laggards.
That sector-participation check matters more in the current environment because intra-market dispersion reached levels not seen since December 1999 in April-May 2026, making individual breakout quality in leaders a more powerful return driver than index-level direction.
Reading these three together tells you where the tech leadership thesis currently lives. Roblox is the early-stage signal that still needs validating. Meta is the contested zone where the bull-bear argument is most alive. Apple is the relative-strength anchor that would most powerfully confirm or deny the broader breakout narrative if it clears $344.57. Confirmation across multiple structures is a stronger read on the health of the thesis than any single stock clearing any single level.
What the next two weeks will actually tell you
The next fortnight is a diagnostic period, not a waiting game. Each setup produces its own evidence on its own clock, and knowing which signal to weigh when is what turns monitoring into a decision.
Run the sequence like this:
- Track Roblox’s next-session close against the gap-day high, the most immediate gate of the three
- Watch Meta’s volume on the next approach to $663, the medium-term discriminator between accumulation and distribution
- Monitor Apple’s approach to $344.57, paying attention to whether relative strength against the sector holds
Meta’s $663 is the most live near-term gate, given price already touched $664.24 intraday without closing above it. Apple, roughly 3-4% below its pivot, offers the most runway for patient monitoring.
One structural caveat matters most. When this many high-profile names cluster near obvious technical levels at once, false-breakout risk rises, because stop orders and algorithmic triggers concentrate in exactly those zones. Bulkowski’s failure-rate data is the closing anchor here: a significant share of patterns fail before achieving even a 10-15% move, so price proximity is not evidence.
Single-stock volatility is hitting the 98th percentile of its own history even as the VIX sits near multi-year lows, a structural contradiction that concentrates both the opportunity and the false-breakout risk in exactly the kind of high-profile, near-resistance setups that Roblox, Meta, and Apple currently represent.
The levels are mapped and the framework exists. Let confirmation, not price nearness, drive any decision.
This article is for informational purposes only and should not be considered financial advice. Investors should conduct their own research and consult with financial professionals before making investment decisions. Past performance does not guarantee future results. Financial projections are subject to market conditions and various risk factors.