The S&P/ASX 200 Real Estate index has fallen roughly 12% since 5 August 2026, and one name captures the disconnect better than any other: Wesfarmers shed nearly 18% in a single month despite delivering an FY26 result that landed broadly in line with expectations. When a blue-chip conglomerate gets sold that hard on no earnings miss, the selling is outrunning the fundamentals.
That gap is not a one-stock story. Reserve Bank of Australia (RBA) rate expectations are still tilted toward tightening, consumer sentiment has slid back toward the near-recessionary readings of early 2026, and the two pressures are repricing rate-sensitive and consumer-facing sectors at the same time.
Here is a map of where the selling has actually landed, what is driving it, and what happened to the stocks that flashed oversold signals last week. The point is to give you both the technical signal and the fundamental context, so you can judge whether the signal means anything before you act on it.
Why REITs and consumer stocks are taking the worst of it
The engine behind this selloff is monetary policy, and the shape of the RBA’s latest decision matters more than the decision itself.
On 11 August 2026, the RBA’s Monetary Policy Board unanimously left the cash rate at 4.35%. What stands out is that the Board did not discuss a cut at all. The debate was between holding and hiking, which tells you rate relief is simply not the base case heading into the next decision on 29 September 2026.
The RBA Board minutes from 11 August confirm that the Board considered no scenario in which a rate cut was warranted, a framing that leaves the cash rate path elevated and reinforces the cost-of-capital pressure on income-generating assets.
Market pricing agrees. The cash-rate path is hovering around 4.4-4.5% across the forecast horizon and staying elevated into late 2026. For a real estate investment trust (REIT), a property-owning company that pays out most of its rental income to shareholders, a higher-for-longer rate outlook lifts borrowing costs and pushes down the value investors will pay for those income streams. That is the cost-of-capital squeeze doing its work.
The cost-of-capital squeeze at work here operates through four distinct rate transmission channels, each of which is bidirectional, meaning the same mechanics that compress REIT valuations in a tightening cycle reverse sharply if the RBA pivots toward easing.
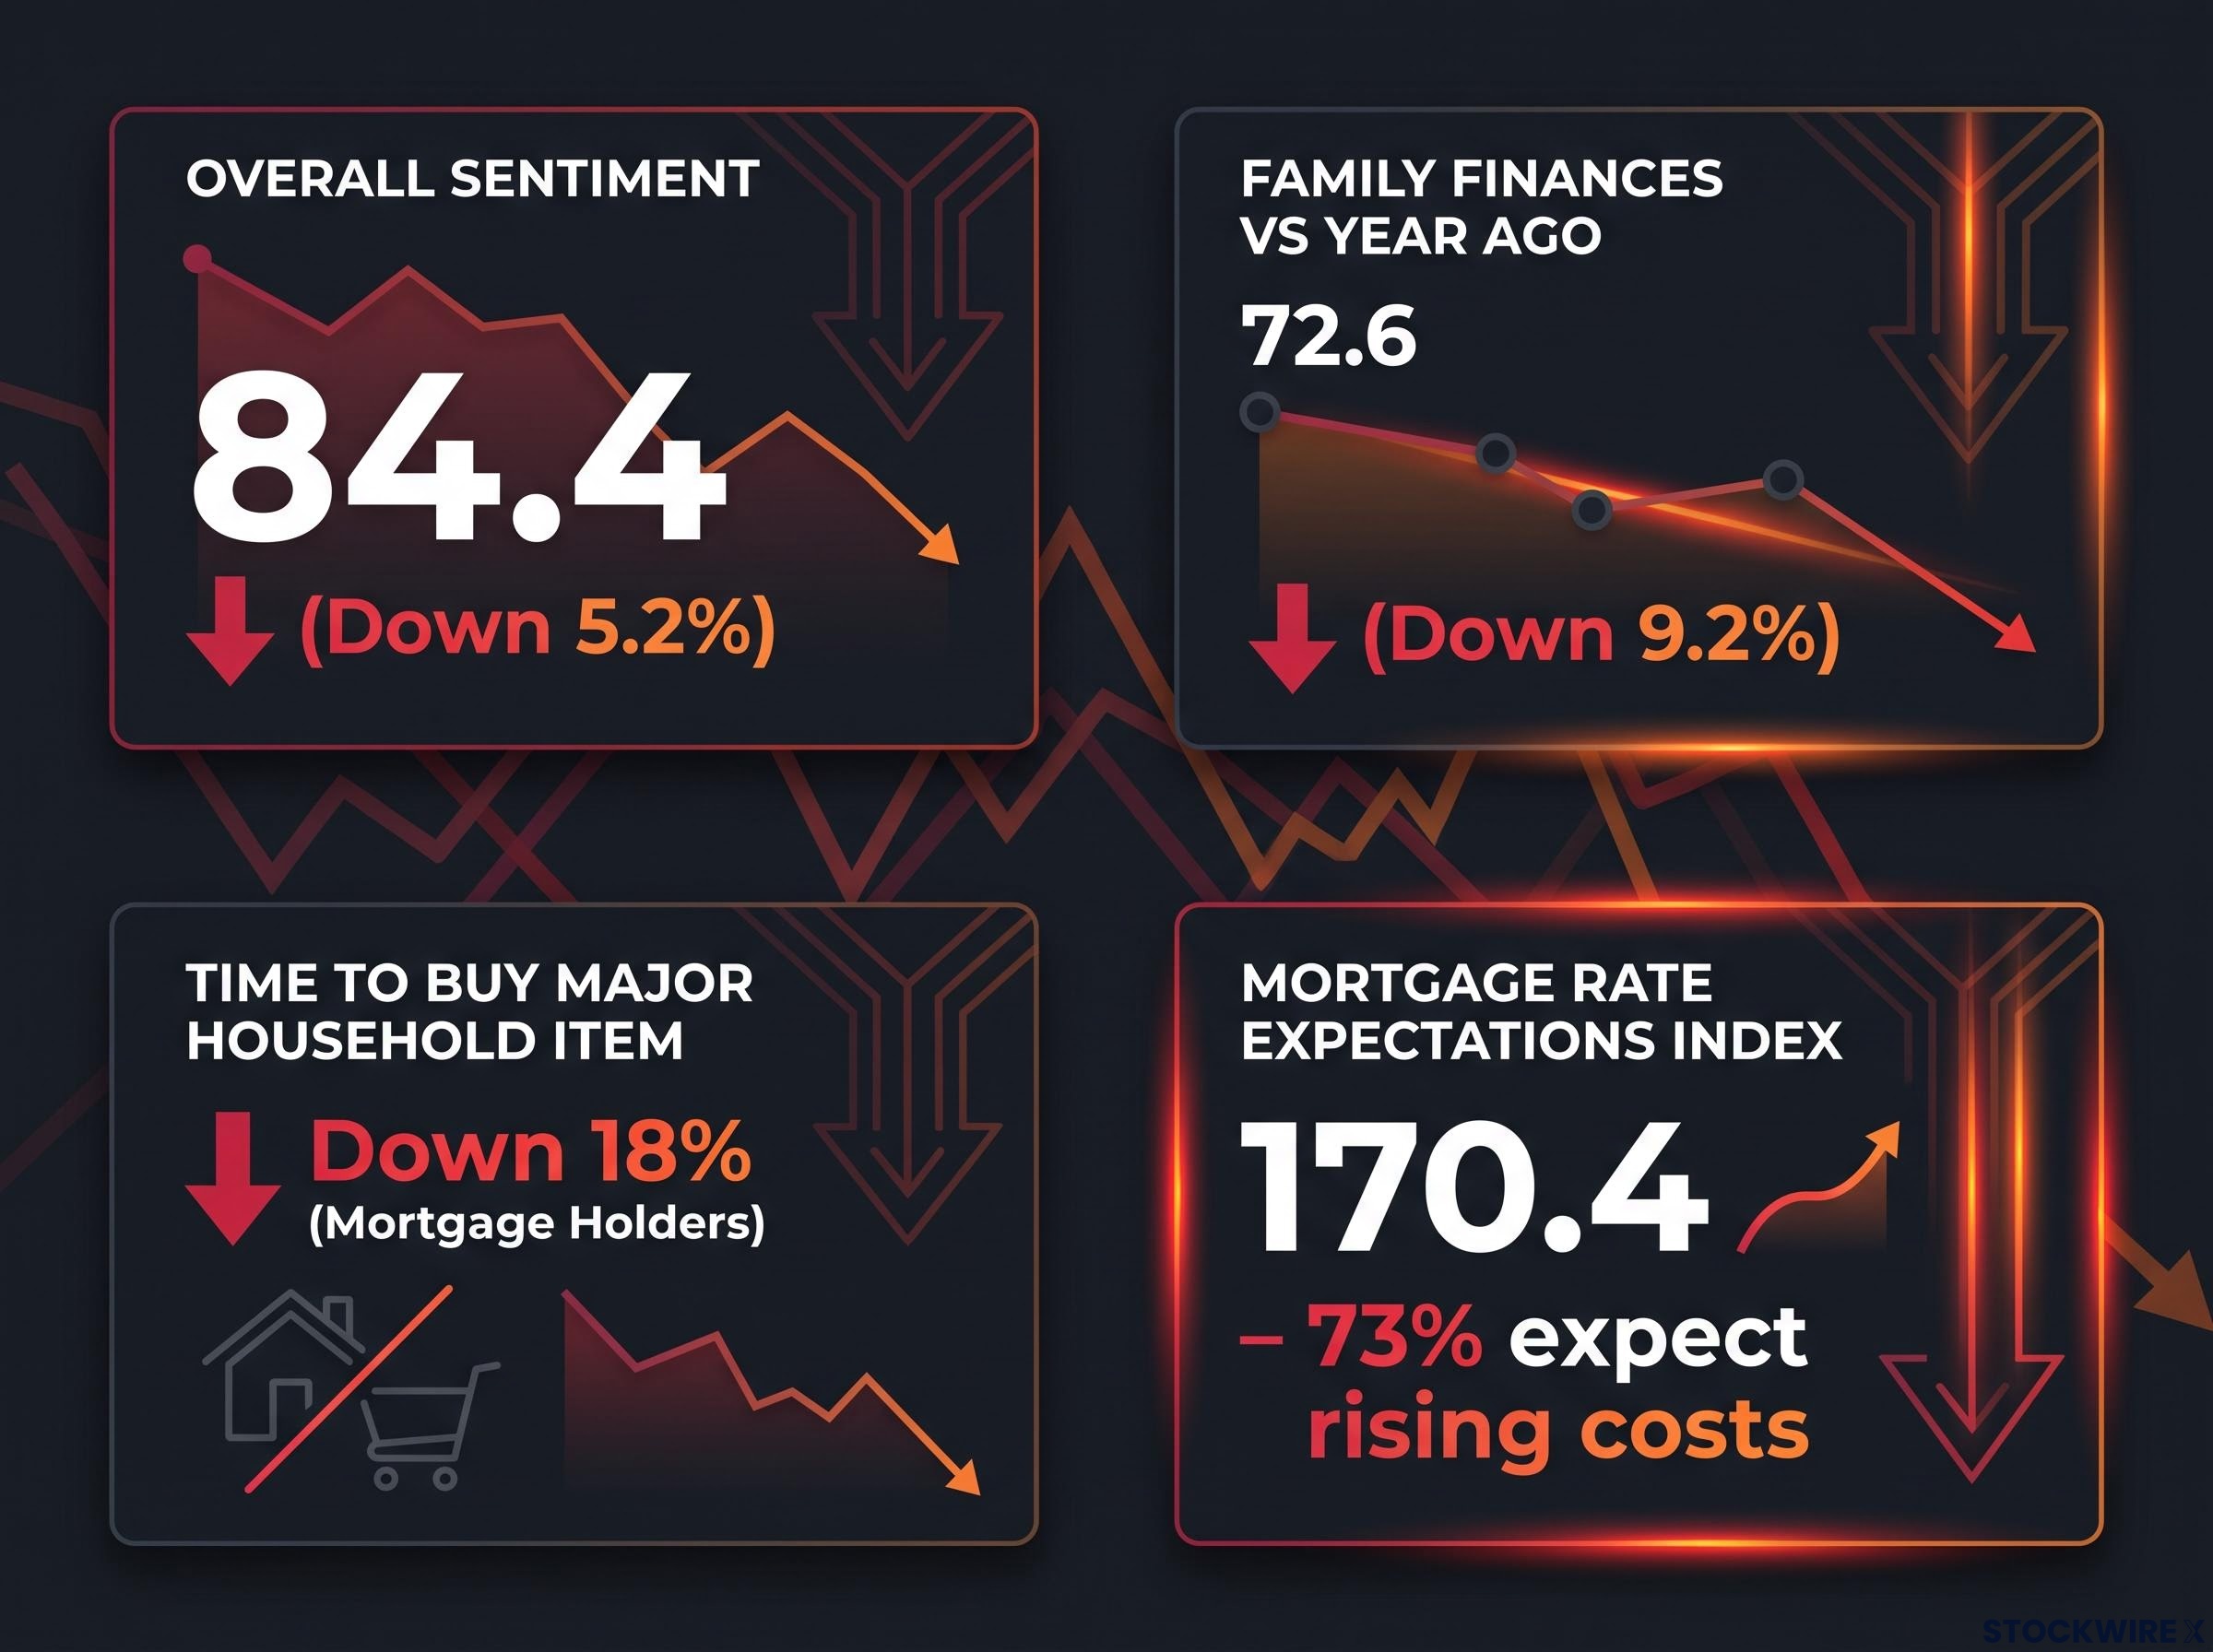
The demand side is confirming the same pressure. The Westpac-Melbourne Institute consumer sentiment index fell 5.2% month-on-month in September 2026 to a reading of 84.4, wiping out most of August’s gain and leaving households behaving as though a recession has already arrived.
The deterioration is heavily concentrated in the mortgage belt, and three subindices show why consumer-facing stocks are feeling it:
- Overall sentiment reading: 84.4, down 5.2% on the month
- ‘Family finances versus a year ago’: 72.6, down 9.2%
- ‘Time to buy a major household item’: down 4.8% overall, but down a severe 18% among mortgage holders
The single most striking figure sits in what households expect next.
Mortgage Rate Expectations Index: 170.4 (up 7.3% in September 2026) Roughly 73% of mortgaged households, and 64% of all consumers, expect borrowing costs to rise further over the next 12 months.
When households expect more rate rises, they defer big-ticket spending, and that is the demand headwind hitting consumer discretionary names from the opposite direction to the one hitting REITs.
There is precedent for how badly this can play out. During Q1 2026, when the cash rate reached 4.10%, the A-REIT sector returned minus 16.5% against a broader market decline of just 1.6%. That history is why the current cluster of oversold property names deserves caution rather than reflexive bargain-hunting: the sector has shown it can keep falling while the rest of the market holds steady.
When big ASX news breaks, our subscribers know first
This week’s oversold list: where the momentum signals are loudest
With the Real Estate index down about 12% since early August, property names dominate the oversold screen for the week ending 11 September 2026. But the list extends well beyond REITs.
The measure here is the 14-day Relative Strength Index (RSI), a momentum gauge that scores how fast and how far a price has moved. A reading at or below 30 flags an oversold condition, suggesting the recent decline may have been excessive and a bounce could follow. The lower the number, the more stretched the selling.
RSI divergence signals carry a meaningfully different evidential weight from a simple sub-30 threshold reading: academic research covering Nifty 50 equities across 24 years found divergence at structural confluence levels achieved an 87.61% success rate, a result that threshold-only readings cannot replicate.
| Stock (ASX Code) | RSI | Price | 1-Week Return | 1-Month Return |
|---|---|---|---|---|
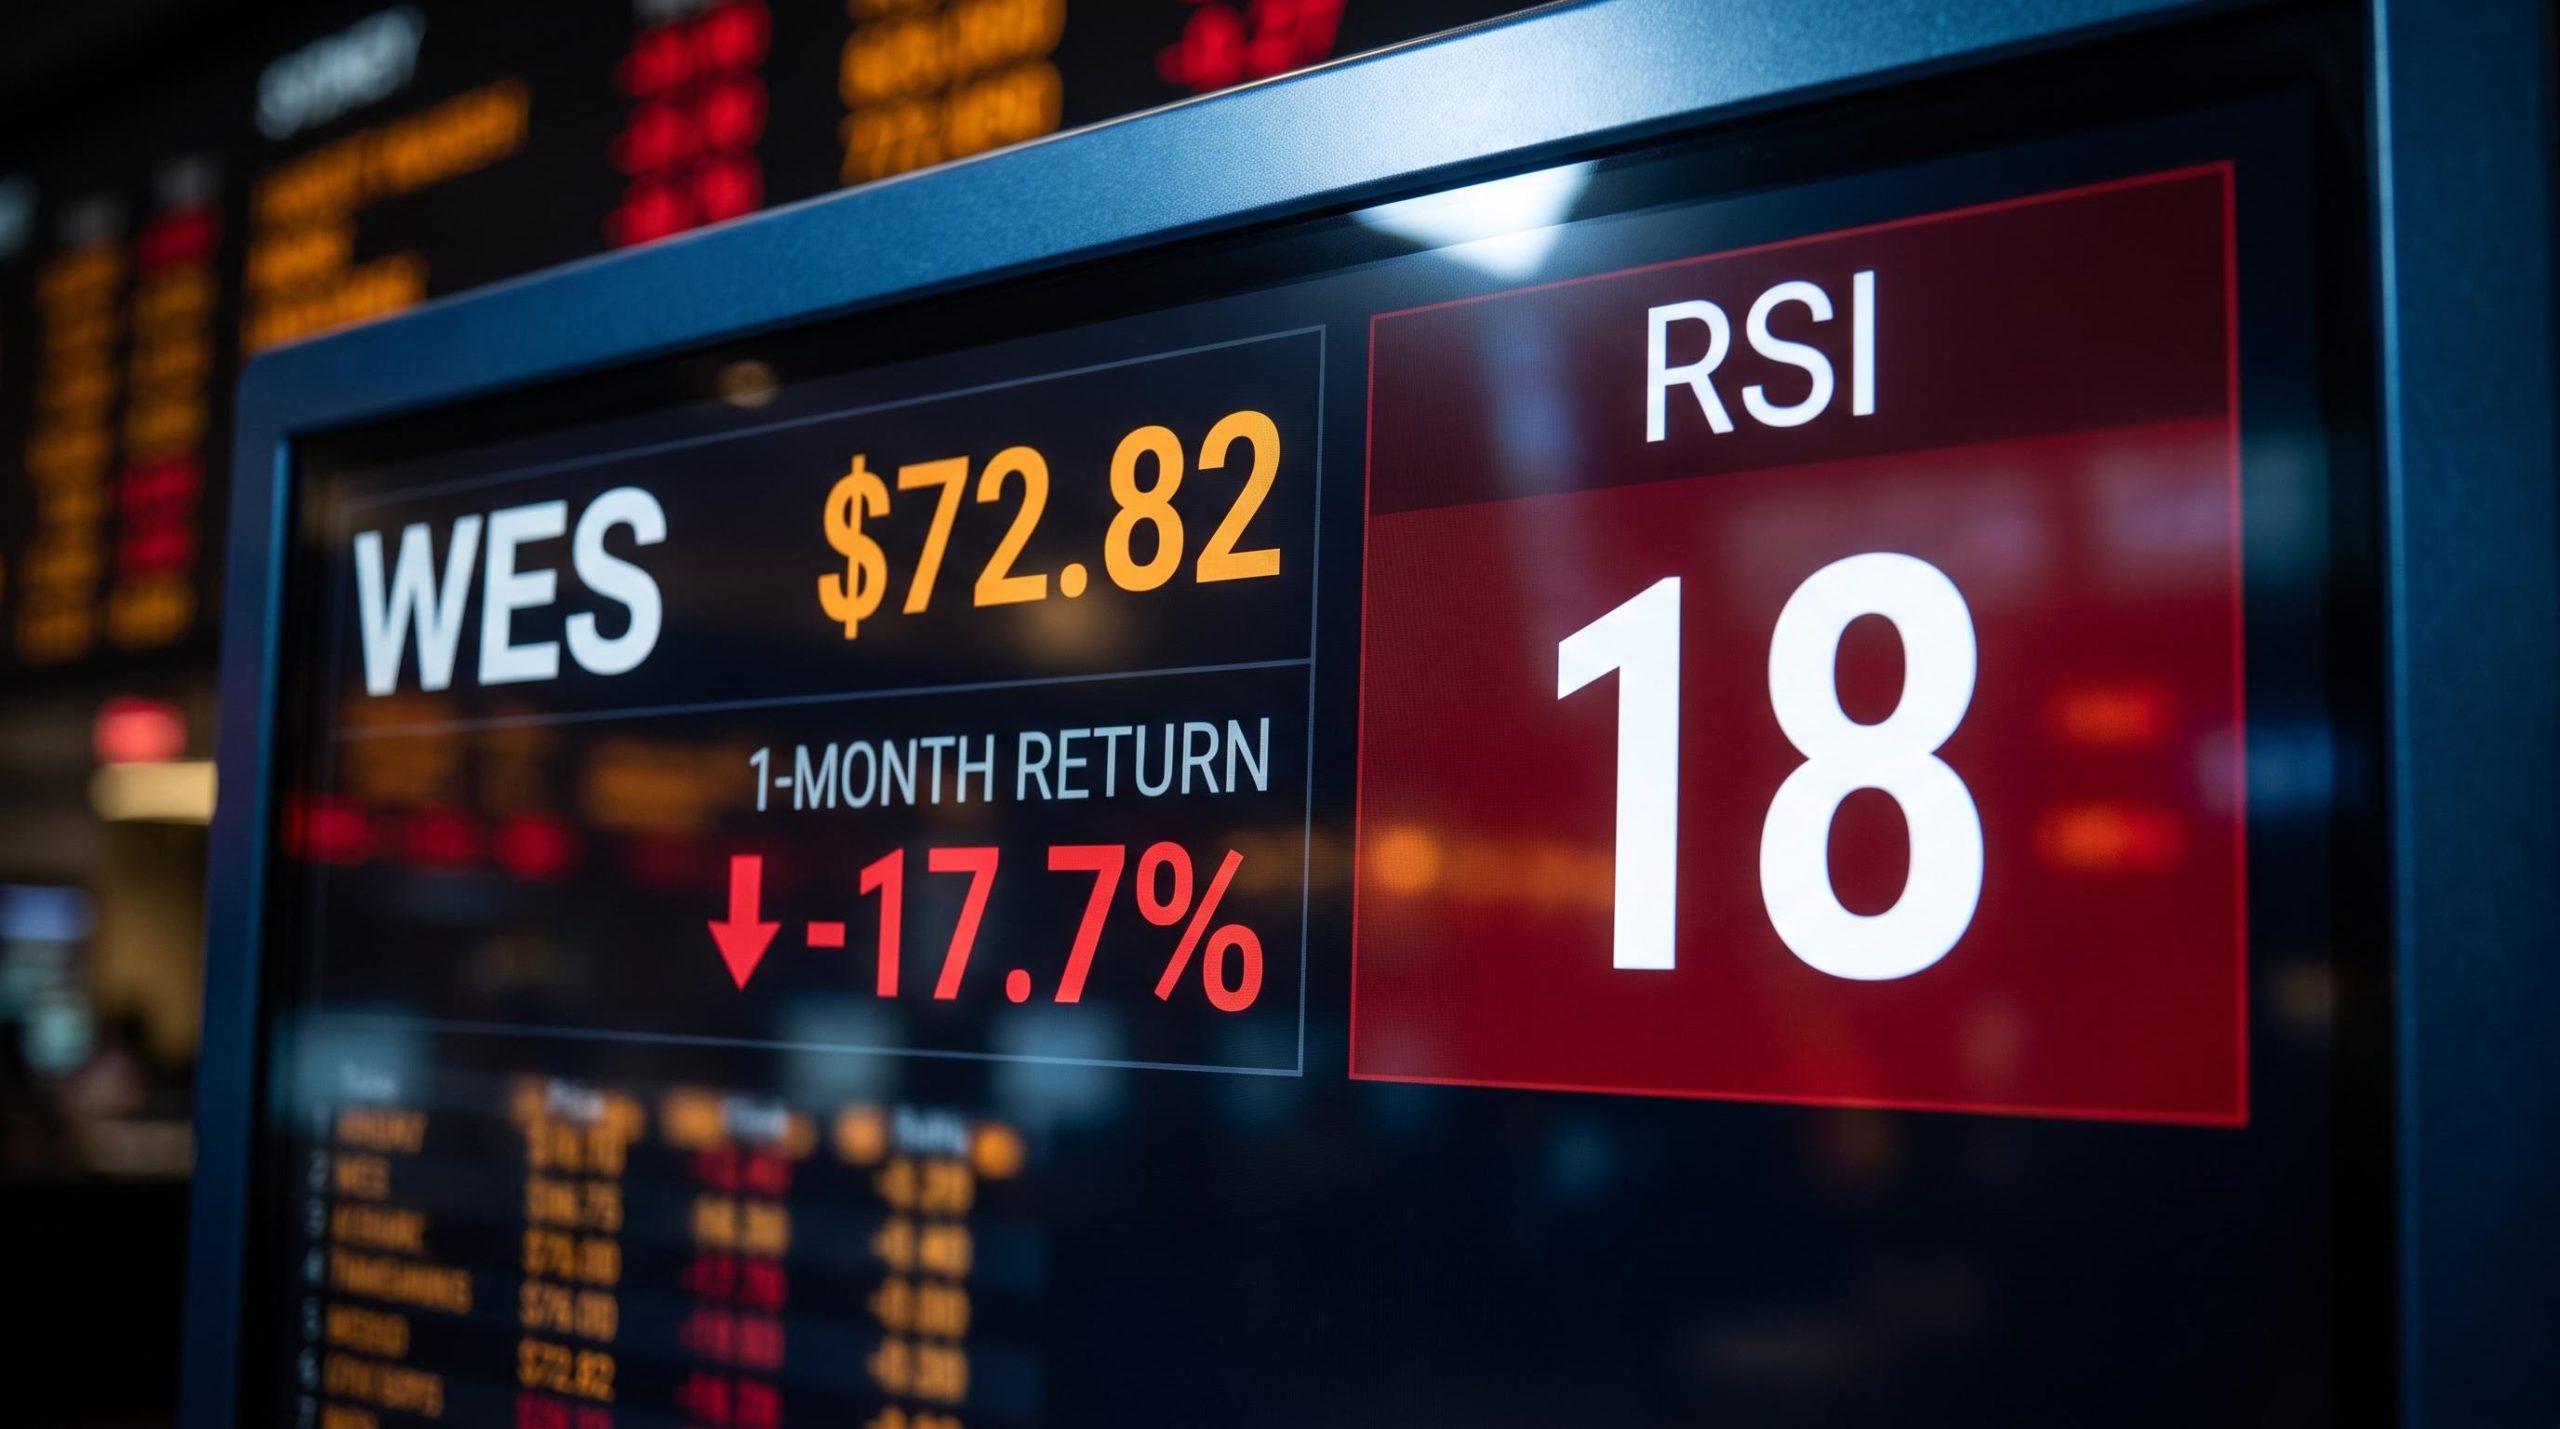
| Wesfarmers (WES) | 18 | $72.82 | -6.3% | -17.7% |
| Aussie Broadband (ABB) | 21 | $4.00 | -3.6% | -18.0% |
| Waypoint REIT (WPR) | 22 | $2.23 | -4.7% | -10.4% |
| Charter Hall Group (CHC) | 22 | $18.12 | -4.6% | -22.4% |
| GQG Partners (GQG) | 23 | $1.10 | -10.3% | -23.4% |
| GPT Group (GPT) | 23 | $4.39 | -4.8% | -15.1% |
| The Lottery Corp (TLC) | 24 | $4.81 | -3.6% | -11.1% |
| Netwealth Group (NWL) | 24 | $19.04 | -6.5% | -21.0% |
| Nine Entertainment (NEC) | 25 | $0.77 | -15.9% | -21.0% |
| Charter Hall Retail REIT (CQR) | 25 | $3.69 | -6.1% | -11.3% |
Wesfarmers tops the list, and its reading is the most analytically provocative on the board.
Wesfarmers RSI of 18 on an in-line result The market is not punishing a missed number. It is repricing the multiple.
Wesfarmers reported an FY26 result with no specific negative surprises, yet it sits at the deepest oversold reading here. The selling reflects a stretched valuation of roughly 30 times earnings, rising RBA hike expectations, a weakening consumer, and elevated oil prices lifting ammonia costs in its chemicals division. That combination tells you the risk is a multiple derating rather than a fundamental earnings problem, which is a very different signal from a company that just disappointed.
The two deepest one-month drawdowns outside property underline how far the selling has spread. GQG Partners is down 23.4% over the month at an RSI of 23, and Nine Entertainment is down 21% at an RSI of 25. Fund managers and media, not just landlords, are caught in this. When financials and media names screen alongside REITs, it points to a broad repricing of anything sensitive to rates or consumer spending rather than an isolated property wobble.
What happened to last week’s oversold list
The most honest test of an oversold signal is not the theory. It is what the previous week’s list actually did.
The result was lopsided. From 4 September to 11 September 2026, two stocks staged notable recoveries while the remaining eight fell an average of minus 4.4%. In a sustained macro headwind, that asymmetry is the clearest evidence that an oversold reading is necessary but not sufficient. The setup was there in each case; the catalyst was the variable that decided the outcome.
The two recoveries in detail
Downer EDI (DOW) rose 3.1%, from $6.37 to $6.57 across 7-8 September. The move was less a fresh bull case than a post-earnings derating, which began after its 20 August result, finally running its course. The selling exhausted itself.
Ingenia Communities (INA) jumped on 7 September 2026 after publicly rejecting a takeover approach from US private-equity firm Warburg Pincus. The unsolicited, conditional and non-binding proposal valued the company at roughly $1.9 billion, or $4.75 per security in cash, and controversially required Ingenia to walk away from its proposed near-$1 billion acquisition of Peet Limited. Ingenia’s independent directors judged the bid to substantially undervalue its housing and holiday-parks portfolio, and Warburg Pincus later abandoned the effort.
The exact share-price gain depends on the source. The original data reported an 8.8% closing gain (from $3.65 to $3.97) with a 14.7% intraday surge, while subsequent research indicates a gain of approximately 13%. Either way, the move was driven by a corporate action, not the RSI.
Both recoveries share a lesson: the trigger was an event no momentum reading could have predicted. The oversold signal found the candidate; something external delivered the return.
The other eight names kept falling:
- Pinnacle Investment Management (PNI): $14.27 to $13.92 (-2.5%)
- Aussie Broadband (ABB): $4.15 to $4.00 (-3.6%)
- Wesfarmers (WES): $77.73 to $72.82 (-6.3%)
- Charter Hall Group (CHC): $19.00 to $18.12 (-4.6%)
- Atlas Arteria (ALX): $4.57 to $4.47 (-2.2%)
- GQG Partners (GQG): $1.22 to $1.10 (-10.2%)
- SGH (SGH): $38.40 to $37.71 (-1.8%)
- The Lottery Corporation (TLC): $4.99 to $4.81 (-3.6%)
Eight declines against two catalyst-driven bounces is the empirical case, in a single week, for treating RSI as a starting point rather than a buy signal.
Nine Entertainment and the limits of the earnings recovery thesis
Nine Entertainment is the sharpest illustration of why oversold does not automatically mean cheap.
The paradox is stark. Nine reported FY26 results that beat expectations across multiple metrics and rose roughly 9.5% on the day, from about $0.975 to $1.068 on 26 August 2026. Yet by 11 September 2026 the stock had slumped to $0.77, capping a 42% decline over 12 months and sitting well below its 52-week high of $1.90.
The underlying numbers were not the problem. FY26 revenue came in at $2.19-2.2 billion (up around 3% on a continuing-business basis), group EBITDA reached roughly $379 million (up 17% year-on-year), and net profit after tax grew 7-11%, led by streaming and digital publishing.
So why did a strong print fail to hold? A cluster of company-specific overhangs is doing the work:
- The sale of its 60% stake in Domain
- A special dividend and return of capital
- A 34% share-price fall on the ex-dividend date (11 September of the prior year)
- Broker target cuts, leaving the average 12-month target near $1.31
- Perceived deal risk around the $850 million acquisition of QMS Media in January 2026
Together, these keep the market focused on earnings quality and capital allocation rather than the headline profit surge.
That tension shows up most clearly in the valuation gap.
Morningstar fair value: $2.20. Current price: $0.77. The market has priced in a deep structural discount, not a temporary dislocation.
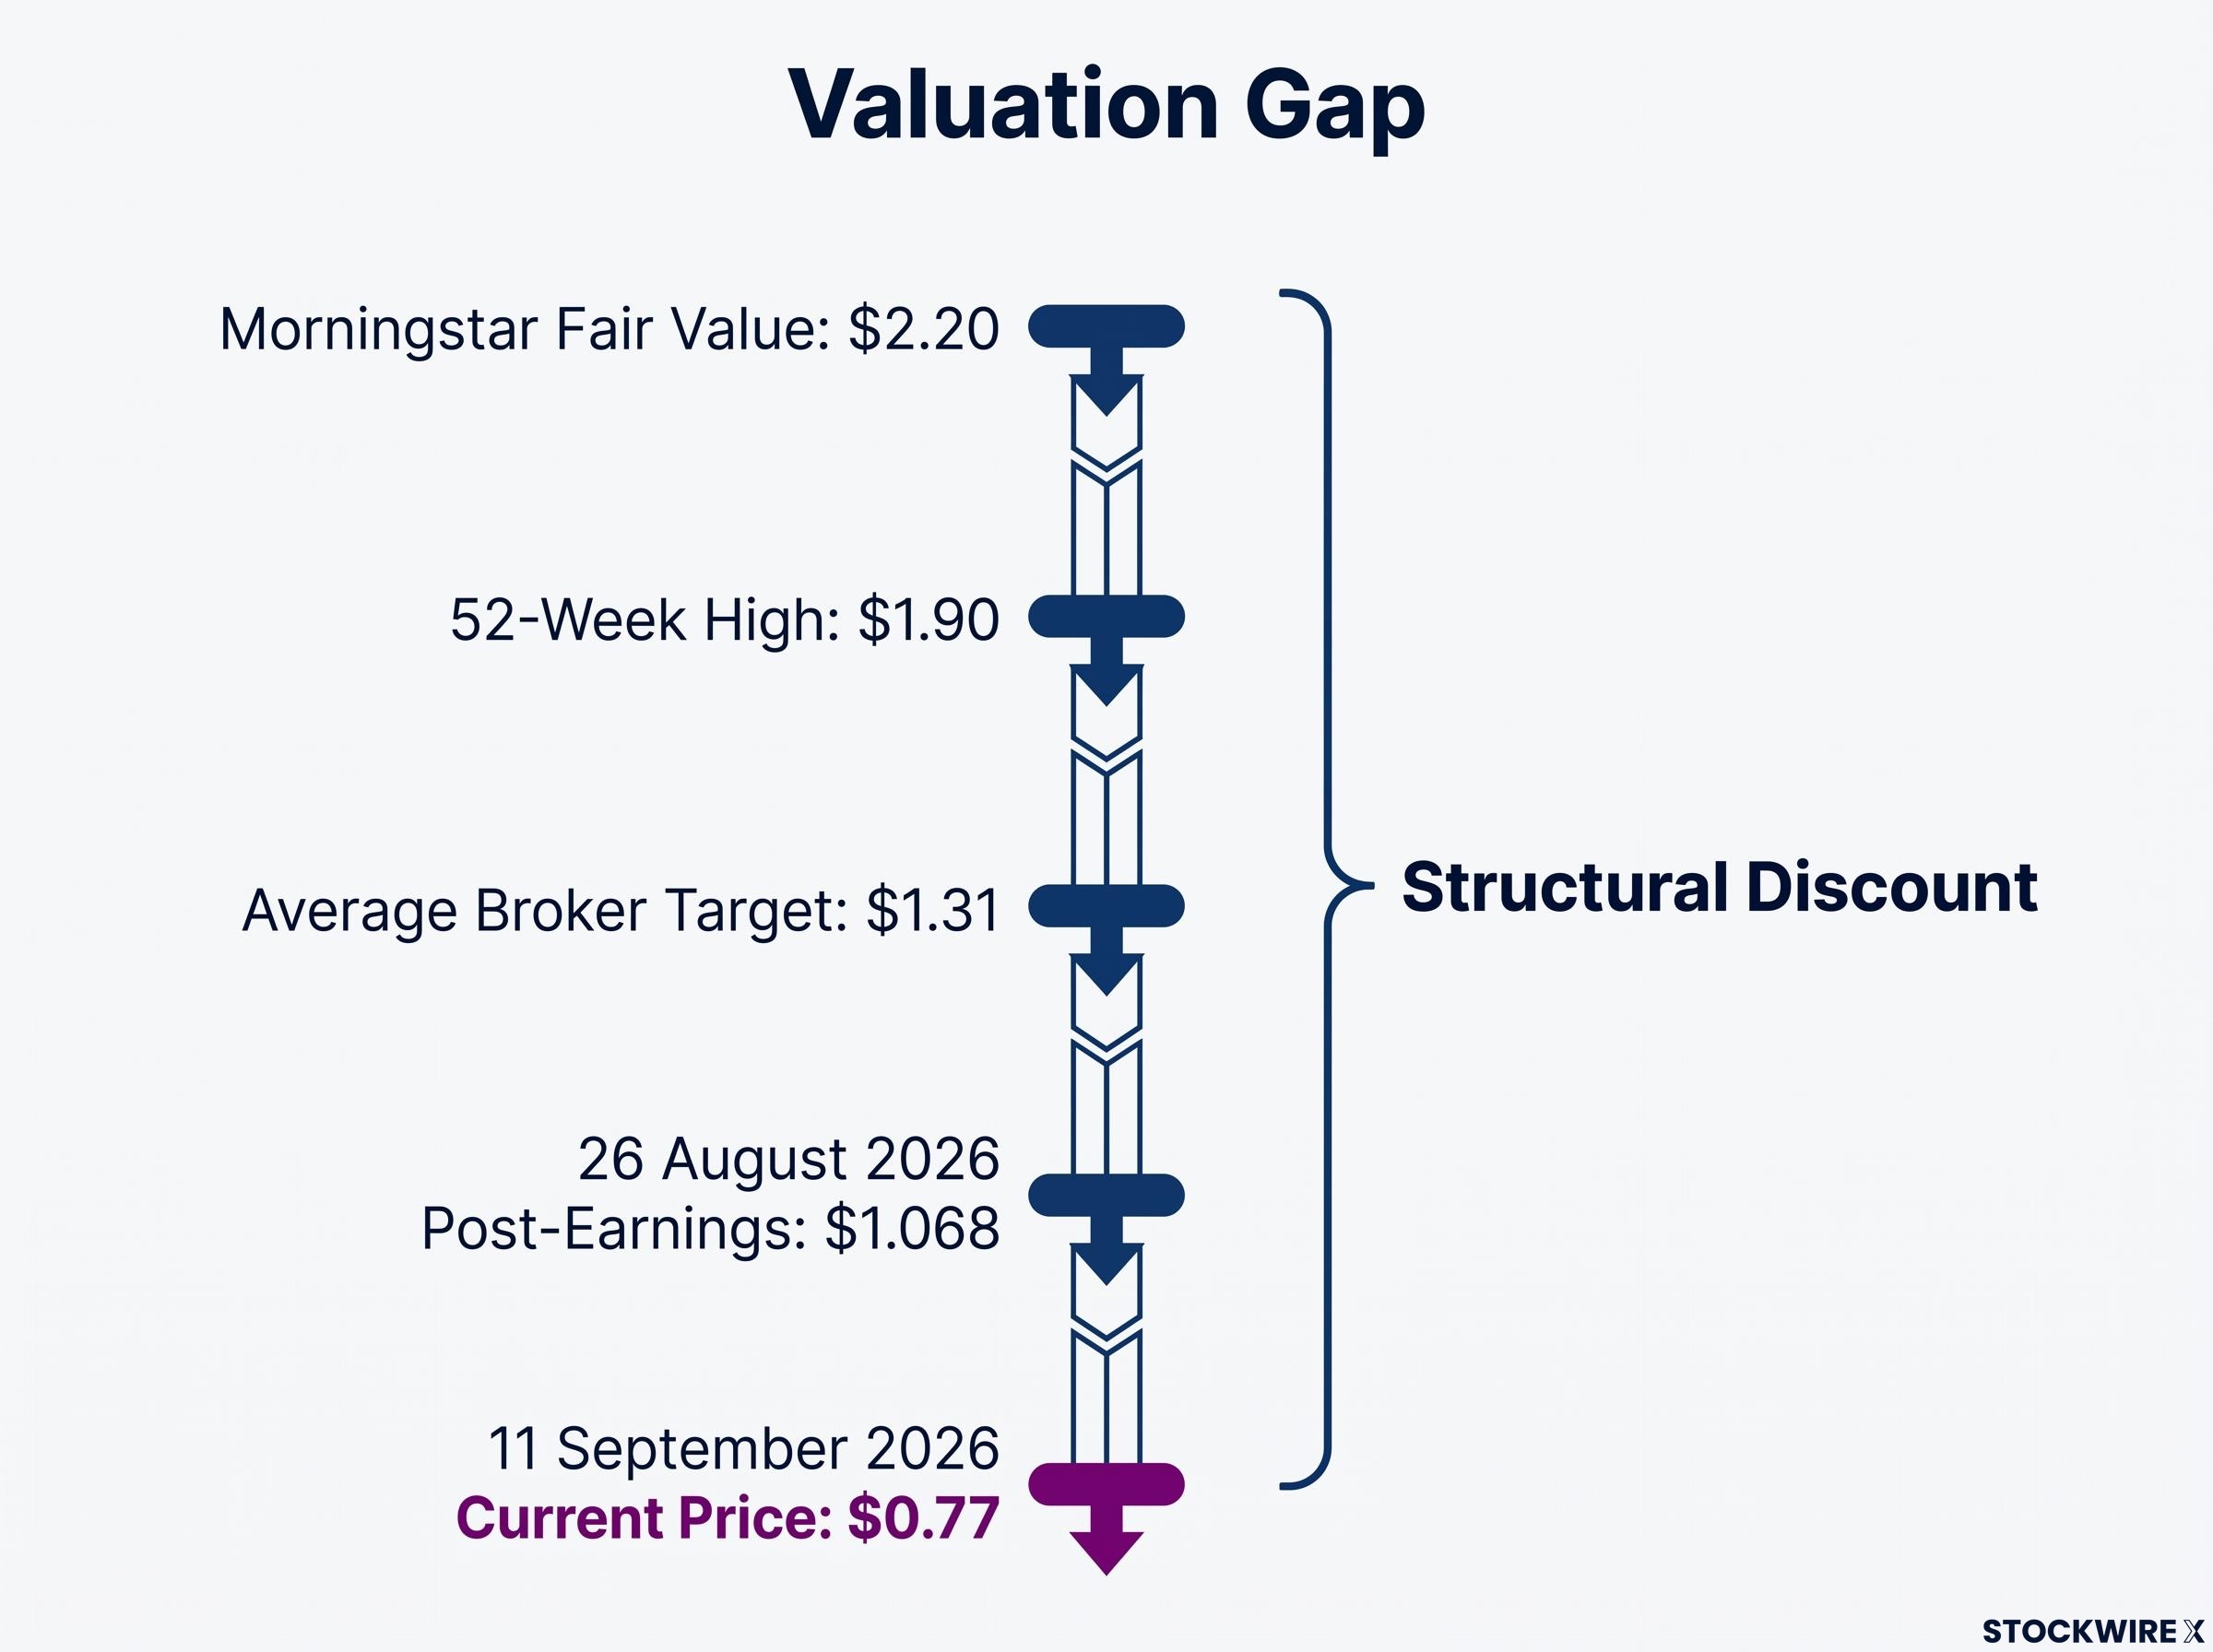
A fair value estimate nearly three times the traded price tells you the market has embedded a substantial discount for earnings-quality and deal-risk concerns. Closing that gap requires sustained confidence in the earnings trajectory and capital allocation, not a single good quarter. Nine is the case where you need to be clear which question you are answering: is the stock technically oversold, or is it fundamentally cheap? Those are not the same thing.
For investors wanting a structured framework to assess whether the names on this list are genuinely cheap or simply falling, our dedicated guide to identifying undervalued stocks walks through the three core screening metrics, including free cash flow yield and debt-to-equity ratios, and explains how to distinguish a value opportunity from a value trap.
Catching a falling knife or timing a turn? What the data actually tells you
Pull the threads together and the picture is consistent. The RBA’s tightening bias and near-recessionary consumer sentiment create a structural headwind that a low RSI reading, on its own, cannot overcome. Last week’s scorecard, two recoveries against eight declines averaging minus 4.4%, is the recent evidence that the signal needs help to become actionable.
The Q1 2026 precedent is the cost of ignoring that. When the A-REIT sector fell 16.5% while the broader market slipped just 1.6%, oversold readings offered no protection. That is what catching a falling knife looks like when technicals run ahead of the macro.
Two variables would genuinely change the calculus on the names covered here:
- A credible RBA pivot. A cut, or clear signalling of one at the 29 September 2026 decision, would lift the cost-of-capital pressure on REITs and give consumer-facing stocks room to re-rate. The September consumer sentiment reading of 84.4 is the demand-side gauge that would need to turn with it.
- A stock-specific catalyst. An earnings re-rating, a corporate action like the Ingenia bid, or a management guidance upgrade can override the macro for an individual name, as Downer and Ingenia both showed.
To be fair to the other side of the debate, some analysts argue the selling in real-estate stocks has become excessive relative to fundamentals. Whether the discount is justified or overdone is a live question, not a settled one, and the evidence supports treating it as such.
Investor sentiment extremes have historically created contrarian setups on the ASX: in the week ending 2 August 2026, Australian investor bullishness fell to the 6th percentile of all recorded readings even as the ASX 200 posted back-to-back all-time highs, a divergence that complicates a straightforward bearish reading of the current selloff.
The nearest-term event that could reset the framing for every name on this list is the 29 September 2026 RBA decision. Treat it as the single most important variable to watch before committing to any of these stocks.
This article is for informational purposes only and should not be considered financial advice. Investors should conduct their own research and consult with financial professionals before making investment decisions. Past performance does not guarantee future results, and financial projections are subject to market conditions and various risk factors.