Most American households have been coached to cancel their streaming services if they want to get ahead. Yet Bureau of Labor Statistics data shows the inflation-adjusted rise in monthly housing costs since 2005 is roughly 4.4 times larger than the entire digital subscription stack an average adult carries today.
That mismatch sits at the centre of a strange contradiction in personal finance for 2026. Housing affordability is the dominant financial stressor facing U.S. households right now, yet the loudest advice in personal finance media keeps pointing people toward subscription audits. Where the money actually goes and where financial attention gets directed have quietly drifted apart.
This is where the housing vs subscription spending debate needs a dollar-magnitude reset. Here is what the numbers reveal about where budget pressure genuinely comes from, and a framework for ranking financial decisions by size rather than by how visible they feel.
The numbers behind the narrative: what 2005 housing costs actually look like in today’s dollars
Start with the conversion, because any comparison across two decades is meaningless without it. Only costs that rose faster than the general price level represent a real loss of purchasing power.
The Bureau of Labor Statistics general price index averaged 195.3 in 2005. The most recent reading, for August 2026, stood at 334.98. Divide one by the other and you get a conversion factor of roughly 1.72: a 2005 dollar is worth about $1.72 in current terms.
Now apply it to housing. In 2005, the median existing single-family home sold for $273,000, carried an average 30-year fixed rate of 5.87%, and with 20% down produced a monthly principal and interest payment near $980. Adjusted forward, that $980 is equivalent to about $1,682 today.
That $1,682 is the honest reference point. It is what a 2005 buyer’s payment would cost in current money.
Against it sits today’s reality. The National Association of Realtors reported a median single-family existing-home price of $434,800 in August 2026, up 1.7% year-over-year, while Freddie Mac put the 30-year fixed average at 6.76% as of 10 September 2026. With 20% down, that works out to roughly $2,170 a month.
The Freddie Mac 6.76% figure used here reflects more than just Fed policy; mortgage rate mechanics are governed primarily by the 10-year Treasury yield and a spread that has recently normalised from its widened 2022-2023 levels, meaning bond markets rather than the Fed set the number that determines today’s $2,170 payment.
Subtract the inflation-adjusted 2005 figure from today’s payment and the real gap lands at $488 a month.
| Year | Median Home Price | 30-Year Rate | Monthly P+I Payment | Inflation-Adjusted Payment |
|---|---|---|---|---|
| 2005 | $273,000 | 5.87% | $980 | $1,682 |
| 2026 | $434,800 | 6.76% | $2,170 | $2,170 |
The obvious pushback is that buyers are simply purchasing more house. The data says otherwise.
Buyers are paying more for less. According to the U.S. Census Bureau’s “Characteristics of New Housing, 2025” (published 1 July 2026), the median floor area of new single-family homes completed in 2025 was 2,142 sq ft, down roughly 2.6% from 2,200 sq ft in 2005.
That closes off the lifestyle-upgrade argument entirely. The $488 gap is not something you elected by buying bigger. It is a structural price increase attached to a slightly smaller home.
When big ASX news breaks, our subscribers know first
What the average American actually spends on subscriptions in 2026
So how large is the category everyone keeps telling you to cut?
CNET’s “2026 State of Subscriptions” survey, published in July 2026, puts the average U.S. adult at $111 a month across all digital subscriptions, or $1,332 a year. That is the highest credible estimate available, which makes it the fairest number to test the housing comparison against.
Other surveys land lower. A Bango consumer survey estimated total spending at $69 across an average of 5.2 services, which shows the range but does not change the direction of the finding.
It also helps to separate what is inside that figure. Streaming video alone accounts for roughly $69 a month for the average subscribing household, according to Deloitte’s 2026 “Digital Media Trends” report. The rest is music, cloud storage, apps, and everything else that moved from zero in 2005 to a recurring line item today.
- Total digital subscriptions: $111 per month (CNET, July 2026)
- Streaming video specifically: $69 per month (Deloitte, 2026)
- Wasted spend on unused services: $21 per month, about $252 per year (CNET)
That $21 in unused subscriptions is real money, and the case for cancelling it is legitimate. A subscription audit recovers something concrete and builds budgeting discipline.
But hold the two figures side by side before drawing conclusions.
The scale ratio. The inflation-adjusted housing cost increase of $488 per month is about 4.4 times the entire $111 subscription stack. Subscriptions make up roughly one-fifth of the combined $599 monthly divergence from 2005; housing accounts for the other four-fifths.
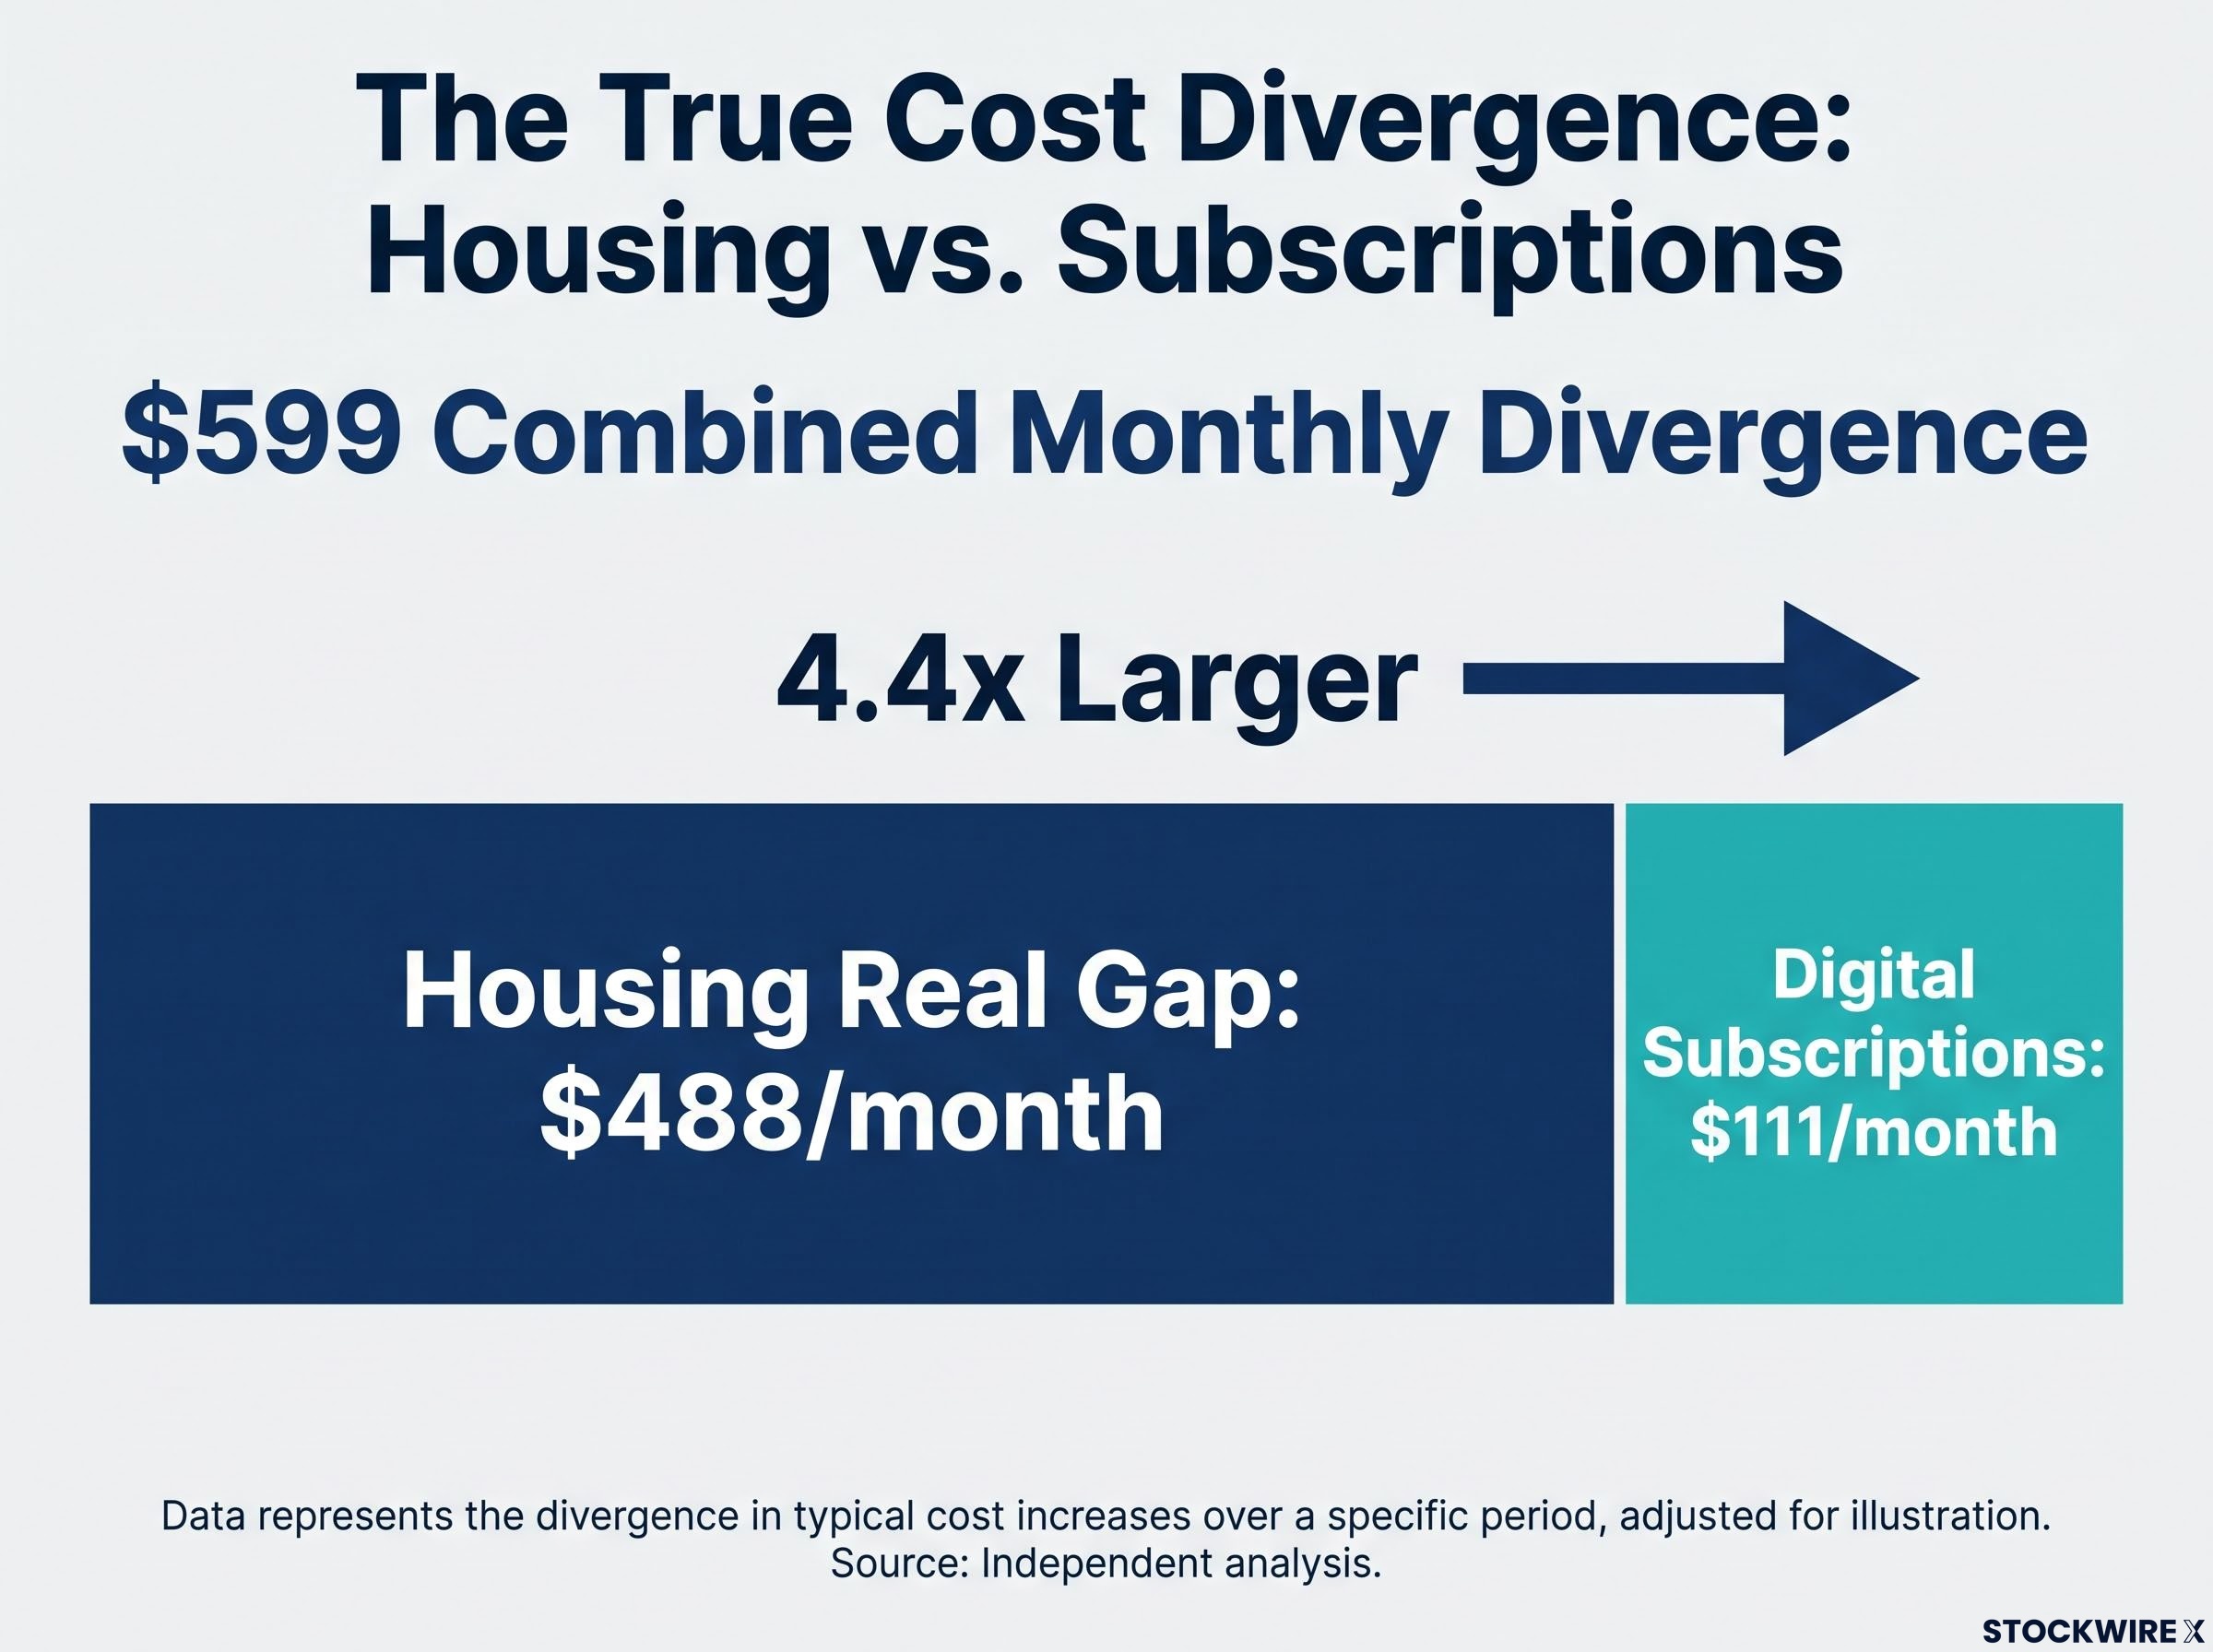
That ratio is the number that reframes the whole conversation. Even a flawless subscription audit only ever addresses the smaller of two problems.
Why housing costs have outpaced inflation since 2005 (and why that will not reverse easily)
Understanding why costs rose matters more than knowing that they did, because the mechanisms behind the rise are self-reinforcing. Four structural drivers do most of the work.
- Supply constraints and zoning. A 2026 Brookings Institution paper identifies deficient new housing supply as the primary driver of worsening affordability, with restrictive land-use rules and slow permitting keeping real house prices growing faster than incomes.
- Mortgage rate lock-in. Homeowners sitting on cheap fixed rates have little incentive to sell, which starves the resale market of inventory.
- Materials and construction costs. Labour, lumber, and concrete have risen faster than the general price level, lifting replacement costs and pulling existing home values up alongside new builds.
- Shelter’s outsized share of inflation. The Dallas Fed notes that housing accounts for 16% of headline PCE inflation and nearly one-third of CPI, making shelter the single largest component of measured inflation rather than a side effect.
Construction cost pressures from lumber tariffs add another layer to the supply constraint story: combined duties of approximately 45% added around $10,900 to the build cost of a typical new single-family home in 2025-2026, reinforcing the upward pull on existing home prices that slower new supply has already created.
How the rate lock-in effect removed 1.33 million homes from the market
The lock-in dynamic is the mechanism most readers will not have met before, and it reframes high prices as a documented market friction rather than a vague macro force.
FHFA data from 2025 quantifies it precisely: for every percentage point the prevailing market rate sits above a borrower’s original rate, the probability of that home selling drops 18.1%. Owners who locked in cheap money stay put.
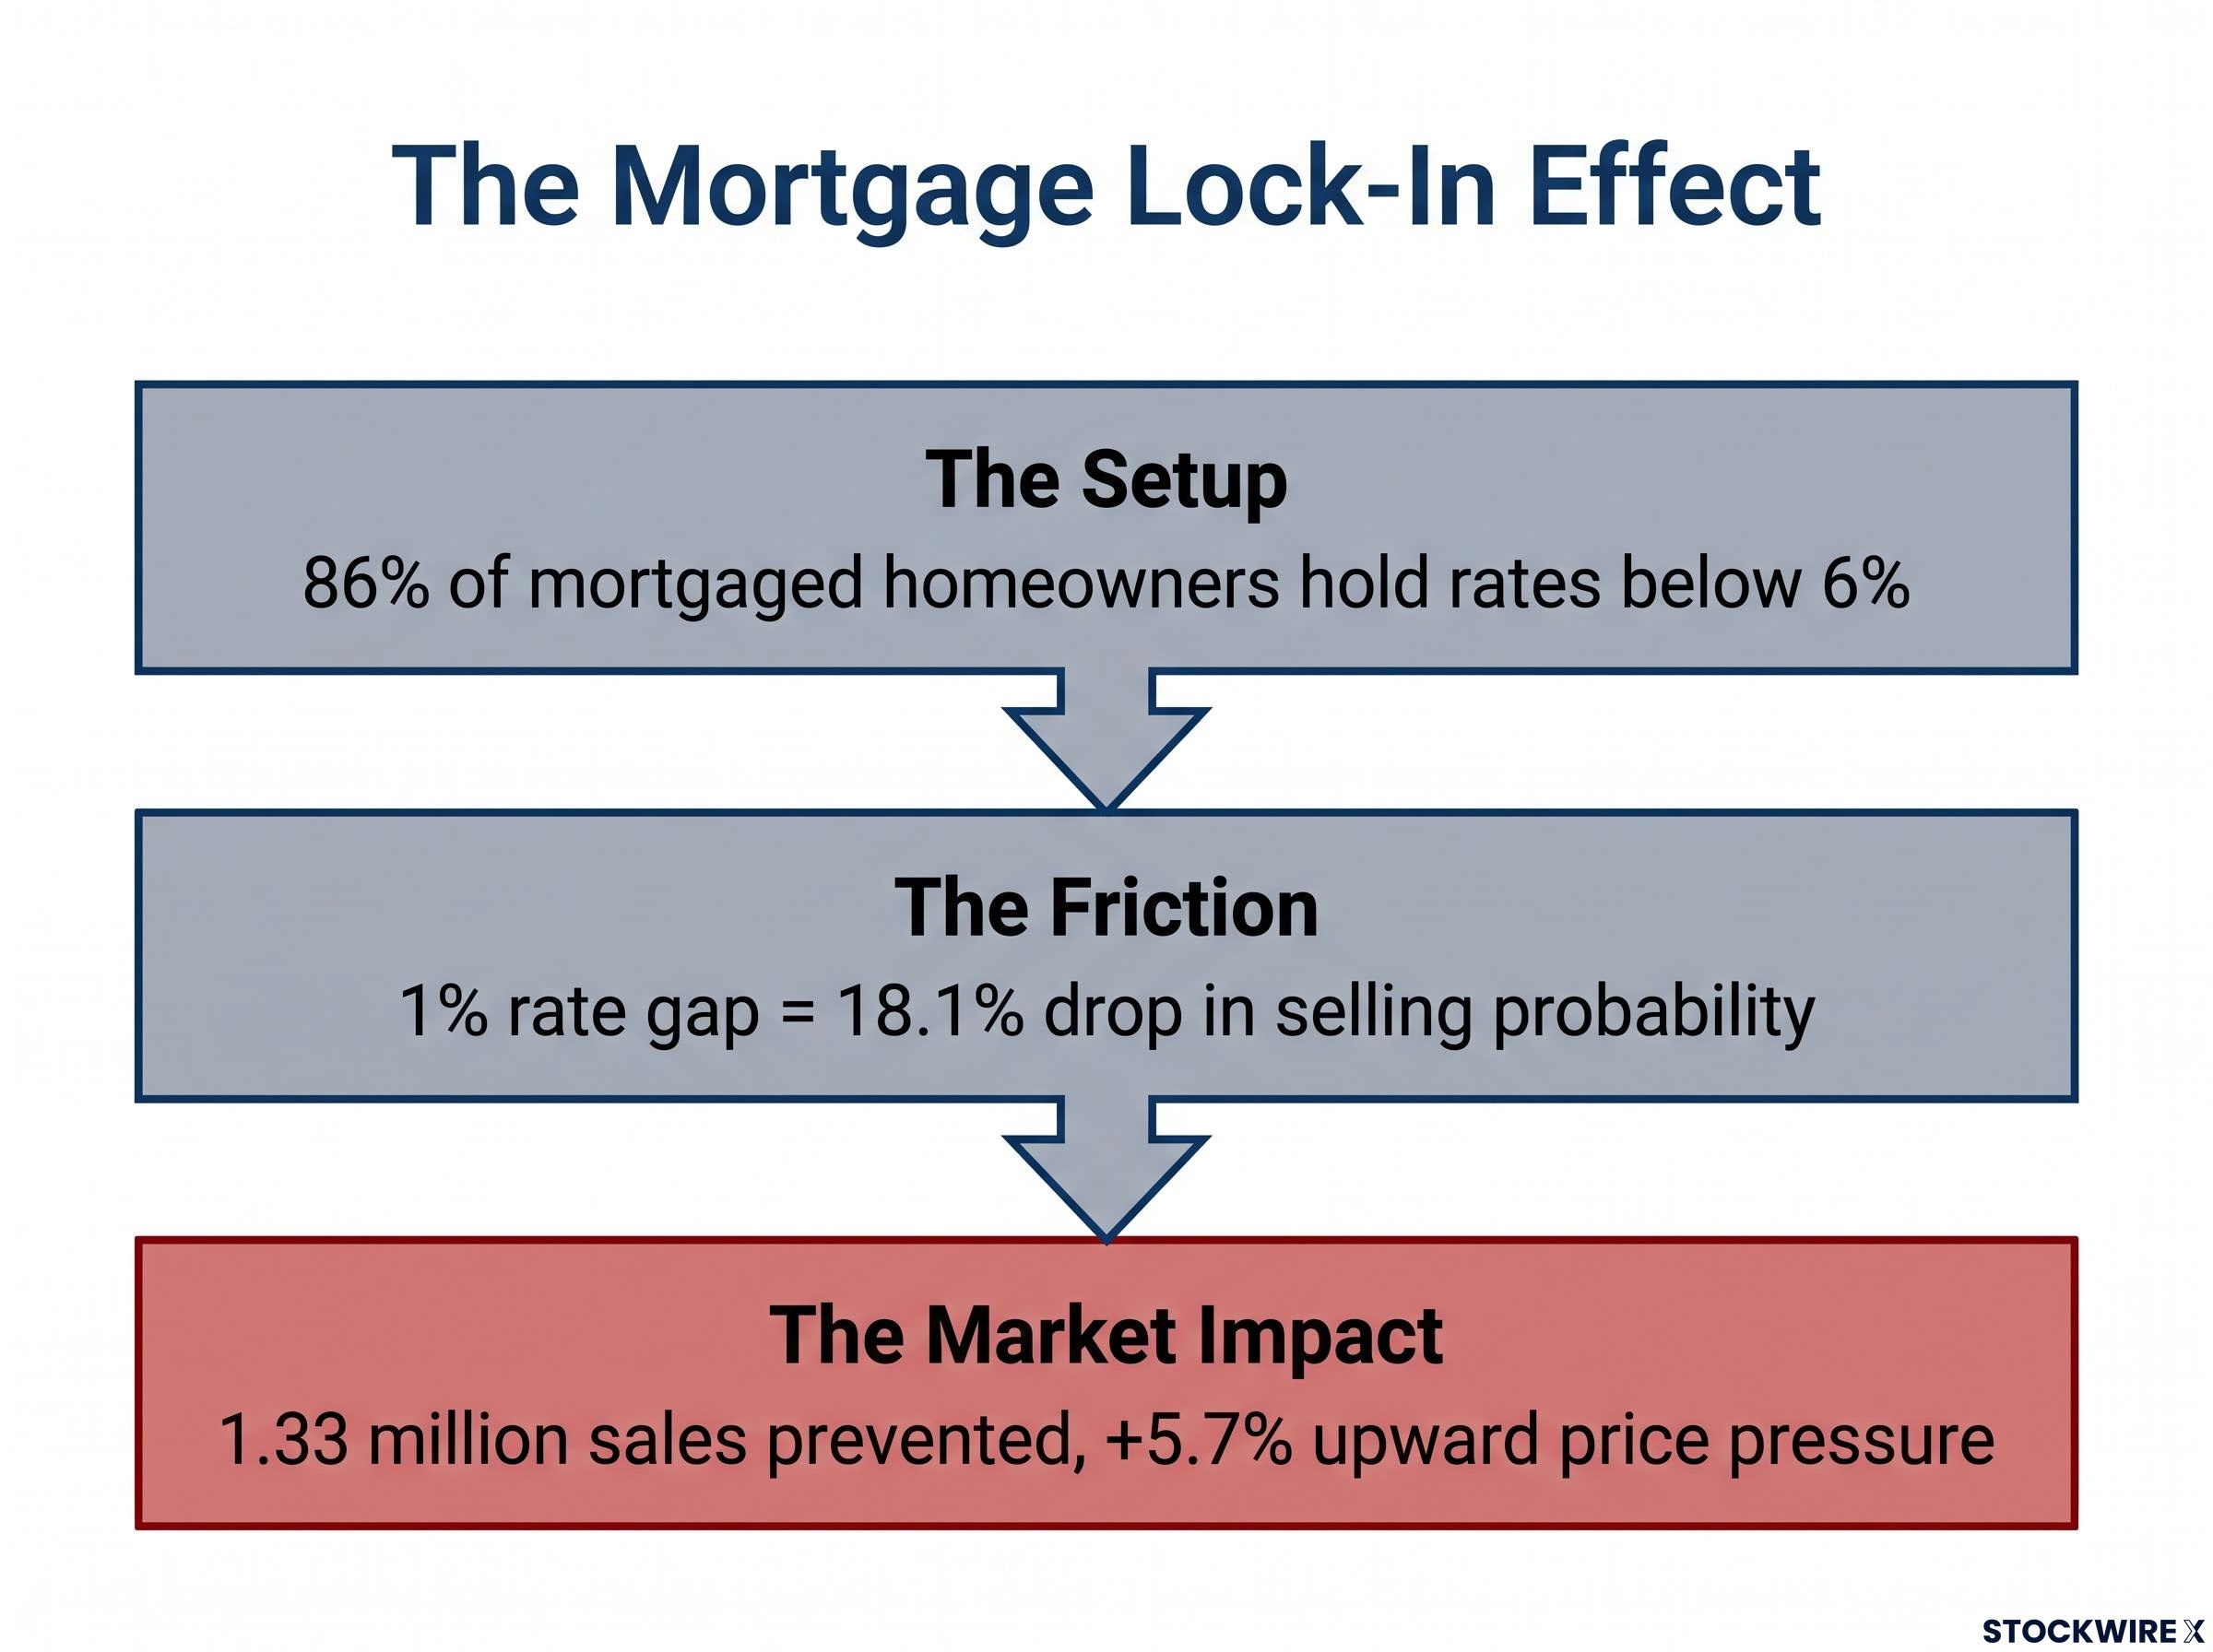
That behaviour prevented roughly 1.33 million home sales between mid-2022 and late-2023. The resulting supply squeeze pushed prices up an estimated 5.7%, offsetting the downward pressure high rates would normally exert.
Redfin data from 2024 shows why this persists: 86% of mortgaged homeowners hold rates below 6%. Until that gap closes, resale inventory stays structurally tight, and the relief valve that would normally cool prices stays shut.
This is the detail that tells you the problem will not dissolve on its own as rates drift down. The friction is baked into millions of individual mortgage decisions.
One important boundary applies. The $488 gap belongs specifically to buyers entering the market at current prices. Existing owners with pre-rate-rise mortgages are largely shielded from it, while renters face a separate trajectory entirely, with rent CPI up roughly 54% cumulatively from January 2015 to May 2025, averaging about 5.4% a year.
A prioritisation framework built on dollar magnitude, not emotional visibility
Knowing the mechanics is one thing. Turning them into a decision rule is what actually changes your finances.
Two behavioural errors keep households from doing that, both rooted in what behavioural economist Dan Ariely describes as mental accounting and payment depreciation, the tendency to undervalue recurring costs.
The Fixed-Cost Error treats every living cost as non-negotiable. Because this person never separates chosen costs from externally priced structural ones, the largest line items escape scrutiny entirely, which is precisely why they stay the largest.
The Subscription-Focus Error is the opposite trap. This person correctly identifies subscriptions as controllable, audits them thoroughly, then treats the financial review as finished, never once examining the housing layer that dwarfs it.
The fix is a single rule: rank costs by dollar magnitude first, then by how much of each you can actually change.
- Step one: List every recurring cost by dollar size, largest first.
- Step two: Separate structural costs from elected ones.
- Step three: Audit the elected costs in order of magnitude, not emotional salience.
The $488 housing gap belongs at the top of that list even when it feels immovable, because decisions around buying versus renting, location, home size, and timing remain genuinely open for many households.
The opportunity cost makes the point concrete. The combined $599 monthly divergence, invested at 7% annually for 10 years, would grow to roughly $103,653.
Compounding growth is what makes the opportunity cost figure so striking: the $599 monthly gap invested at 7% does not grow linearly but accelerates, with the bulk of the $103,653 terminal value accruing in the back half of the 10-year window as gains begin generating gains of their own.
$103,653. That is the projected 10-year value of the combined $599 monthly gap at a 7% annual return. A subscription audit alone, at its realistic ceiling, recovers $252 a year.
| Cost Category | Monthly Amount | Annual Amount | 10-Year Opportunity Cost (7%) |
|---|---|---|---|
| Housing cost gap | $488 | $5,856 | Majority of the total |
| Total subscriptions | $111 | $1,332 | Roughly one-fifth |
| Combined | $599 | $7,188 | $103,653 |
Set the $103,653 against the $252 a subscription audit realistically recovers, and the argument for magnitude-first thinking stops being abstract advice.
Past performance does not guarantee future results, and this projection is a scenario, not a promise. Financial projections are subject to market conditions and various risk factors.
What the $488 gap actually changes about how you should approach your finances in 2026
The structural forces here are real and will not reverse quickly. What changes is the lens you bring to your own budget.
Millions of households are already adapting rationally to these pressures. The national homeownership rate has stalled at around 65.0% to 65.6% in Q2 2026, with under-35 ownership at multiyear lows. Multigenerational living has climbed to roughly 4.5% of owner-occupied households, with the share more than doubling over recent decades.
Asset price inflation compounds the housing gap in ways the monthly payment figure alone does not capture: the same equity and property appreciation that inflated home prices toward $434,800 also concentrated gains among existing owners, widening the entry-point penalty for younger households who missed the pre-2020 ownership window.
Buyers are trading space for affordability too, which is exactly what the 2,142 sq ft median floor plan of homes completed in 2025 reflects. None of this reads as individual failure. It reads as a systemic condition that calls for systemic analysis, not micro-optimisation of a $111 category.
That reframing matters regardless of your tenure. The subscription audit is worth doing: it recovers about $252 a year in wasted spend and reinforces good budgeting habits. But it is a finishing move on a financial review, not a substitute for examining your largest cost.
The questions worth asking shift accordingly:
- What is my housing cost per month in real, inflation-adjusted terms?
- Is that dollar magnitude the best allocation of my money given my current circumstances?
- Which of my largest recurring costs are structural, and which are actually within my control?
This article is for informational purposes only and should not be considered financial advice. Investors should conduct their own research and consult with financial professionals before making investment decisions.
The read to take away is simple. The cost that hides in plain sight, dismissed as fixed and unexamined, is the one carrying 4.4 times the weight of the one everyone tells you to cancel. Sort your budget by size before you sort it by feeling.