Most investors treat a sudden surge in the yen the same way. They assume Tokyo has stepped into the market, or that a global carry trade is blowing up. Usually, one of those two stories is right.
This time, neither is.
Over roughly ten days in early September 2026, USD/JPY fell from around 160.18 on 1 September to approximately 153.6 by 9 September, a decline of close to 4%. On US Labor Day, the pair lost around one and a half yen in a single 40-minute window near 154.00, its lowest level in about six months. Yet the usual fingerprints were missing. Japan’s Ministry of Finance never showed up, and speculative traders were actually adding to their bets against the yen, not fleeing them.
That combination matters because misreading it is expensive. If you treat a routine repricing of borrowing costs as the start of a global financial crisis, you sell good assets into a panic that never comes.
What follows here is a clear framework for telling the difference between a currency simply recalibrating its funding costs and a dangerous, self-reinforcing deleveraging event. Get it right, and you know when to sit still.
The silent slide in USD/JPY and the missing Ministry of Finance
Start with the mystery. A currency pair drops 4% in ten days, punches through a six-month low, and does so partly in a 40-minute stretch on a US holiday. The obvious answer is intervention.
Holiday sessions are exactly when Japan tends to strike. Thin liquidity means every yen of official buying moves the price further, giving the Ministry of Finance more impact for less money. So the setup was perfect. And nothing happened.
Bank of Japan daily account data confirmed no official yen-buying was behind the 2 September surge, and no official in Tokyo or Washington claimed responsibility for the Labor Day move. The character of the move tells you why. Past interventions shifted the pair several yen within minutes; this one unfolded gradually, with no attribution and no follow-through.
“The absence of Ministry of Finance flows combined with a rapid repricing of Bank of Japan hike odds points to rising yen funding costs, not policy action in the currency market, driving the rally,” said CIBC strategist Jeremy Stretch, whose reading framed the move as market-driven rather than intervention-led.
There is a useful benchmark for scale. The most recent verified official operation saw Japan deploy approximately 15.4 trillion yen (around $98 billion) in yen purchases across a period running from 30 July to 26 August 2026, at a time when the currency had weakened to four-decade lows. That leaves an unmistakable signature. September’s slide had none of it.
Then comes the detail that flips the whole story. Speculators were not running for the exits. According to the Commodity Futures Trading Commission (CFTC), non-commercial net short positions in yen futures grew by 28,900 contracts to reach 92,200 in the week ending 1 September 2026, marking the steepest one-week increase recorded in that report.
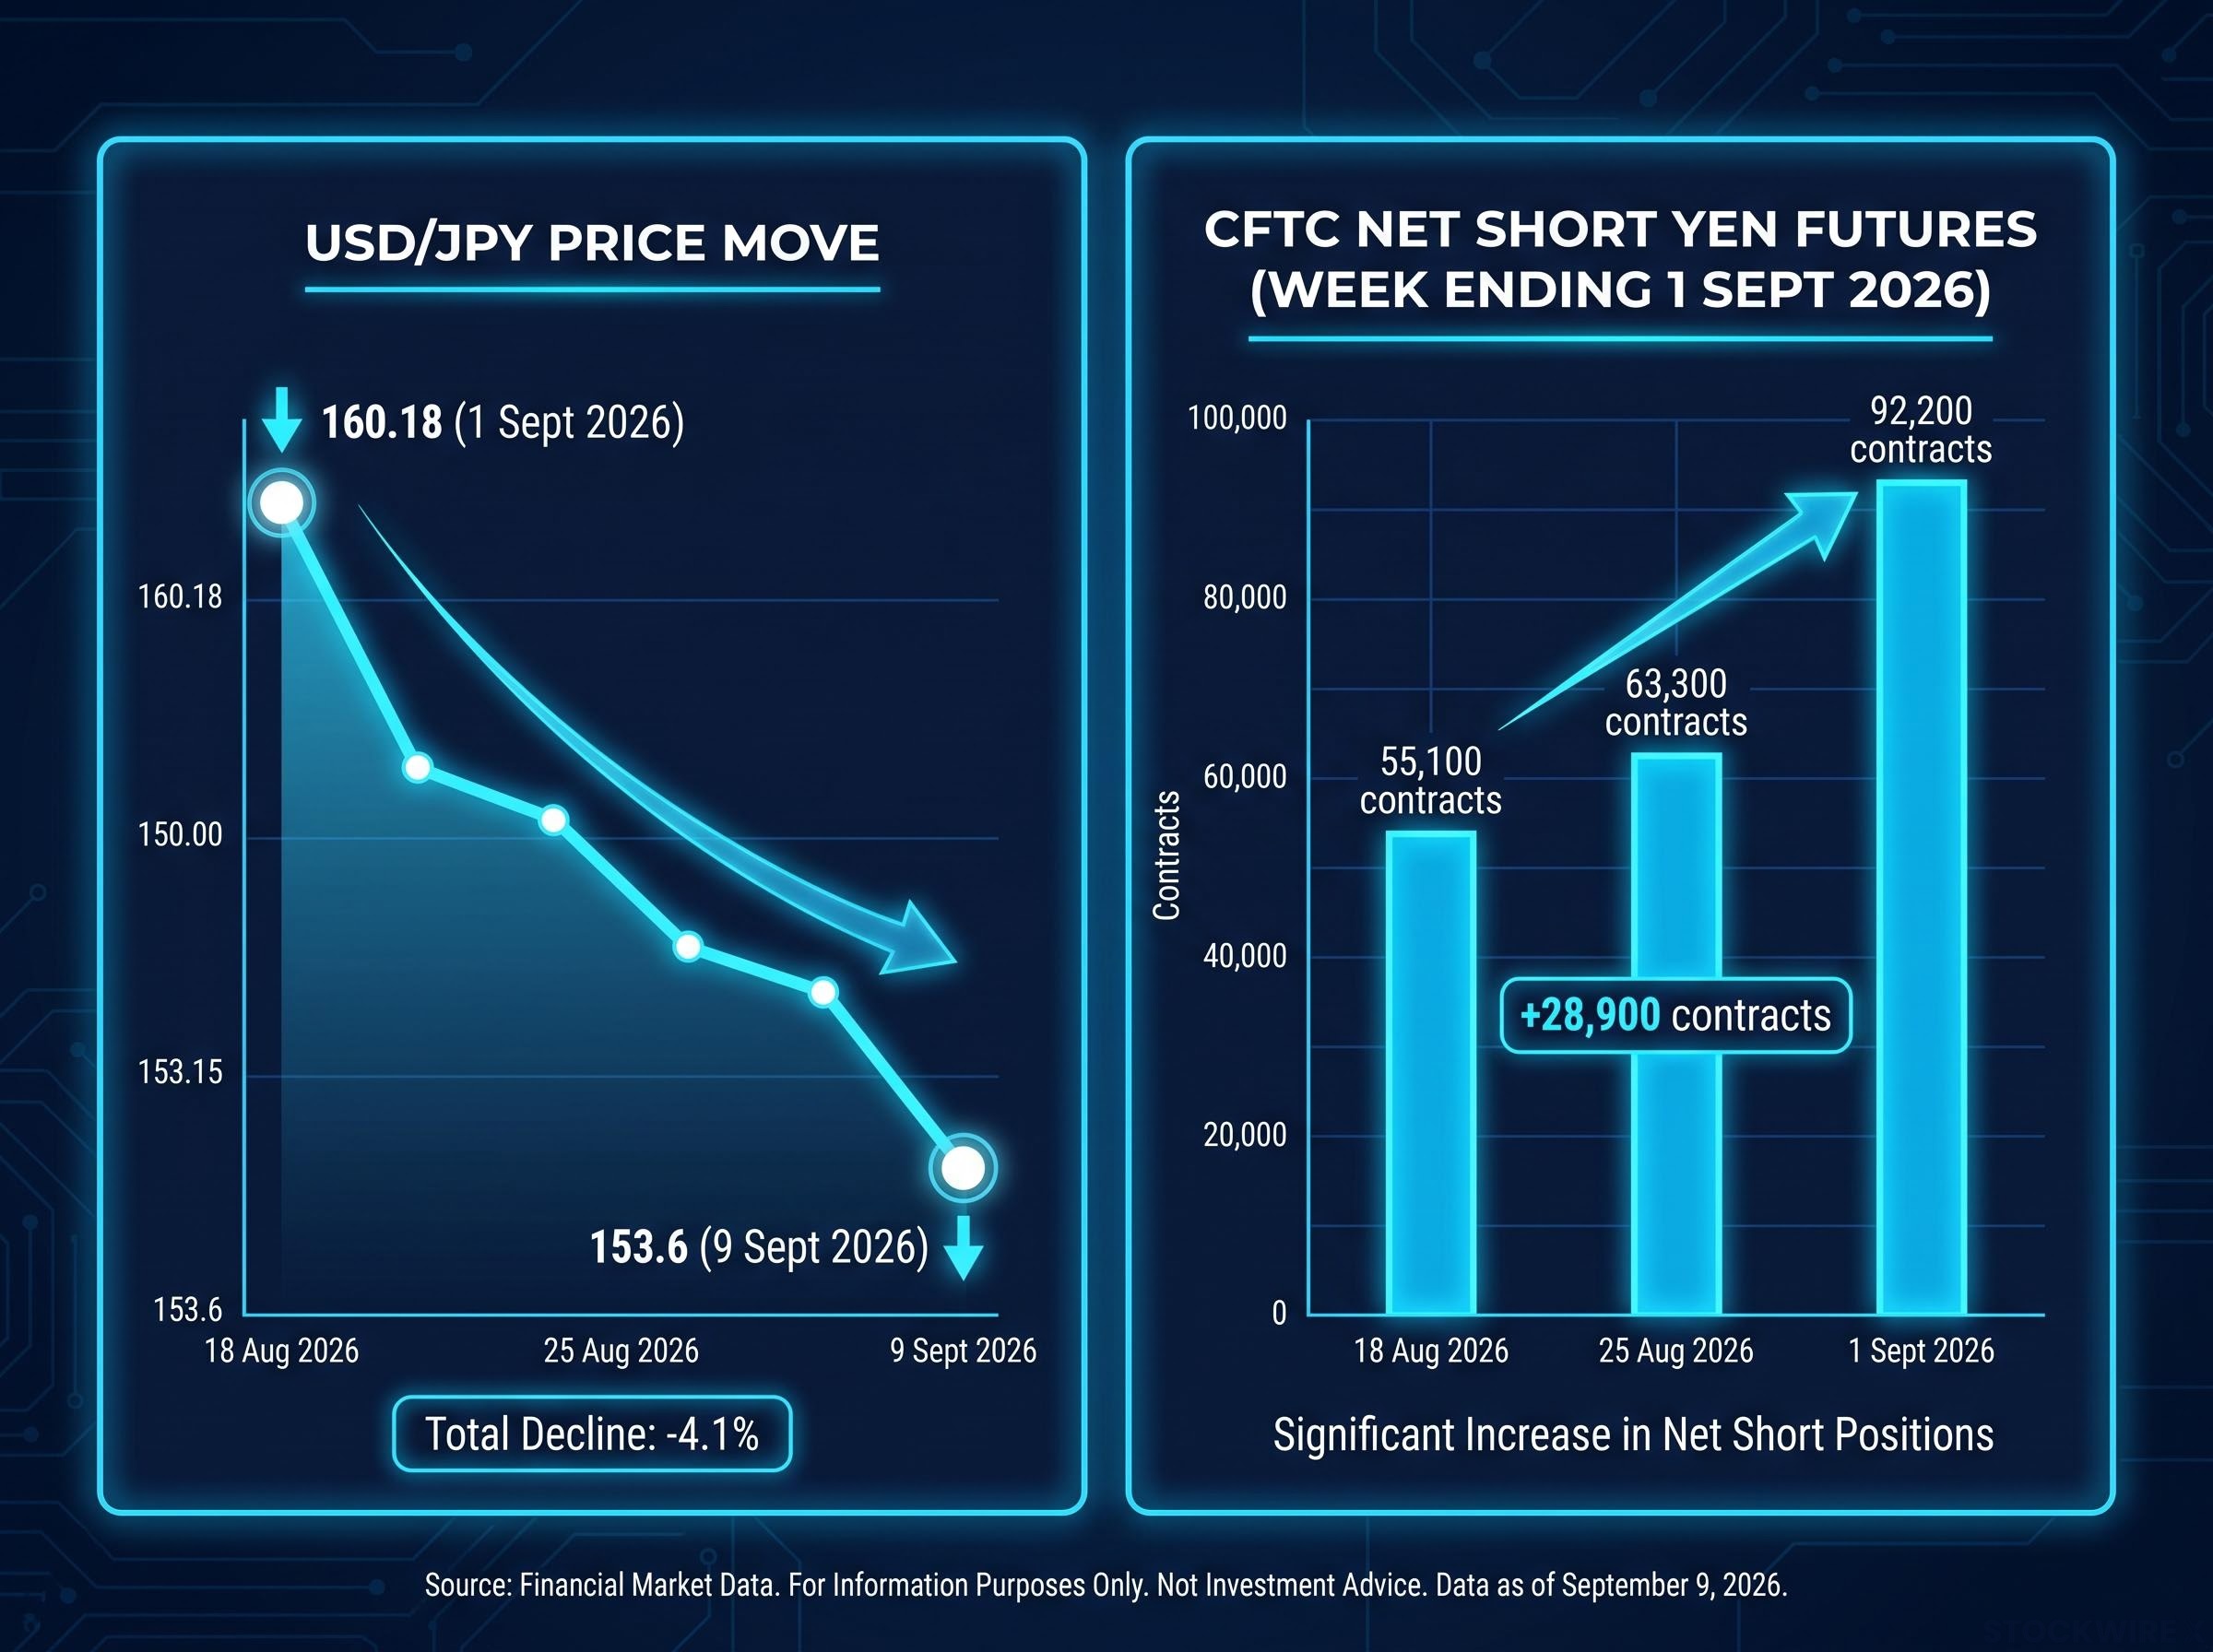
Traders were pressing their short-yen bets harder right before the currency strengthened.
That is the opposite of a panic. In a forced liquidation, those shorts collapse as traders scramble to buy yen back. Here they grew. For you, that distinction lowers the odds of immediate contagion sharply, because sharp moves driven purely by shifting interest rate expectations behave very differently from moves driven by forced selling.
When big ASX news breaks, our subscribers know first
What separates funding cost repricing from a systemic liquidation
To make sense of any of this, you need the underlying trade. A yen carry trade is simple at its core: you borrow yen cheaply, because Japanese interest rates have been extraordinarily low for years, and use that money to buy higher-yielding assets elsewhere. You pocket the gap between the two.
The yen carry trade mechanics that make this funding strategy so persistent rest on a spread that remains wide even after the Bank of Japan’s rate increases, with borrowing costs in yen still running roughly 2.5 percentage points below equivalent dollar rates.
The whole strategy depends on one assumption staying true: that borrowing yen stays cheap. When markets start to doubt that, two very different things can happen, and telling them apart is the entire game.
The first is a repricing. This is a forward-looking adjustment. Traders see rising odds that the Bank of Japan will hike rates, so they update their models for what funding will cost in future. The yen strengthens because holding short-yen positions is becoming more expensive to justify, but nobody is being forced to do anything. It is a recalculation, not a stampede.
The second is an unwind. This is chaotic and self-reinforcing. As the yen jumps, carry positions lose money, margin calls arrive, and traders are forced to sell the assets they bought with borrowed yen to raise cash. Those sales push prices lower, triggering more margin calls, which forces more selling. The loop feeds itself.
The gap between the two currencies is still wide, which is what keeps the trade attractive. The 1y1y OIS differential, a measure of where markets expect one-year interest rates to sit a year from now, has Japan near 1.9% against the US at roughly 4.1%. Markets are pricing that gap to narrow, not vanish.
Navaratnas’ “9 Signals” framework is a useful way to keep the two environments separate. A genuine unwind shows up as a hawkish Bank of Japan shift, a spike in long-end Japanese government bond yields, a reversal of those extreme short-yen positions, stress in the cross-currency basis, and acute risk-off moves in global equities with volatility surging. A repricing shows rising yields and expectations without the credit stress, the position dumping, or the volatility spike.
| Metric | Repricing | Liquidation | What you watch |
|---|---|---|---|
| Currency volatility | Elevated but orderly | Violent, gapping moves | Speed and size of swings |
| Equity impact | Limited, contained | Broad, correlated selloffs | Global index behaviour |
| Credit spreads | Stable | Widening sharply | Corporate borrowing costs |
| VIX levels | Low to moderate | Spikes above 25 | Equity fear gauge |
The practical takeaway is this: you diagnose which environment you are in by watching the assets you actually hold, not by staring at the funding currency chart. If your equities and credit are calm, the funding pair can move all it likes.
Why gold and the Australian dollar disprove the panic narrative
Theory is fine, but you want a live lie detector. Cross-asset behaviour is that detector, and right now it is telling a clear story.
In a genuine deleveraging event, everything correlated to risk gets crushed at once. Traders need cash, so they sell high-beta currencies, dump commodities, and bail out of anything that moved with the carry trade. Safe-haven demand and cash hoarding dominate. That is the pattern to fear.
It is not the pattern showing up. Gold was holding firm near $4,400 per ounce in early September 2026, sitting close to its highs rather than being liquidated for cash. AUD/USD, a classic risk-sensitive currency, was trading near 0.7225, around its strongest level since mid-May, even as the yen surged.
Those two facts do not fit a crash. A commodity currency near multi-month highs and gold near record territory tell you liquidity is not draining out of the system.
The stress markers that define a true unwind are conspicuously missing:
- No correlated selloff across global equities
- No VIX spike toward the high-20s that accompanies real risk-off events
- No collapse in high-beta or commodity currencies like the Australian dollar
- No sharp widening in credit spreads
- No cross-asset correlations lurching toward 1.0, the reading typical of a broad crash
Put together, this specific combination of a falling USD/JPY alongside stable risk assets confirms a localised interest rate adjustment, not a global scramble for safety.
For you, that resilience is permission to stay calm. When these particular charts hold their ground while one funding pair recalibrates, you do not need to rush to cash. And you now know exactly which screens to check the next time a currency move sets off alarm bells.
The August 2024 benchmark and the anatomy of a true crash
If you want to know what a real unwind feels like, you do not have to imagine it. August 2024 delivered one, and it was violent.
The trigger was a collision. A Bank of Japan rate decision on 31 July 2024 met a far weaker-than-expected US jobs report on 2 August 2024, and a crowded short-yen carry book cracked under the combined pressure. The sequence ran like this:
- The Bank of Japan delivered a surprise 15-basis-point hike with hawkish guidance, catching a heavily positioned market off guard.
- Weak US non-farm payrolls landed days later, stoking recession fears and sending traders rushing to close yen-funded positions.
- USD/JPY collapsed from around 162 in early July toward below 142, roughly a 12% drop, with the bulk concentrated in a few days.
- Japanese equities went into freefall, with the Nikkei crashing 12.4% on 5 August 2024, its worst single day since 1987.
- Volatility exploded globally, the S&P 500 suffered its worst two-day stretch in years, and most of the damage reversed within about a week.
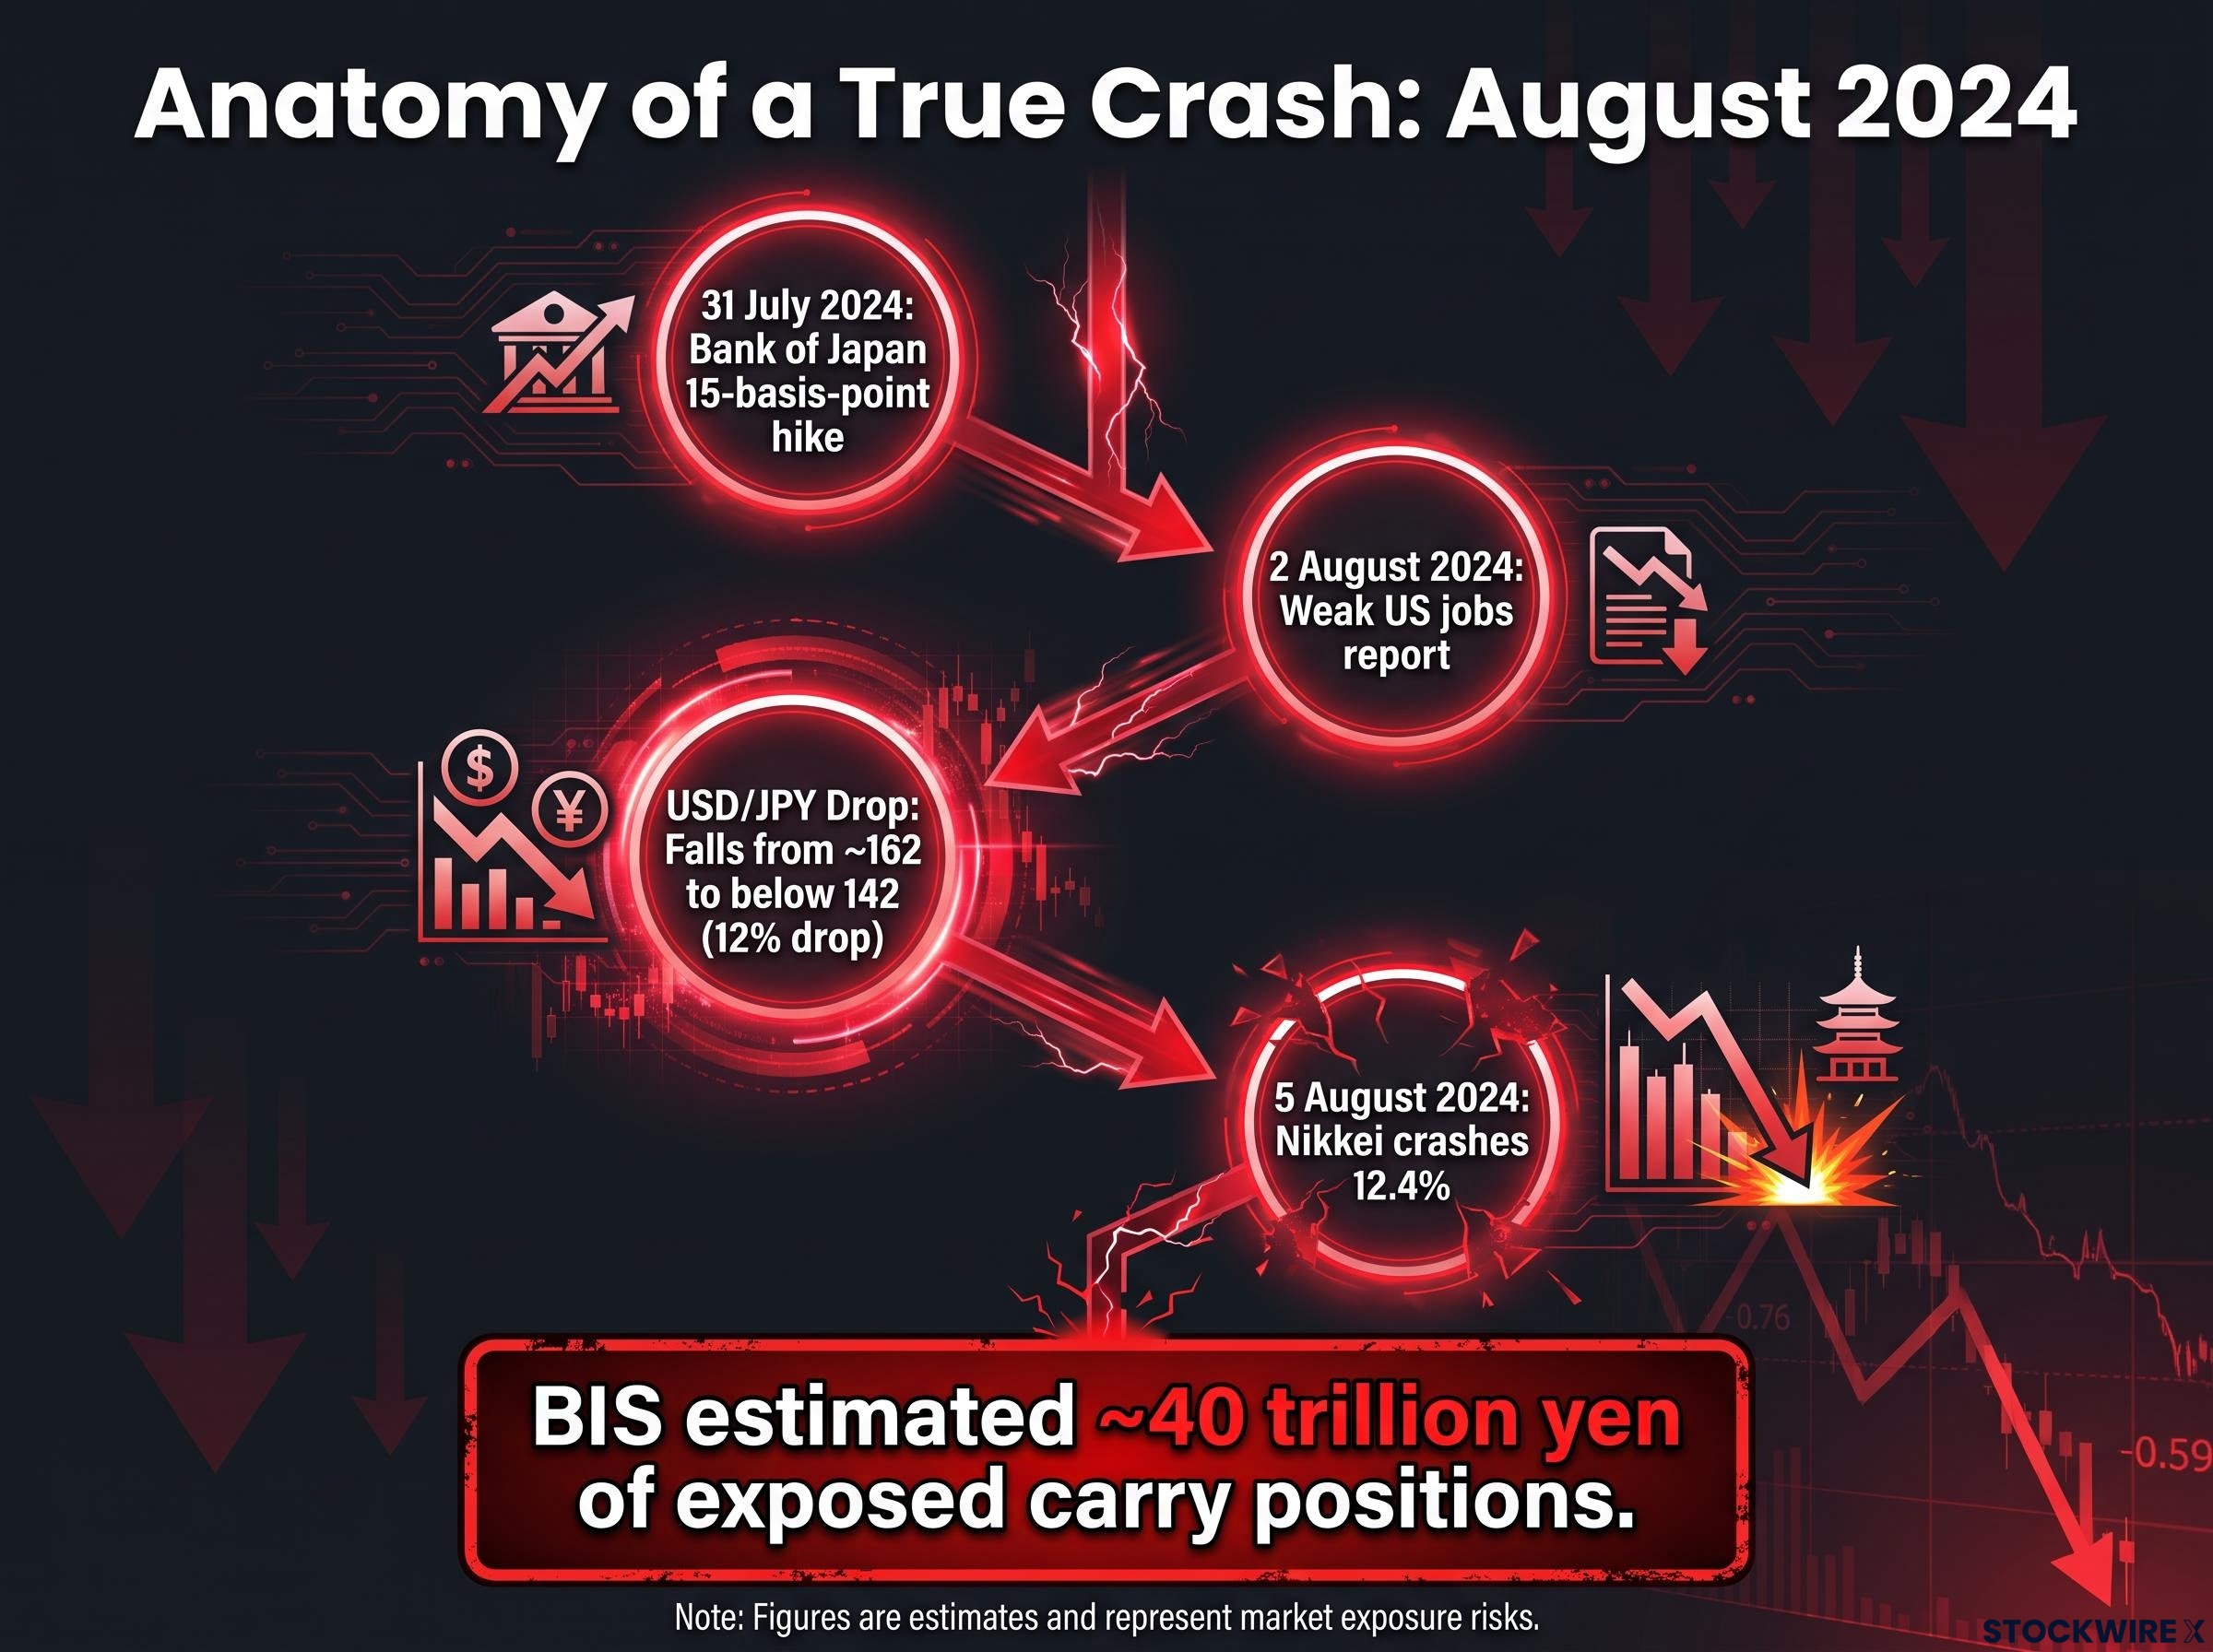
The Bank for International Settlements estimated that around 40 trillion yen of vulnerable carry positions sat exposed during that episode. That is the scale of a genuine liquidation: correlated, forced, and brutal in its speed.
The BIS Bulletin on the August 2024 carry trade unwind estimates that roughly 40 trillion yen of exposed carry positions fed the forced selling cascade, providing the quantitative baseline the article uses to show how far September 2026 conditions fall short of a genuine systemic event.
Lessons for modern portfolio management
Three lessons carry forward from that shock. First, even a tiny, unexpected hike can produce outsized moves when positioning is crowded, because the crowd all reaches for the exit at once. Second, the reliable signals are cross-asset, not currency-only: equity crashes, volatility spikes, and credit stress are what separate a repricing from a systemic event. Third, surviving these episodes requires controlled position sizes, robust stop-loss frameworks, and pre-built tail-risk hedges rather than hope.
That 2024 crash gives you a quantitative baseline. Measure any future stress against it, and the current September move looks calm by comparison, which is precisely the point.
Navigating Bank of Japan normalisation and structural hurdles
Knowing today is calm does not tell you where the yen heads next, and here the professionals genuinely disagree. The split matters, because it defines how much risk sits in any directional bet you place.
BoJ normalisation has shifted from a Japan-only story to a live risk factor for global portfolios, with the pace of rate increases now capable of moving cross-border capital flows in US Treasuries, European sovereign debt, and emerging-market assets simultaneously.
The temporary-correction camp
One group sees the current strength as a correction inside a still-dollar-favourable regime. A Reuters survey reported on 5 August 2026 found median forecasts still had the yen weakening toward 159 per dollar within three months, with many strategists calling intervention “no game changer.” UBS argued Japan’s policy mix is unlikely to generate sustained yen strength while real rates stay negative. TD Securities added that unless the Bank of Japan delivers a series of hikes toward roughly 2% policy rates, the underlying yield gap still argues for USD/JPY resuming its climb. Some surveys in this camp see near-term stabilisation around 155-160.
The structural-recovery camp
The other group sees the early phase of a longer adjustment. A multi-bank outlook covering UBS and ING presents a more bearish USD/JPY case, targeting roughly 138-140 on the argument that the pair has drifted far from fair value and that narrowing real yield gaps should drag it lower over time. BofA Securities analysts expect the Bank of Japan to hike twice in 2026 and see the yen as a potential top performer if those hikes land. The common thread: durable yen strength needs an upgrade to Japan’s growth outlook and a credible move toward that 2% rate threshold, not just isolated interventions that act as a temporary band-aid.
The triggers to watch for a sustained reversal are specific: a run of rate hikes beyond 1%, persistent domestic wage and inflation strength, and narrowing US-Japan yield spreads. Absent those, the move reverses.
That stark divide is your warning. When forecasts range from 138 to 160, an unhedged directional bet carries binary risk, and you should size your positions accordingly.
Calibrating portfolio exposure for a dynamically priced environment
The bigger shift underneath all of this is that the era of near-zero, set-and-forget yen funding is over. Borrowing costs now move dynamically as Bank of Japan expectations shift, and that changes how the carry trade behaves for everyone using it.
Surviving that transition comes down to one discipline: watch the right signals. A falling funding currency, on its own, is not a crisis. The crisis shows up when equities, credit spreads, and volatility move together, as they did in August 2024.
Credit spread signals sit alongside the SOFR-Fed Funds spread and equity volatility as part of the short-list of publicly available indicators that collectively provide an early-warning posture for genuine financial stress, which is why the current stability across all three simultaneously is a more powerful diagnostic than any single metric alone.
So your framework is simple. Before the next major central bank meeting or jobs report, check whether cross-asset stress is building, whether gold and high-beta currencies are holding, and whether speculative positioning is being cut or added. If risk assets stay calm, a currency move is likely repricing, and you sit still. If they crack in unison, that is your cue to act.
This article is for informational purposes only and should not be considered financial advice. Investors should conduct their own research and consult with financial professionals before making investment decisions.
Past performance does not guarantee future results. Financial projections are subject to market conditions and various risk factors, and forward-looking statements are speculative and subject to change based on market developments.