On a day when most major currencies barely moved, the New Zealand dollar was the standout loser, falling roughly 0.63% against the US dollar and a sharper 0.80% against the Japanese yen on 8 September 2026.
That asymmetry is the story. When one currency underperforms the entire major complex on a quiet session, the weakness is specific, not systemic. Three forces are converging on the Kiwi at once: a geopolitical shock to global oil supply through the Strait of Hormuz, a structural vulnerability baked into New Zealand’s trade profile, and a bearish chart pattern that was already forming before the latest catalyst arrived.
Here is a clear breakdown of the three pressures stacking against the NZD right now, and the specific price levels that tell you whether this is an accelerating trend or a shock about to fade.
The Kiwi’s worst session: what the 8 September price action is actually telling you
Start with the cross-currency picture, because it reveals more than the headline NZD/USD number alone. On 8 September 2026, the New Zealand dollar fell against every major currency tracked, which immediately rules out the simplest explanation.
This was not a broad US dollar rally lifting the greenback against everything. If it were, the NZD would have held steadier against the euro, sterling and the Swiss franc. Instead, the losses were spread across the board, and the depth of those losses varied in a way that points to the actual mechanism.
| Currency Pair | Daily Change (%) | Directional Note |
|---|---|---|
| NZD/JPY | -0.80% | Risk-off amplified |
| NZD/CAD | -0.73% | Commodity proxy aligned |
| NZD/USD | -0.63% | Session anchor |
| NZD/EUR | -0.55% | Broad weakness |
| NZD/CHF | -0.38% | Smallest loss |
The NZD also slipped 0.54% against the pound and 0.53% against the Australian dollar, filling in the picture of uniform underperformance.
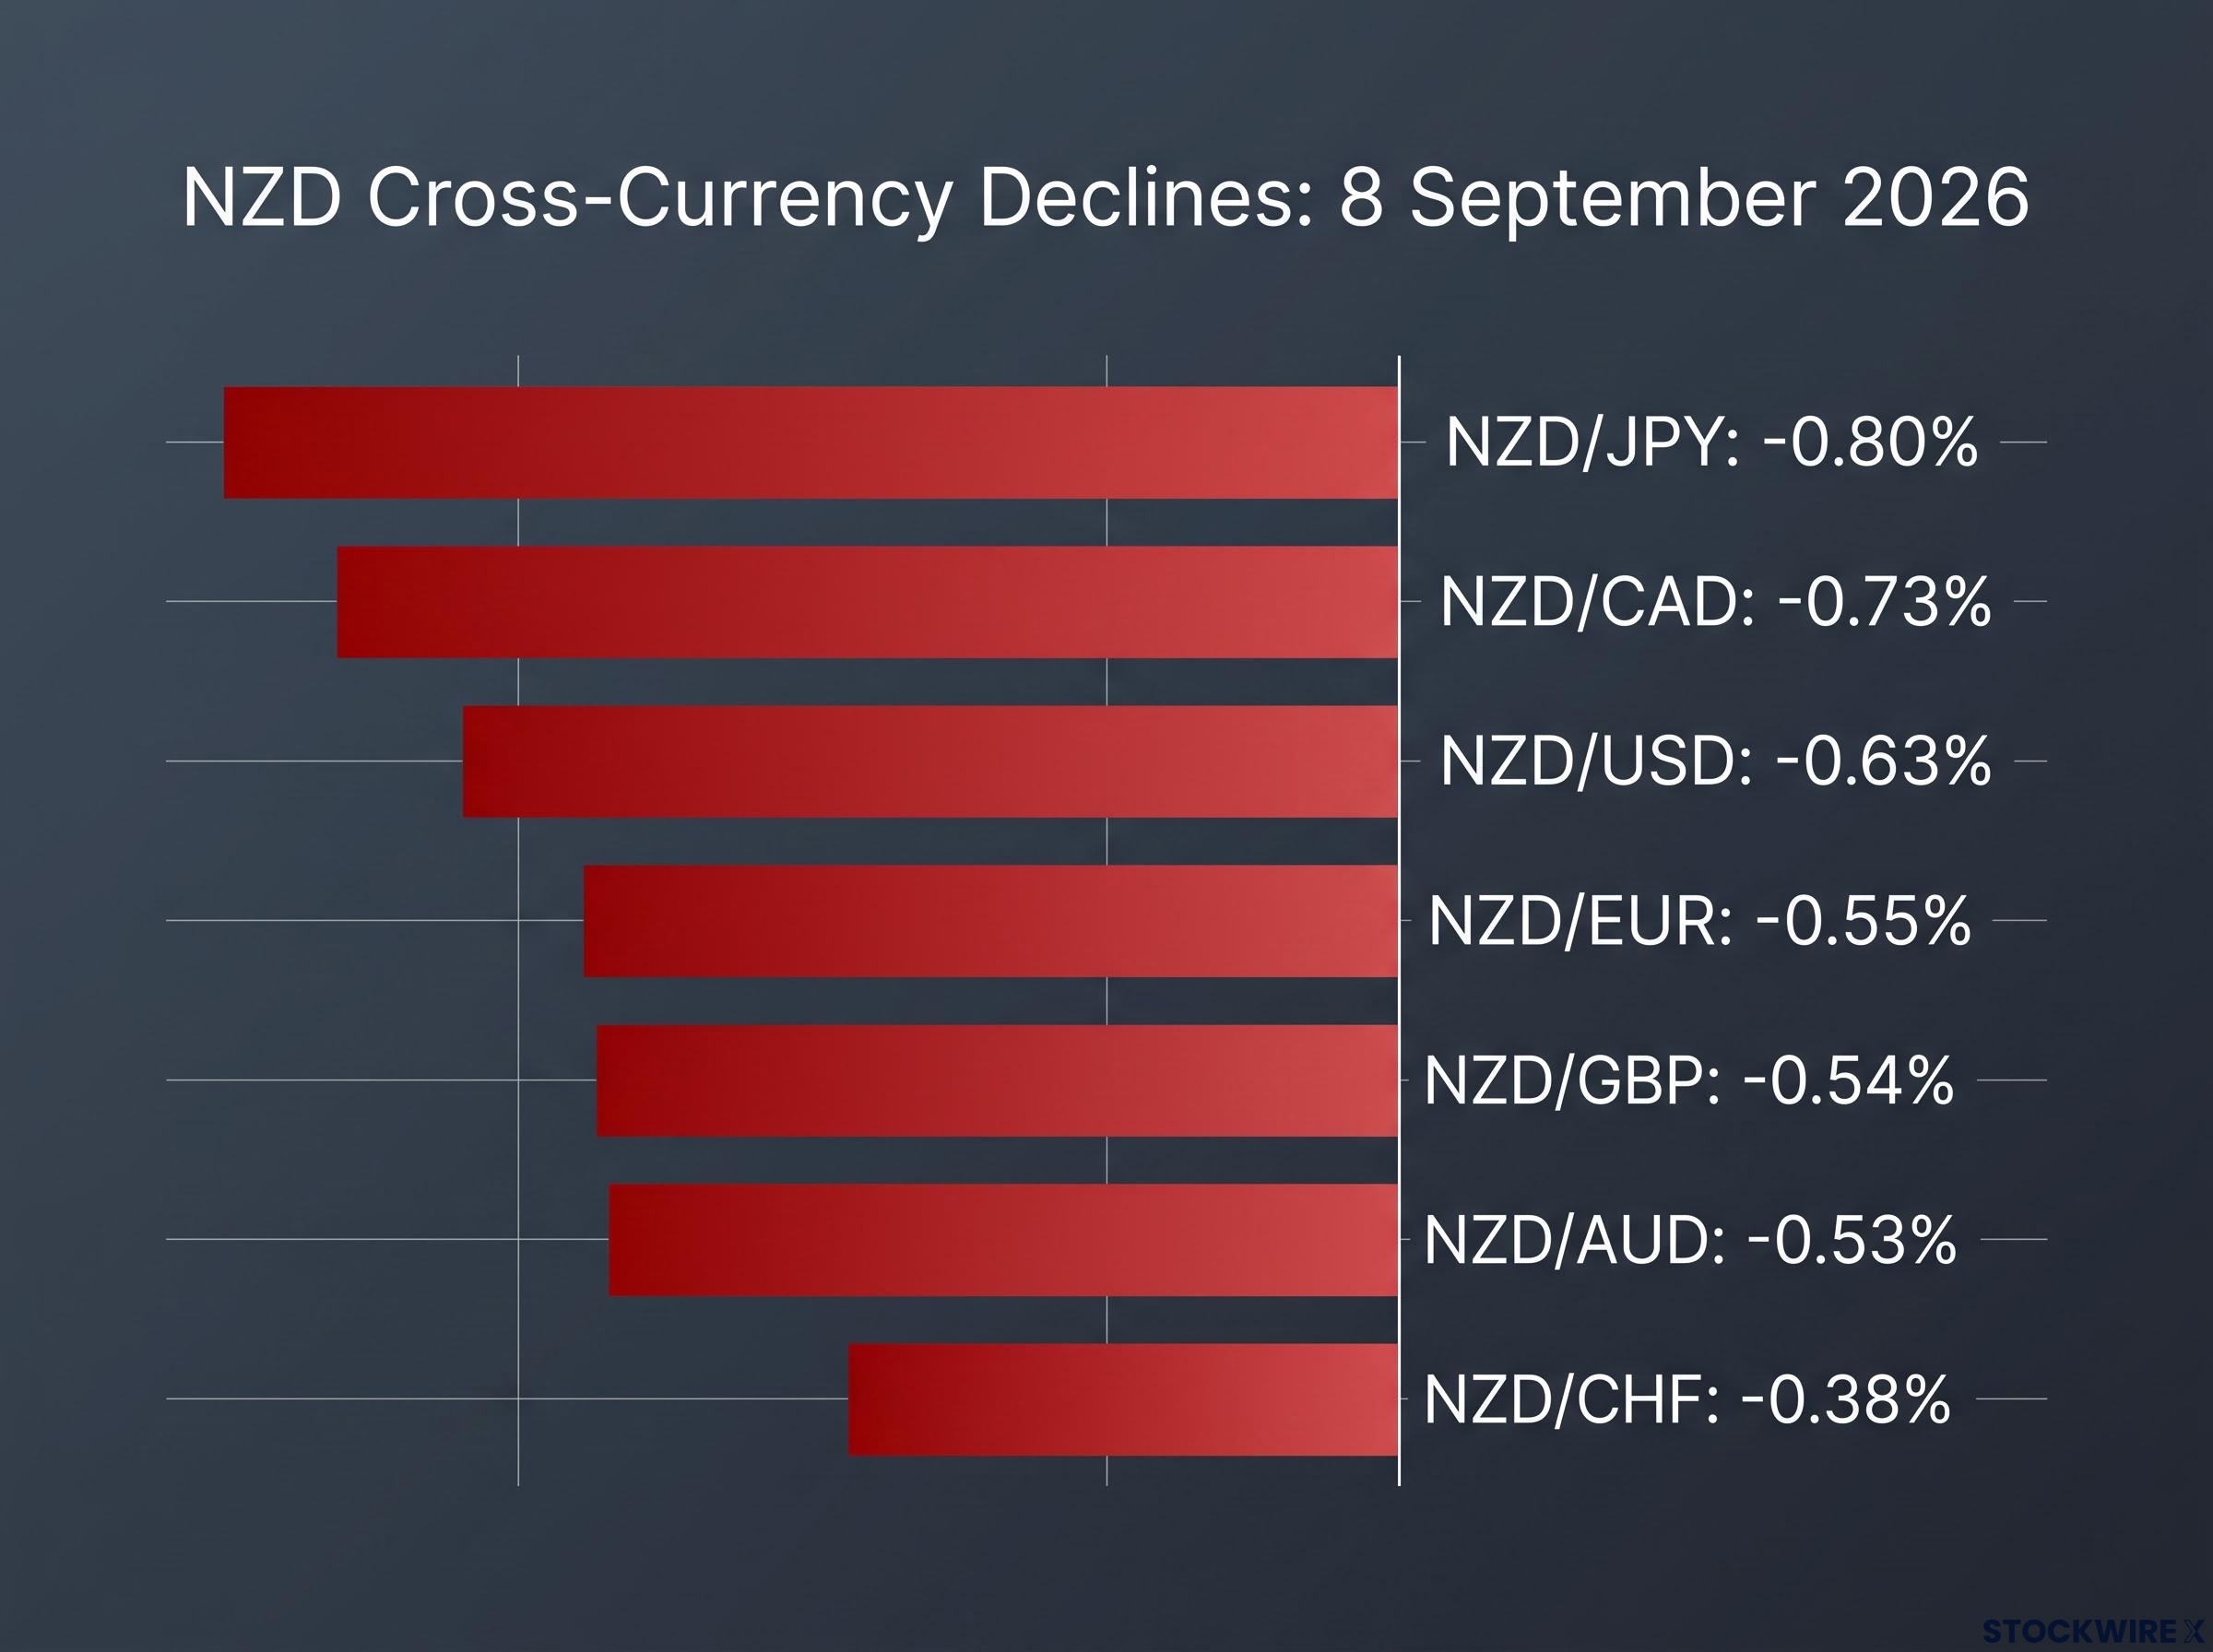
The 0.80% drop against the yen was the session’s single largest cross-currency move for the Kiwi, and it is the most telling number of the day.
Here is why that matters. The yen and the franc are the two currencies investors buy when they want capital preservation, and the Kiwi lost most ground against the yen while losing least against the franc.
That split, combined with a heavy loss against the commodity-linked Canadian dollar, tells you the active mechanism is risk-off flow and commodity-currency dynamics, not a simple dollar bid. The distinction is analytically important because it changes which catalyst you should watch for a reversal.
Risk sentiment sits at the top of the NZD/USD drivers hierarchy and can override bullish RBNZ guidance, strong Chinese data, and supportive dairy prices simultaneously, which is precisely the dynamic that made 8 September’s session-wide underperformance so structurally coherent rather than noise.
Directionally, the pair retreated from the 0.5900 level touched on 5 September down to an intraday low of 0.5836. That roughly 64-pip slide defines the session and sets up the technical questions that come later.
When big ASX news breaks, our subscribers know first
Hormuz, oil at $97 and above, and New Zealand’s structural energy problem
The origin of the pressure sits thousands of miles from Wellington, in the shipping lane that carries a fifth of the world’s oil.
Before the current conflict, the Strait of Hormuz handled roughly 20% of global oil supply, around 138 vessels per day. That throughput has collapsed. The escalation ran through a sequence of events that traders have been tracking all year:
- February 2026: US and Israeli strikes on Iran prompt Tehran to restrict the strait using sea mines and vessel attacks, cutting traffic by roughly 95%.
- 17 June 2026: A 60-day memorandum of understanding lifts the US naval blockade in exchange for safe commercial passage.
- Early August 2026: The US reimposes the blockade, alleging Iran breached the agreement.
- 13 August 2026: Iran declares the Strait of Hormuz “under its control.”
- Weekend before 8 September: Iran warns it will target US oil and gas interests in Gulf states if attacked again.
Those weekend warnings were the immediate trigger for the risk-off tone that hammered the Kiwi on Tuesday.
The Hormuz shipping crisis had already compressed commercial transits to 3-14 vessels per day against a pre-war baseline of 120-140 by mid-August, meaning the weekend warnings that catalysed Tuesday’s session arrived on top of a supply constraint that had been building for weeks rather than emerging as a fresh event.
Before the conflict, roughly 138 commodity vessels transited the strait each day. Over the 10 days to 7 September 2026, the average was just 10 vessels per day.
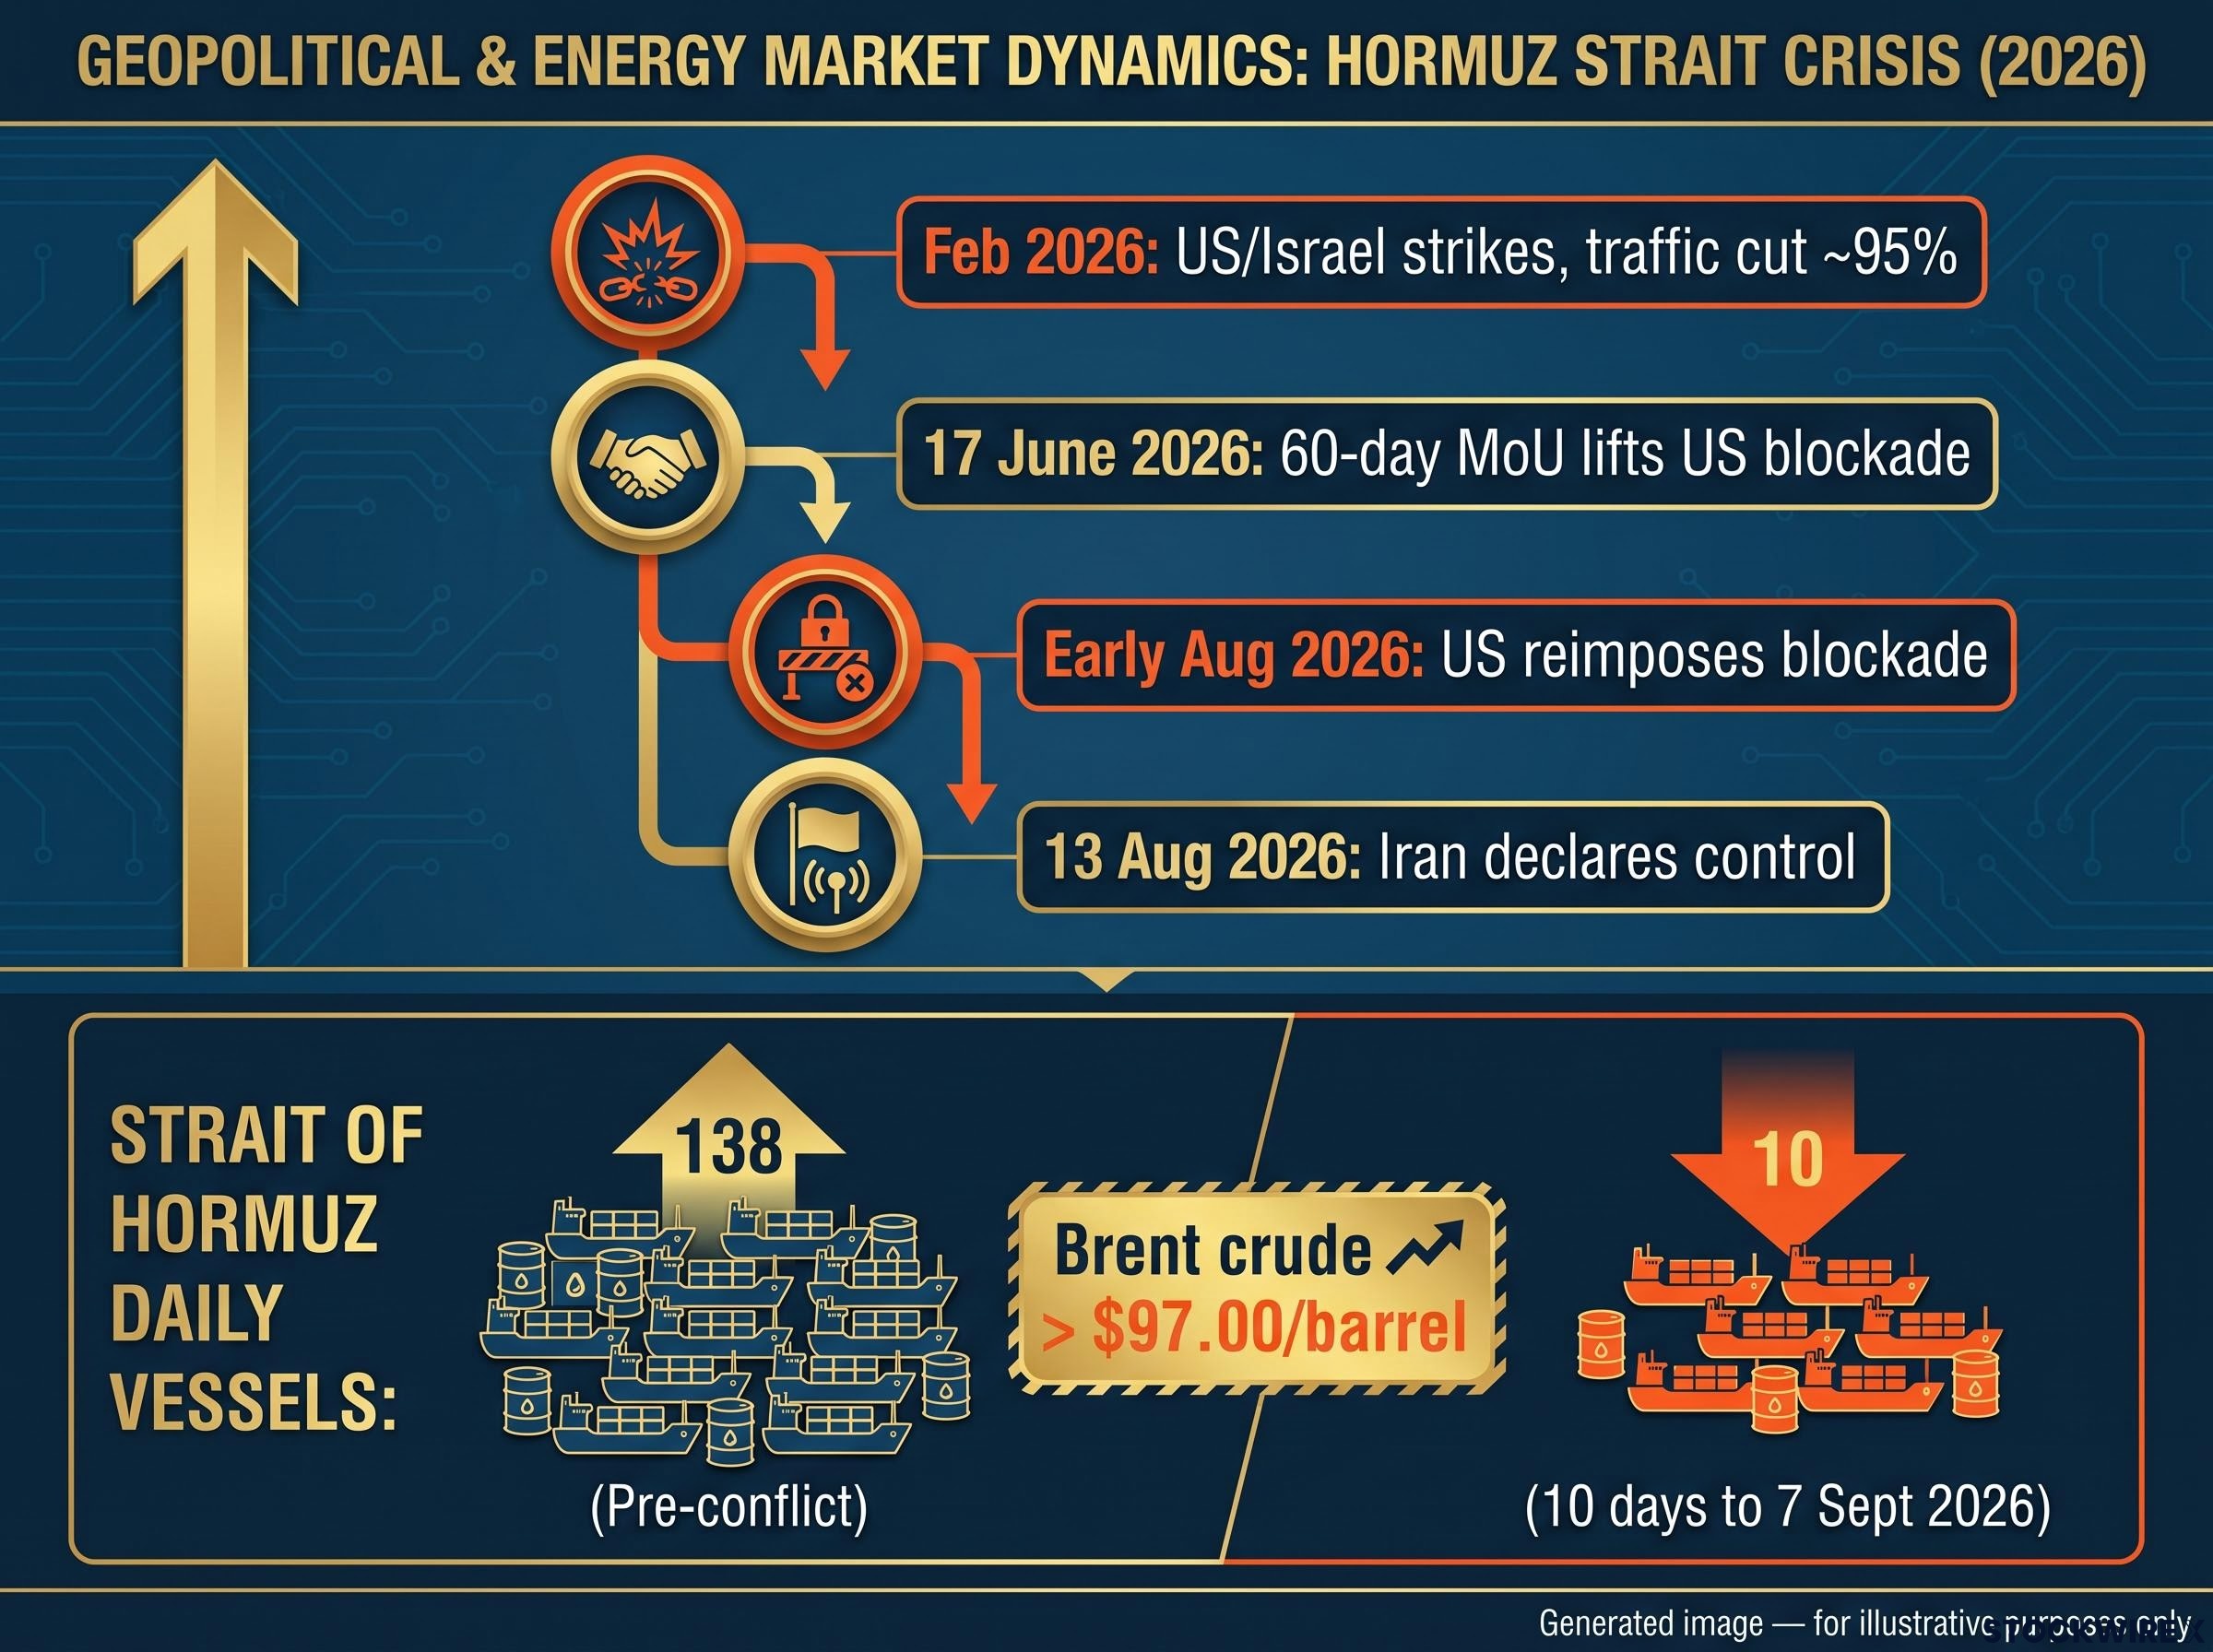
To keep some crude moving, the US military established what has been described as a “stealth” corridor near Oman, shifting around 10 million barrels per day, roughly half of pre-war volume. The gap between supply and demand shows up directly in price. Brent crude traded above $97.00 per barrel during the European session on 8 September 2026, up around 9% through September and sitting 38% above its July lows.
Why an oil spike hits the Kiwi differently than the Loonie or Krone
This is the part most traders overlook. A rising oil price is not a uniform event across commodity currencies. It depends entirely on whether the country sells oil or buys it.
New Zealand is a net importer of hydrocarbons. When crude spikes, the country pays more for every litre of imported fuel, which worsens its trade balance and pushes up input costs for transport, agriculture and manufacturing at the same time.
Contrast that with the Canadian dollar or the Norwegian krone. Those economies export oil, so a price spike delivers a revenue windfall that offsets the input-cost hit. New Zealand gets no such cushion.
Its export base of dairy, meat and forestry earns nothing extra when oil rises. So the trade-balance deterioration and the rising domestic inflation both push in the same direction, and both are NZD-negative. For anyone holding the Kiwi, a sustained move above $100 is not a neutral headline. It is a structural drag on New Zealand’s growth and current account that the currency prices in progressively, not in a single move.
China’s import data and what makes the currency markets call the Kiwi a proxy
To read the next layer of pressure, you need to understand why the NZD is treated as a bet on China in the first place.
New Zealand’s core exports, dairy, meat and forestry, are heavily directed toward Chinese buyers. When Chinese demand shifts, New Zealand’s terms of trade and growth expectations move with it, which is why major bank analysts, including those at ANZ and Westpac, classify the Kiwi explicitly as a China-proxy currency.
The proxy label rests on three structural features:
- Export concentration: A large share of New Zealand’s commodity exports flow to China.
- High-beta risk profile: The NZD is a cyclical currency that rises and falls with global risk appetite.
- Terms-of-trade sensitivity: Shifts in Chinese commodity demand feed directly into New Zealand’s income from trade.
Now to the data, which cuts both ways. China’s August trade figures looked strong on the surface, but the composition told a more complicated story for the Kiwi.
| Metric | August 2026 Value | Year-on-Year Change | NZD Relevance |
|---|---|---|---|
| Total foreign trade | $683.8B | +26.3% | Headline strength |
| Imports (USD terms) | Beat forecasts | +28.2% | Aggregate demand solid |
| Trade surplus | $119.09B | Record pace | Up from $112.5B in July |
| Crude oil imports (volume) | 37.93M tonnes | -23.4% | Commodity demand softening |
Here is the tension a Kiwi trader has to resolve. China’s imports jumped 28.2% year-on-year in US dollar terms, accelerating from July’s 27.5% rise, and the trade surplus hit a record pace of $119.09 billion. On the headline, that reads as robust Chinese demand.
But crude oil imports fell 23.4% year-on-year in volume terms to 37.93 million tonnes, a sign that Chinese buyers are pulling back from commodities as global prices climb and supply risks mount.
The read you should take from this is that aggregate trade strength does not automatically protect the NZD. What matters for the Kiwi is demand for the specific commodities New Zealand sells, and if Chinese purchasing is shifting away from raw materials amid elevated prices, the headline surplus offers little cushion. That is the analytical filter to apply to every future China data release when you are judging Kiwi exposure.
China’s materials demand is splitting in ways the headline industrial output figure actively conceals: cement collapsed 11.6% and steel fell 4.1% in July while advanced manufacturing expanded, a structural divergence that matters directly for New Zealand because the commodities Beijing is pulling back from include the raw-material categories most closely linked to Kiwi export revenue.
The Head and Shoulders setup: what the chart is saying and where the decision points are
The macro pressure would matter less if the technical picture were neutral. It is not. As of 8 September 2026, NZD/USD was trading beneath its 200-day simple moving average near 0.5854, a signal that the short-term bias had already turned negative before the oil shock intensified.
Price is now converging on the neckline of a bearish Head and Shoulders formation, a chart pattern where a central peak sits between two lower peaks, and a break below the connecting support line typically signals further downside. That neckline support sits between 0.5800 and 0.5820.
Momentum indicators corroborate the setup without yet screaming. The Relative Strength Index (RSI), which measures whether a currency is overbought or oversold on a scale of 0 to 100, is declining toward the low-40s. The MACD line, a trend-and-momentum gauge, sits below zero with a negative histogram.
If the neckline breaks decisively, the bearish sequence opens up:
- Neckline breach at 0.5800/0.5820
- First target at 0.5765, the late July low
- Then 0.5745, the 13 July low
- Full measured Head and Shoulders target projecting below the 26 June low of 0.5626
Technical analysts caution that the pattern is only confirmed by a decisive neckline break on strong volume with genuine follow-through. False breaks and quick reversals can invalidate the setup entirely.
The read here is that the chart sits at a binary juncture. The next 50 to 80 pips carry disproportionate weight, so a trader watching this pair needs a plan for both the break and the rejection before either prints, not after.
If the neckline holds: what a reversal would require
The bullish case is narrower but real. To ease the bearish pressure meaningfully, buyers would need to reclaim the 5 September high near 0.5900.
Clearing that level would shift focus toward the next zone of significance, late August resistance near 0.5990. Above there, the bearish structure would be seriously compromised.
For that to happen, though, the chart needs a macro trigger. The most credible candidates are a de-escalation in the Strait of Hormuz that eases oil, a positive Chinese stimulus surprise, or a hawkish pivot from the Reserve Bank of New Zealand driven by imported inflation.
What shifts the picture: the three variables that could reverse the Kiwi’s trajectory
The bearish stack is clear, but a bearish view is only useful if you know what would break it. Three catalysts could reverse the Kiwi’s trajectory, and they differ sharply in probability and lead time.
- A credible Strait of Hormuz de-escalation. This is the fastest potential trigger. A verified reopening would ease oil prices quickly and lift cyclical currencies like the NZD, removing the most immediate source of pressure.
- A positive Chinese stimulus surprise. A meaningful lift in infrastructure spending or consumer support would improve New Zealand’s export outlook. This is slower to arrive and depends on Beijing’s policy timing.
- An RBNZ hawkish pivot. If higher oil prices feed aggressively into domestic inflation, a hawkish shift in RBNZ guidance would support the NZD through wider interest-rate differentials. This is the longest-lead scenario and the least certain, since central banks often look through energy-driven inflation.
There is also a positioning dynamic worth respecting.
Extended speculative short positioning, combined with fundamental undervaluation, can set the stage for rapid short-covering rallies on even modestly positive news flow, overriding bearish chart patterns in the process.
Commodity currency positioning can flip from net buying to net selling within a single week even against a dovish macro backdrop, as BNY iFlow data confirmed when all five commodity FX baskets rotated to net selling shortly after the Fed’s pivot, a pattern that reinforces why extended short positioning in the Kiwi does not guarantee an orderly unwind on the first positive headline.
History supports caution on the timing. Across past Middle East supply disruptions and the 2015-2016 China commodity downturn, high-beta currencies like the NZD often stayed depressed through the initial shock phase until clear stabilisation in Chinese growth or global risk appetite emerged. The practical implication for anyone watching this pair is that the bearish setup remains intact until one of these three conditions shifts, which means monitoring oil headlines and RBNZ communications as closely as the chart itself.
This article is for informational purposes only and should not be considered financial advice. Investors should conduct their own research and consult with financial professionals before making investment decisions.
Past performance does not guarantee future results. Financial projections are subject to market conditions and various risk factors, and forward-looking scenarios are speculative and subject to change based on market developments.
Three forces, one direction, and the levels that matter from here
Strip the session down and the same three pressures line up: a geopolitical oil shock working through a net-importer economy, Chinese demand shifting away from the commodities New Zealand actually sells, and a technical structure approaching a decisive break.
The levels that anchor your monitoring are simple to hold. The 0.5800 to 0.5820 neckline is the line that confirms the bearish case if it breaks. A reclaim of 0.5900 is what would invalidate it.
The wider principle is what makes this setup notable. When macro drivers and technicals point the same way at the same time, the burden of proof sits with the reversal thesis, not the continuation thesis. Until one of the three forces genuinely turns, the weight of evidence stays on the side of the Kiwi’s weakness.