#
The US Treasury launched its most aggressive debt buyback in years last week, and rather than steadying the bond market, it deepened the sell-off. For the Indonesian rupiah, that outcome carries more weight than most traders are pricing in.
The USD/IDR pair is caught in a layered set of pressures in early September 2026. US 10-year yields sit near 4.84%, a Fed rate hike probability of around 57-60% hangs over the coming inflation data, and oil prices punish Indonesia directly as a net importer. These are not separate stories. They feed each other, amplifying rupiah vulnerability at exactly the moment the carry buffer that usually protects emerging market currencies has thinned to a historic low.
Here is what the current macro configuration actually means for positioning around emerging market currency exposure. Not a general recap, but a specific read on where the pressure points sit, what the USD IDR forecast hinges on, and which single variable would shift the picture if it moves.
Why the Treasury buyback backfired, and what it signals for yields
The sequence matters, because in retrospect the disappointment was almost inevitable. The US Treasury announced the buyback on 19 August 2026, with the operational window running from 9 September through 4 November 2026. It was framed as liquidity support for longer-dated nominal securities, a way to keep the market for older, less-traded bonds functioning smoothly.
Then the numbers arrived, and they looked small against the problem they were meant to address.
The programme set a minimum of $4 billion per long-dated operation, with a specific 10-20 year operation on or around 10 September 2026 capped at $6 billion. That is triple the usual size, yet market participants were unimpressed.
| Operation type | Maturity range | Cap amount |
|---|---|---|
| Long-dated nominal coupon | 10-20 years | $6 billion |
| Short-term nominal coupon (cash management) | Short-dated | $12.5 billion total |
| TIPS (inflation-protected) | 10-30 years | $500 million |
The scale is the whole story. Set against a Treasury market that commentary noted exceeds $30 trillion, the operation registered as marginal.
Treasury buyback mechanics differ fundamentally from QE: the programme swaps long-duration supply for short-duration supply without creating reserves or reducing total federal debt outstanding, which is precisely why a $6 billion operation against a $30 trillion market registered as marginal rather than stabilising.
Market participants described the $6 billion operation as “a drop in the bucket” relative to the overall size of the Treasury market.
Yields kept climbing regardless. On 9 September 2026, the 10-year Treasury yield reached roughly 4.835%-4.84%, nearing its highest levels since November 2023. A $39 billion 10-year note auction cleared at approximately 4.834%, confirming that buyers demanded real compensation to absorb the supply.
Strategists from JPMorgan, Jefferies, Goldman Sachs and Wells Fargo pointed to the same structural cause: buybacks of this size do not touch the underlying deficit or the inflation concern driving the selling. Worse, if the Treasury finances the buybacks by issuing more short-term bills, it simply shifts duration rather than reducing net supply at the long end.
That is the read you should take from the episode. The pressure on emerging market borrowing costs is not a temporary liquidity glitch that policy can smooth over. It is a structural supply imbalance, which means the dollar strength story driving USD/IDR is not close to exhausting itself.
When big ASX news breaks, our subscribers know first
Indonesia’s structural exposure: why this yield environment hits the rupiah harder than most
Not every emerging market currency feels a high-yield environment equally. Indonesia sits closer to the centre of the blast radius than most, and three features explain why.
- It is a net oil importer, so elevated energy prices strain its fiscal position and import imported inflation directly.
- Its interest rate differential versus the US is historically thin, stripping away the carry buffer that normally attracts offsetting inflows.
- Its fiscal position is unusually sensitive to US yields through the interest-to-revenue channel.
Start with oil. Prices referenced near $90 per barrel in May 2026 feed straight into Indonesia’s external balances, because the country buys its petroleum in dollars. When the currency weakens, that same barrel costs more in rupiah terms, compounding the fiscal strain rather than easing it.
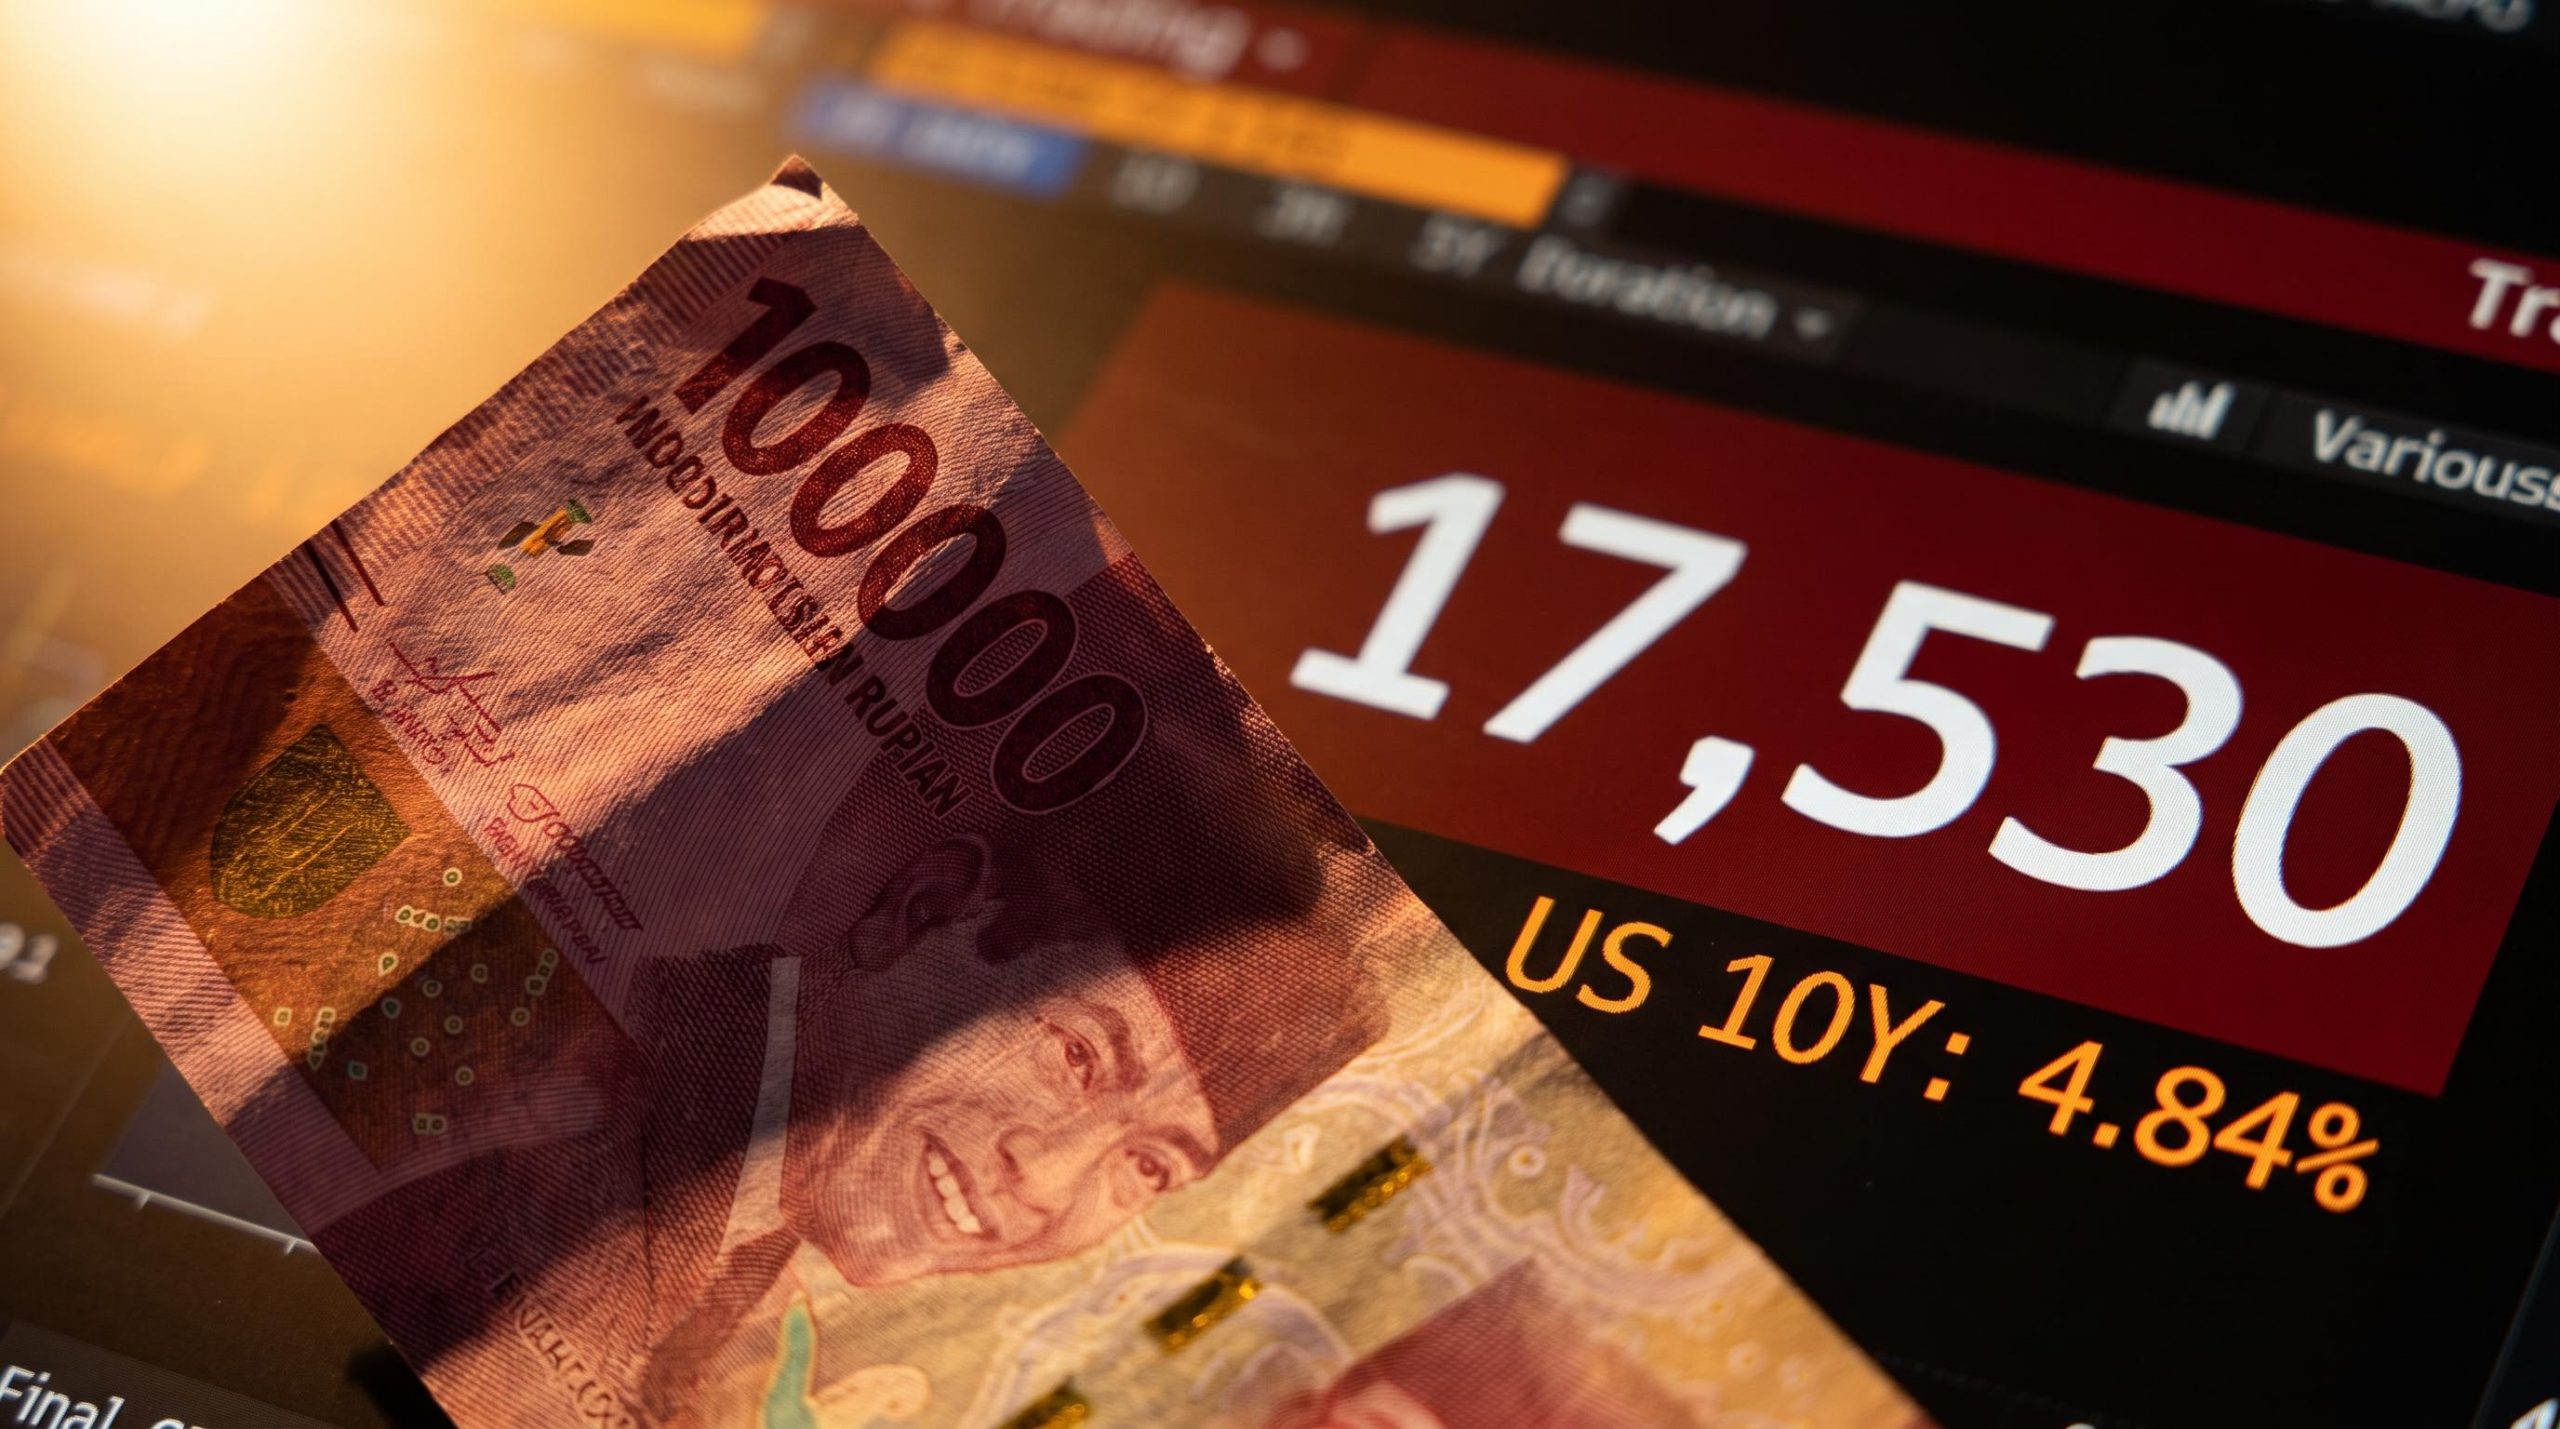
The rupiah has already been under visible strain, weakening by roughly 5% against the dollar in the six months to mid-2026. On 10 September 2026, USD/IDR traded around 17,530, pulling back from a 1 September high near 17,770 but still elevated by historical standards.
The carry buffer problem and what a thin differential means in practice
The carry trade is the mechanism worth understanding here. Investors borrow money in a low-yield currency and park it in a higher-yielding one, and the interest rate gap between the two, the carry, compensates them for taking on the currency risk.
When US yields rise sharply, that gap narrows. The compensation for holding rupiah-denominated assets shrinks, and global investors reallocate toward US assets that now pay more for less risk.
This dynamic is not unique to Indonesia. What is unique is how Indonesia’s fiscal constraints amplify it, turning a routine capital reallocation into a genuine fiscal pressure point.
BNP Paribas made that pressure point specific. Its analysis warned that if US 10-year yields stay above 4.5%, Indonesia’s interest-to-revenue ratio could exceed 20%, a level associated with elevated fiscal stress.
BNP Paribas warned that with US 10-year yields above 4.5%, Indonesia’s interest-to-revenue ratio could climb beyond 20%, a threshold associated with elevated fiscal stress.
Acting Governor Destry Damayanti has cautioned that rising US yields could require a stronger future policy response. That threshold is not an abstract metric. It is the point at which Bank Indonesia may have to choose between defending the currency and protecting domestic growth, and that choice has direct consequences for anyone holding Indonesian assets.
Bank Indonesia’s rate plateau, following a 100 basis point tightening cycle that ran from May through July 2026, defines the ceiling from which Acting Governor Damayanti must now respond if yields hold near 4.84%, because any further hike competes directly with the interest-to-revenue constraint BNP Paribas flagged as the binding limit on the policy toolkit.
Fed policy uncertainty and what the September inflation data could confirm
If the yield backdrop is the pressure, the September inflation prints are the trigger the market is now watching for. CME FedWatch pricing in early September 2026 put the probability of a 25 basis point hike at the September meeting at roughly 57%-60%. Elevated, but not decisive, which is precisely what makes the incoming data path-changing.
Economists forecast monthly gains of 0.2%-0.4% for both CPI and PPI. A print at the hotter end would strengthen the case for a hike; a softer print would open the first credible relief window in weeks.
The forecasts diverge sharply, and that divergence is the honest picture of the uncertainty.
| Institution | 2026 hike forecast | Implied USD/IDR bias |
|---|---|---|
| Bank of America | Three hikes (Sept, Oct, Dec) | Higher (rupiah weaker) |
| Deutsche Bank | Two 25bp hikes | Higher (rupiah weaker) |
| Bloomberg Economics | No hike | Lower to stable (rupiah relief) |
| SF FedViews | Terminal rate near 4.25% by mid-2027 | Sustained dollar strength |
The Fed’s own June 2026 Summary of Economic Projections put the median federal funds rate at 3.8% for 2026, up from 3.4% in the March projection. The June dot plot reportedly showed nine FOMC participants expecting at least one hike, six expecting 50 basis points, eight expecting no change and one anticipating a cut, though this composition is not independently verified. Even a hold in September may not relieve the rupiah if yields hold near current levels.
The June 2026 Summary of Economic Projections released by the Federal Reserve placed the median federal funds rate at 3.8% for 2026, up from 3.4% in the March projection, providing the authoritative baseline against which the diverging Wall Street forecasts in the table above are measured.
The spread between Bank of America’s three-hike call and Bloomberg Economics’ no-hike view is not analyst noise. It maps onto a wide range of USD/IDR outcomes, which is why positioning around an explicit scenario beats assuming a comfortable central case.
- A hot print. CPI or PPI above forecast validates the hike thesis, pushes yields higher, strengthens the dollar and weakens the rupiah further.
- A soft print. An undershoot introduces the first genuine relief trade in weeks, easing the pressure that has built through the summer.
What the 2013 and 2018 episodes tell you about how this ends
History is useful here not as reassurance but as calibration. In both the 2013 taper tantrum and the 2018 rate-hike cycle, Indonesia sat among the “Fragile Five” emerging markets, grouped for its current-account deficit sensitivity, energy import exposure and vulnerability to capital flight. The structural setup rhymes with today.
In 2013, when the Fed signalled it would slow asset purchases, Indonesia’s current-account deficit widened to about 4.4% of GDP. Bank Indonesia responded by raising the cash rate by roughly 175 basis points, trimming fuel subsidies and allowing the currency to depreciate, stabilising the external balance over several quarters.
The 2018 episode was harsher. A strong dollar and repeated Fed hikes drove the rupiah down roughly 5% in the first half of the year, touching a 20-year low in October. Bank Indonesia hiked aggressively to 7.50%, a full 200 basis points of tightening, intervened in bond markets, and the government reportedly raised fuel prices by around 40%, a figure that is not independently verified.
| Episode | Rupiah depreciation | BI policy response | Key constraint |
|---|---|---|---|
| 2013 taper tantrum | Sharp, deficit to 4.4% of GDP | ~175bp of hikes, subsidy cuts | Wide current-account deficit |
| 2018 rate-hike cycle | ~5% in H1, 20-year low in October | 200bp to 7.50%, bond intervention | Strong dollar, capital outflows |
| 2026 current episode | ~5% over six months to mid-2026 | Response pending | Interest-to-revenue ceiling |
The pattern shows Indonesia has defended its currency before, and succeeded. But the defence cost aggressive domestic tightening that crimped growth every time.
What is different in 2026 and why the playbook costs more to run
The BNP Paribas interest-to-revenue threshold is the constraint that was not present to the same degree in prior cycles. Above 20%, fiscal stress becomes the dominant concern, which puts a ceiling on how far Bank Indonesia can raise rates before it creates a new problem while solving the old one.
Oil near $90 per barrel compounds the bind. Any depreciation raises the dollar import bill at the very moment the currency is weakening, so the fiscal cost of defending the rupiah climbs alongside the currency risk.
The read for investors is asymmetry. The tools exist, but deploying them is more expensive than in 2013 or 2018, which means the market may test Indonesia’s resolve before a credible policy response emerges. Rupiah stabilisation is achievable, but likely only after visible deterioration, and the response itself becomes a secondary risk to Indonesian growth assets.
Making a calibrated call on USD/IDR from here
Three pressure channels now converge: the structural yield dynamic that Treasury buybacks could not suppress, Indonesia’s specific vulnerability through oil imports and a thin carry buffer, and the Fed uncertainty crystallising around the September data. The most actionable of the three is the yield level itself, because it is the single variable everything else keys off.
The framework splits cleanly. A sustained 10-year yield above the 4.5% BNP Paribas stress threshold, currently sitting near 4.84%, keeps the dollar bid, presses the interest-to-revenue constraint and biases USD/IDR toward the 1 September high near 17,770 and beyond. A meaningful pullback, most plausibly triggered by soft inflation data, is the only near-term path to genuine rupiah relief from the current 17,530.
For investors wanting the granular price-action context behind the current 17,530 level, our full explainer on the USD/IDR retreat from its July high details how the 18,279 all-time high was reached, what catalysts drove the partial recovery, and why 18,000 remains the key structural reference for the next directional move.
SF FedViews observed that markets expect the terminal rate to settle near 4.25% by mid-2027, the longer-dated anchor that frames how durable this dollar strength thesis could be.
For anyone deciding whether to reduce, hold or add EM currency exposure, watch these three variables in order:
- The September CPI and PPI outcome, the nearest binary trigger.
- The 10-year yield relative to the 4.5% threshold.
- Any signal of a Bank Indonesia policy response.
The asymmetry is the takeaway: limited upside for the rupiah, multiple pathways to further weakness. The September inflation print is the fork in the road.
This article is for informational purposes only and should not be considered financial advice. Investors should conduct their own research and consult with financial professionals before making investment decisions. Past performance does not guarantee future results, and financial projections are subject to market conditions and various risk factors. These statements are speculative and subject to change based on market developments.