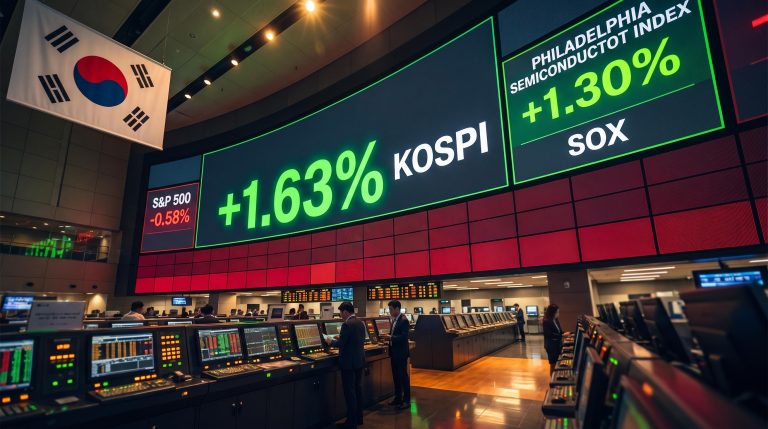
Two events are colliding this week, and they are not obviously pointed in the same direction. The Treasury has just run its largest bond buyback operation under an expanded programme, setting the first enhanced operation at up to $6 billion on 10 September 2026. Days later, inflation data will either confirm or undercut roughly 60% market odds of a Federal Reserve rate hike on 15-16 September.
Sit with that tension for a moment. The Treasury is actively trying to hold down long-end yields through US Treasury bond buybacks, while the Fed may be about to raise the very rates that push yields up. Two policy levers, potentially pulling against each other.
Here is why the next five days carry unusual weight. The 10-year yield closed at 4.80% on 8 September 2026, near its highest since November 2023, and a buyback programme the Treasury quietly doubled in size now sits alongside a Fed decision a week away.
This piece gives you a working understanding of how buybacks move yields and the Dollar, what threshold this week’s Producer Price Index (PPI) and Consumer Price Index (CPI) readings need to cross to shift Fed pricing, and where the genuine risks sit on both sides of the September call.
What the Treasury just did, and why it surprised markets
On 19 August 2026, the Treasury announced it would at least double the per-operation cap on its liquidity-support buybacks of longer-dated nominal coupon securities. The maximum rose from $2 billion to a minimum of $4 billion per operation, effective 9 September through 4 November 2026.
Treasury’s August 2026 buyback announcement formally stated that the per-operation cap on liquidity support operations for longer-dated nominal coupon securities would rise to at least $4 billion, with the explicit goal of providing greater liquidity support in targeted sectors of the bond market.
That was the first surprise. But there was a second surprise hiding inside the first.
When the Treasury revealed the details of its opening enhanced operation on 9 September, it set the size at up to $6 billion on the 10- to 20-year sector, exceeding its own stated floor. Markets had been given a $4 billion baseline three weeks earlier, and the actual number came in higher.
The scale becomes clearer when you look at demand. According to reporting on the August 2026 operations, dealer offers exceeded the prior $2 billion cap by roughly tenfold in some cases, signalling that market appetite for the liquidity support was far greater than the headline caps implied.
That detail matters for how you read the Treasury’s choice. Setting the first operation at $6 billion rather than the $4 billion floor tells you the announced programme was deliberately conservative, and that real demand pressure was substantially larger than the published numbers suggested.
The three figures that anchor the programme:
- Old per-operation cap: $2 billion
- New minimum per-operation cap: $4 billion (effective 9 September 2026)
- First enhanced operation: up to $6 billion (10 September 2026, 10- to 20-year sector)
| Event | Date | Size | Sector |
|---|---|---|---|
| Programme expansion announced | 19 August 2026 | Cap raised to $4B minimum | Longer-dated nominal coupons |
| First enhanced operation set | 9-10 September 2026 | Up to $6B | 10- to 20-year |
Understanding that these were two distinct moments, separated by three weeks, explains why the market reaction split across two dates rather than landing as a single event. If you only caught one headline, you missed half the story. The programme itself faces review at the 4 November 2026 Quarterly Refunding.
When big ASX news breaks, our subscribers know first
How buybacks move yields and what that does to the Dollar
Start with the mechanism in its cleanest form. When the Treasury buys back existing long-dated bonds, it adds demand for those securities. More demand pushes prices up, and because bond prices and yields move in opposite directions, yields fall, particularly in the 10- to 30-year sector the programme targets.
Lower yields then feed into currency markets. A lower US yield reduces the Dollar’s interest-rate advantage over other currencies, which tends to weaken it. That is the transmission channel connecting a debt-management operation to the currency screens you watch daily.
Bas Kooijman, DHF Capital Higher buyback volumes “could keep a lid on long-term Treasury yields and weigh on the currency.”
So far, so tidy. Except the same programme produced opposite market moves depending on which day you look at.
Why the same programme produced opposite market moves
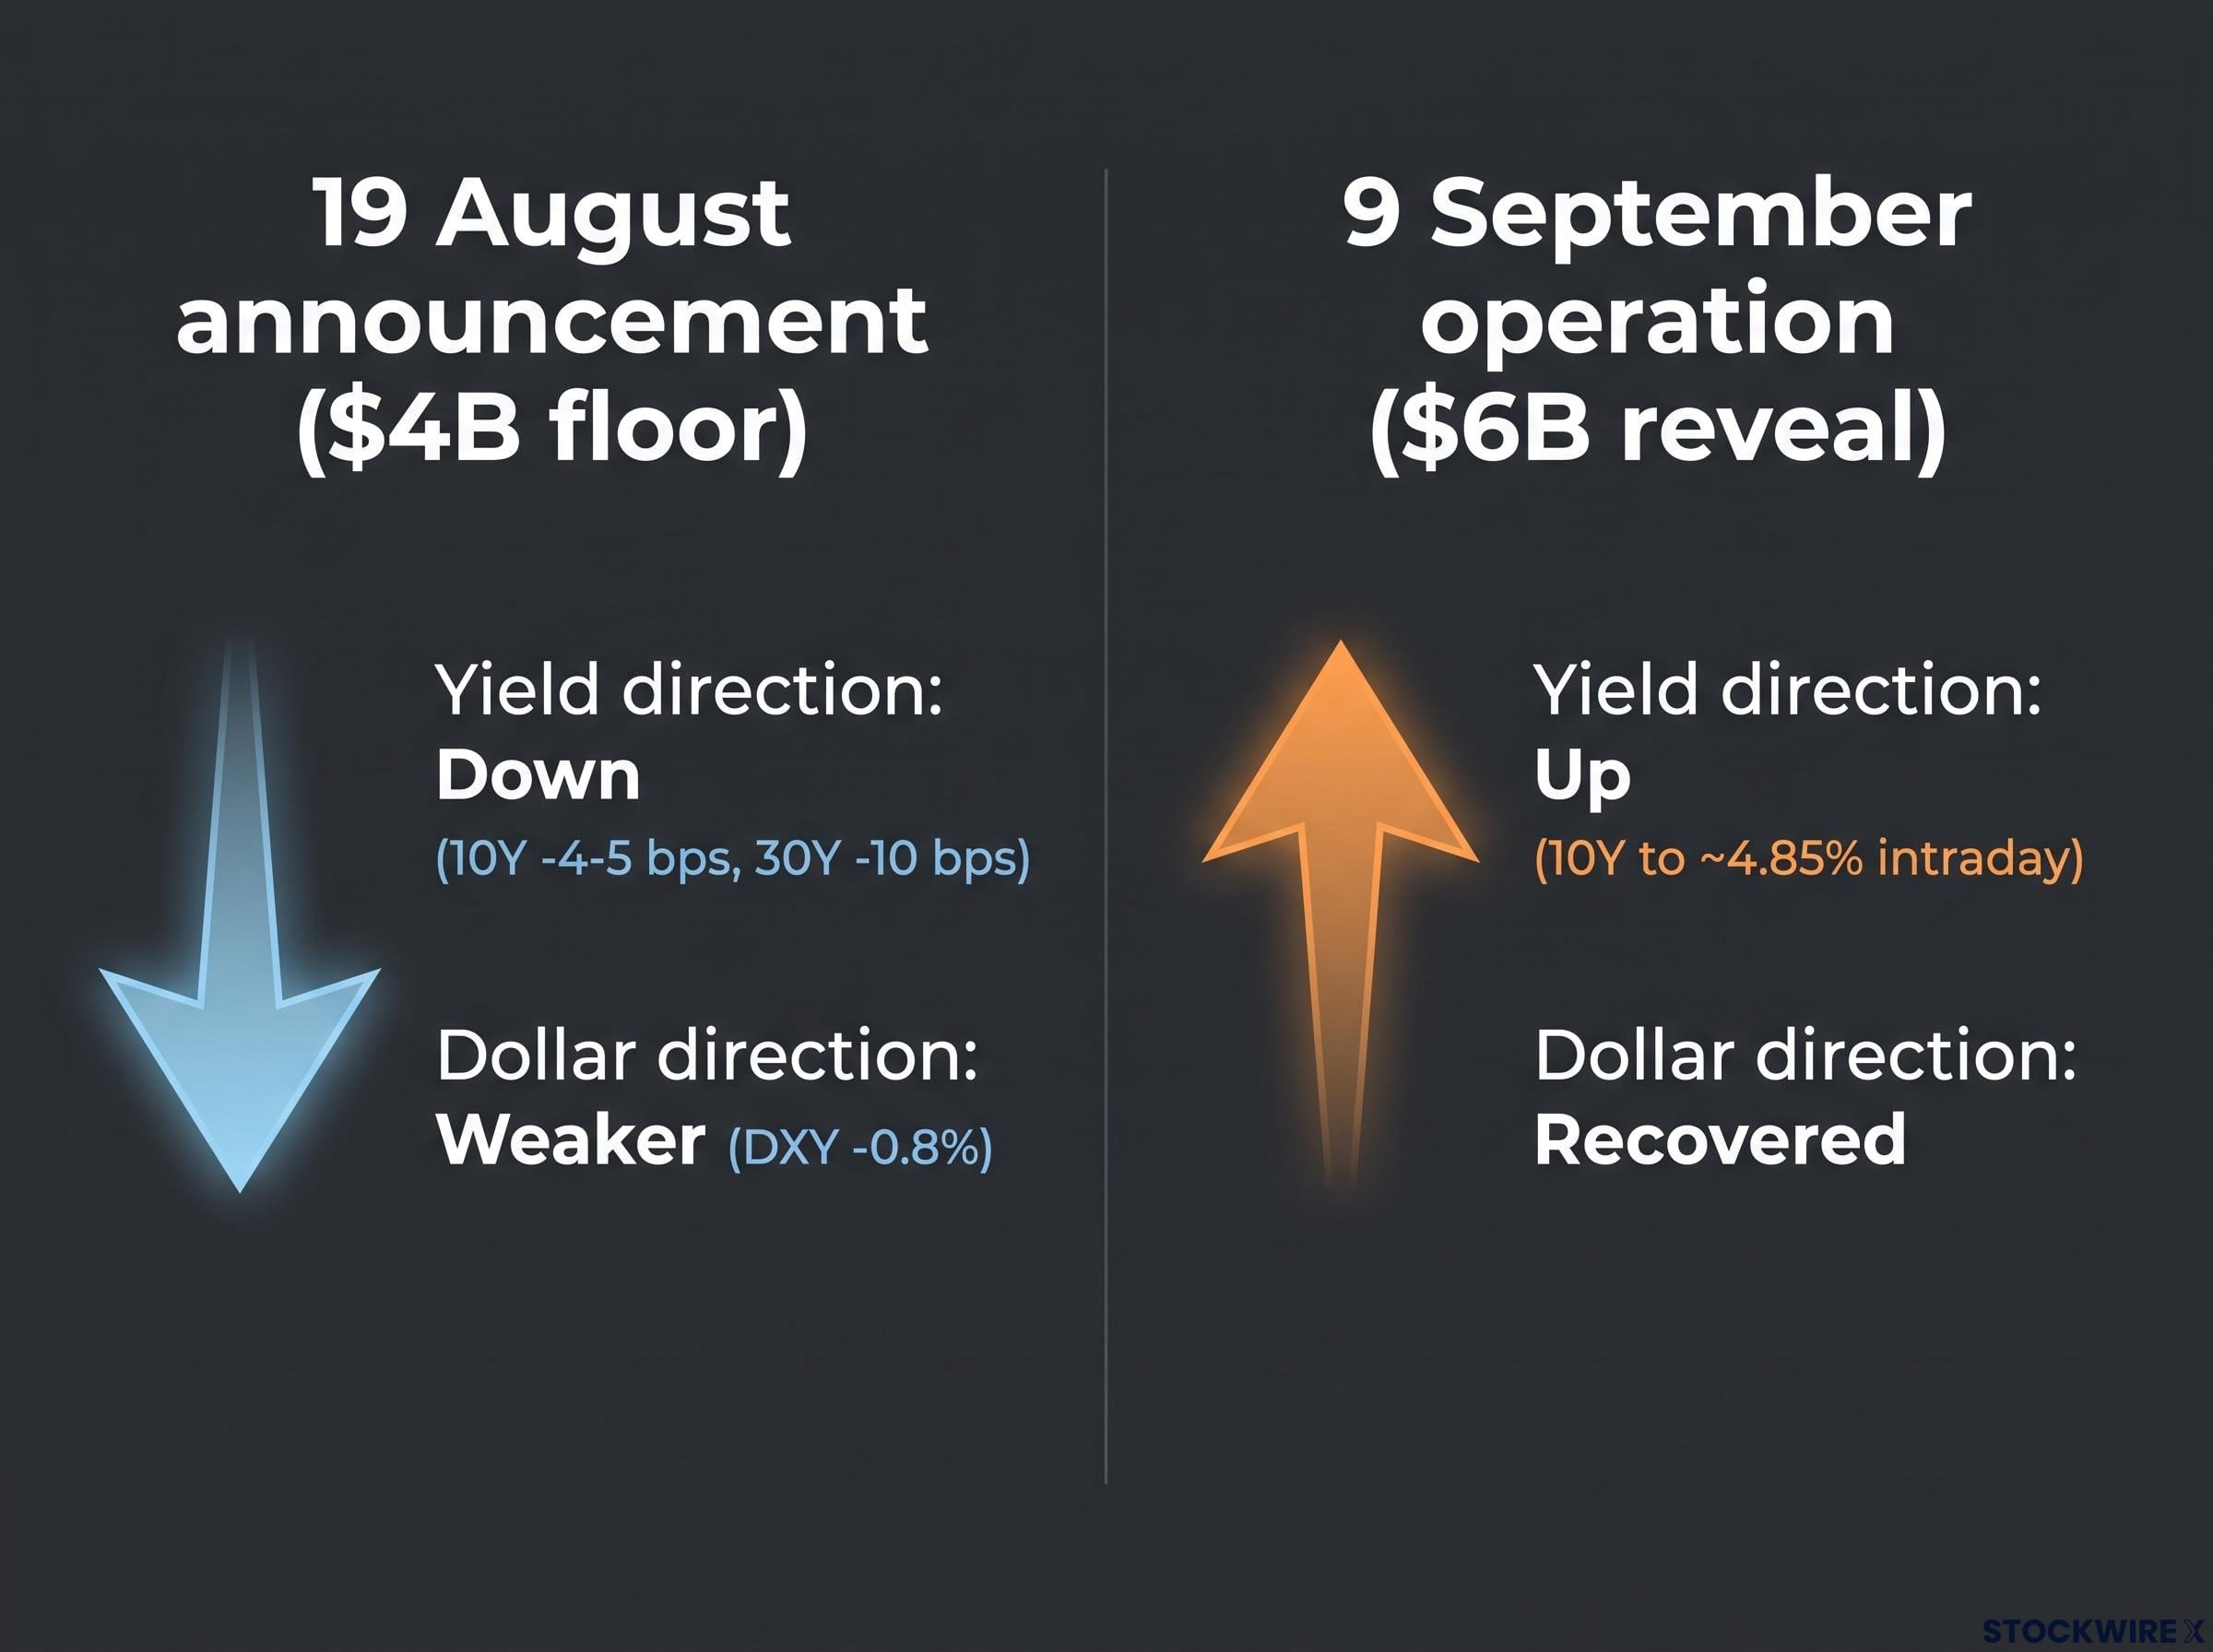
After the 19 August announcement, yields fell and the Dollar softened, exactly as the mechanism predicts. The 10-year yield declined roughly 4-5 basis points, the 30-year fell nearly 10 basis points, and the Dollar index dropped approximately 0.8% as investors rotated into gold and other assets.
Then came 9 September. The reveal of a $6 billion first operation pushed the 10-year yield higher, to approximately 4.85% intraday, its highest since November 2023, and partially reversed the earlier Dollar weakness.
The explanation sits in the expectations gap. The August announcement set a $4 billion floor, so markets priced that as the likely operation size. When the September reveal came in at $6 billion, the upside surprise drove yields the other way, because surprise direction determines the immediate response more than the underlying policy intention does.
That principle is worth holding onto, because it applies just as directly to inflation data. Market impact is not only about the policy itself. It is about how each new piece of information compares to what was already priced in.
| Trigger | Yield direction | Dollar direction | Magnitude |
|---|---|---|---|
| 19 August announcement ($4B floor) | Down | Weaker | 10Y -4-5 bps, 30Y -10 bps, DXY -0.8% |
| 9 September operation ($6B reveal) | Up | Recovered | 10Y to ~4.85% intraday |
There is a further complication. According to coverage from the Wall Street Journal and CNBC, yield declines from buybacks have been short-lived, with long-term yields rebounding as fiscal and inflation concerns reasserted themselves. The 10-year’s 4.80% close on 8 September sat well above its 12-month average of roughly 4.31%, which tells you the structural pull on yields runs upward even when buybacks provide temporary relief.
Saxo Bank frames the deeper point sharply: even at $4-6 billion per operation, the programme is “vanishingly small” relative to total market depth, yet it functions as a loud signal that the Treasury does not want higher yields, with real currency consequences regardless of the operation’s mechanical scale.
What the PPI and CPI numbers need to show before September 16
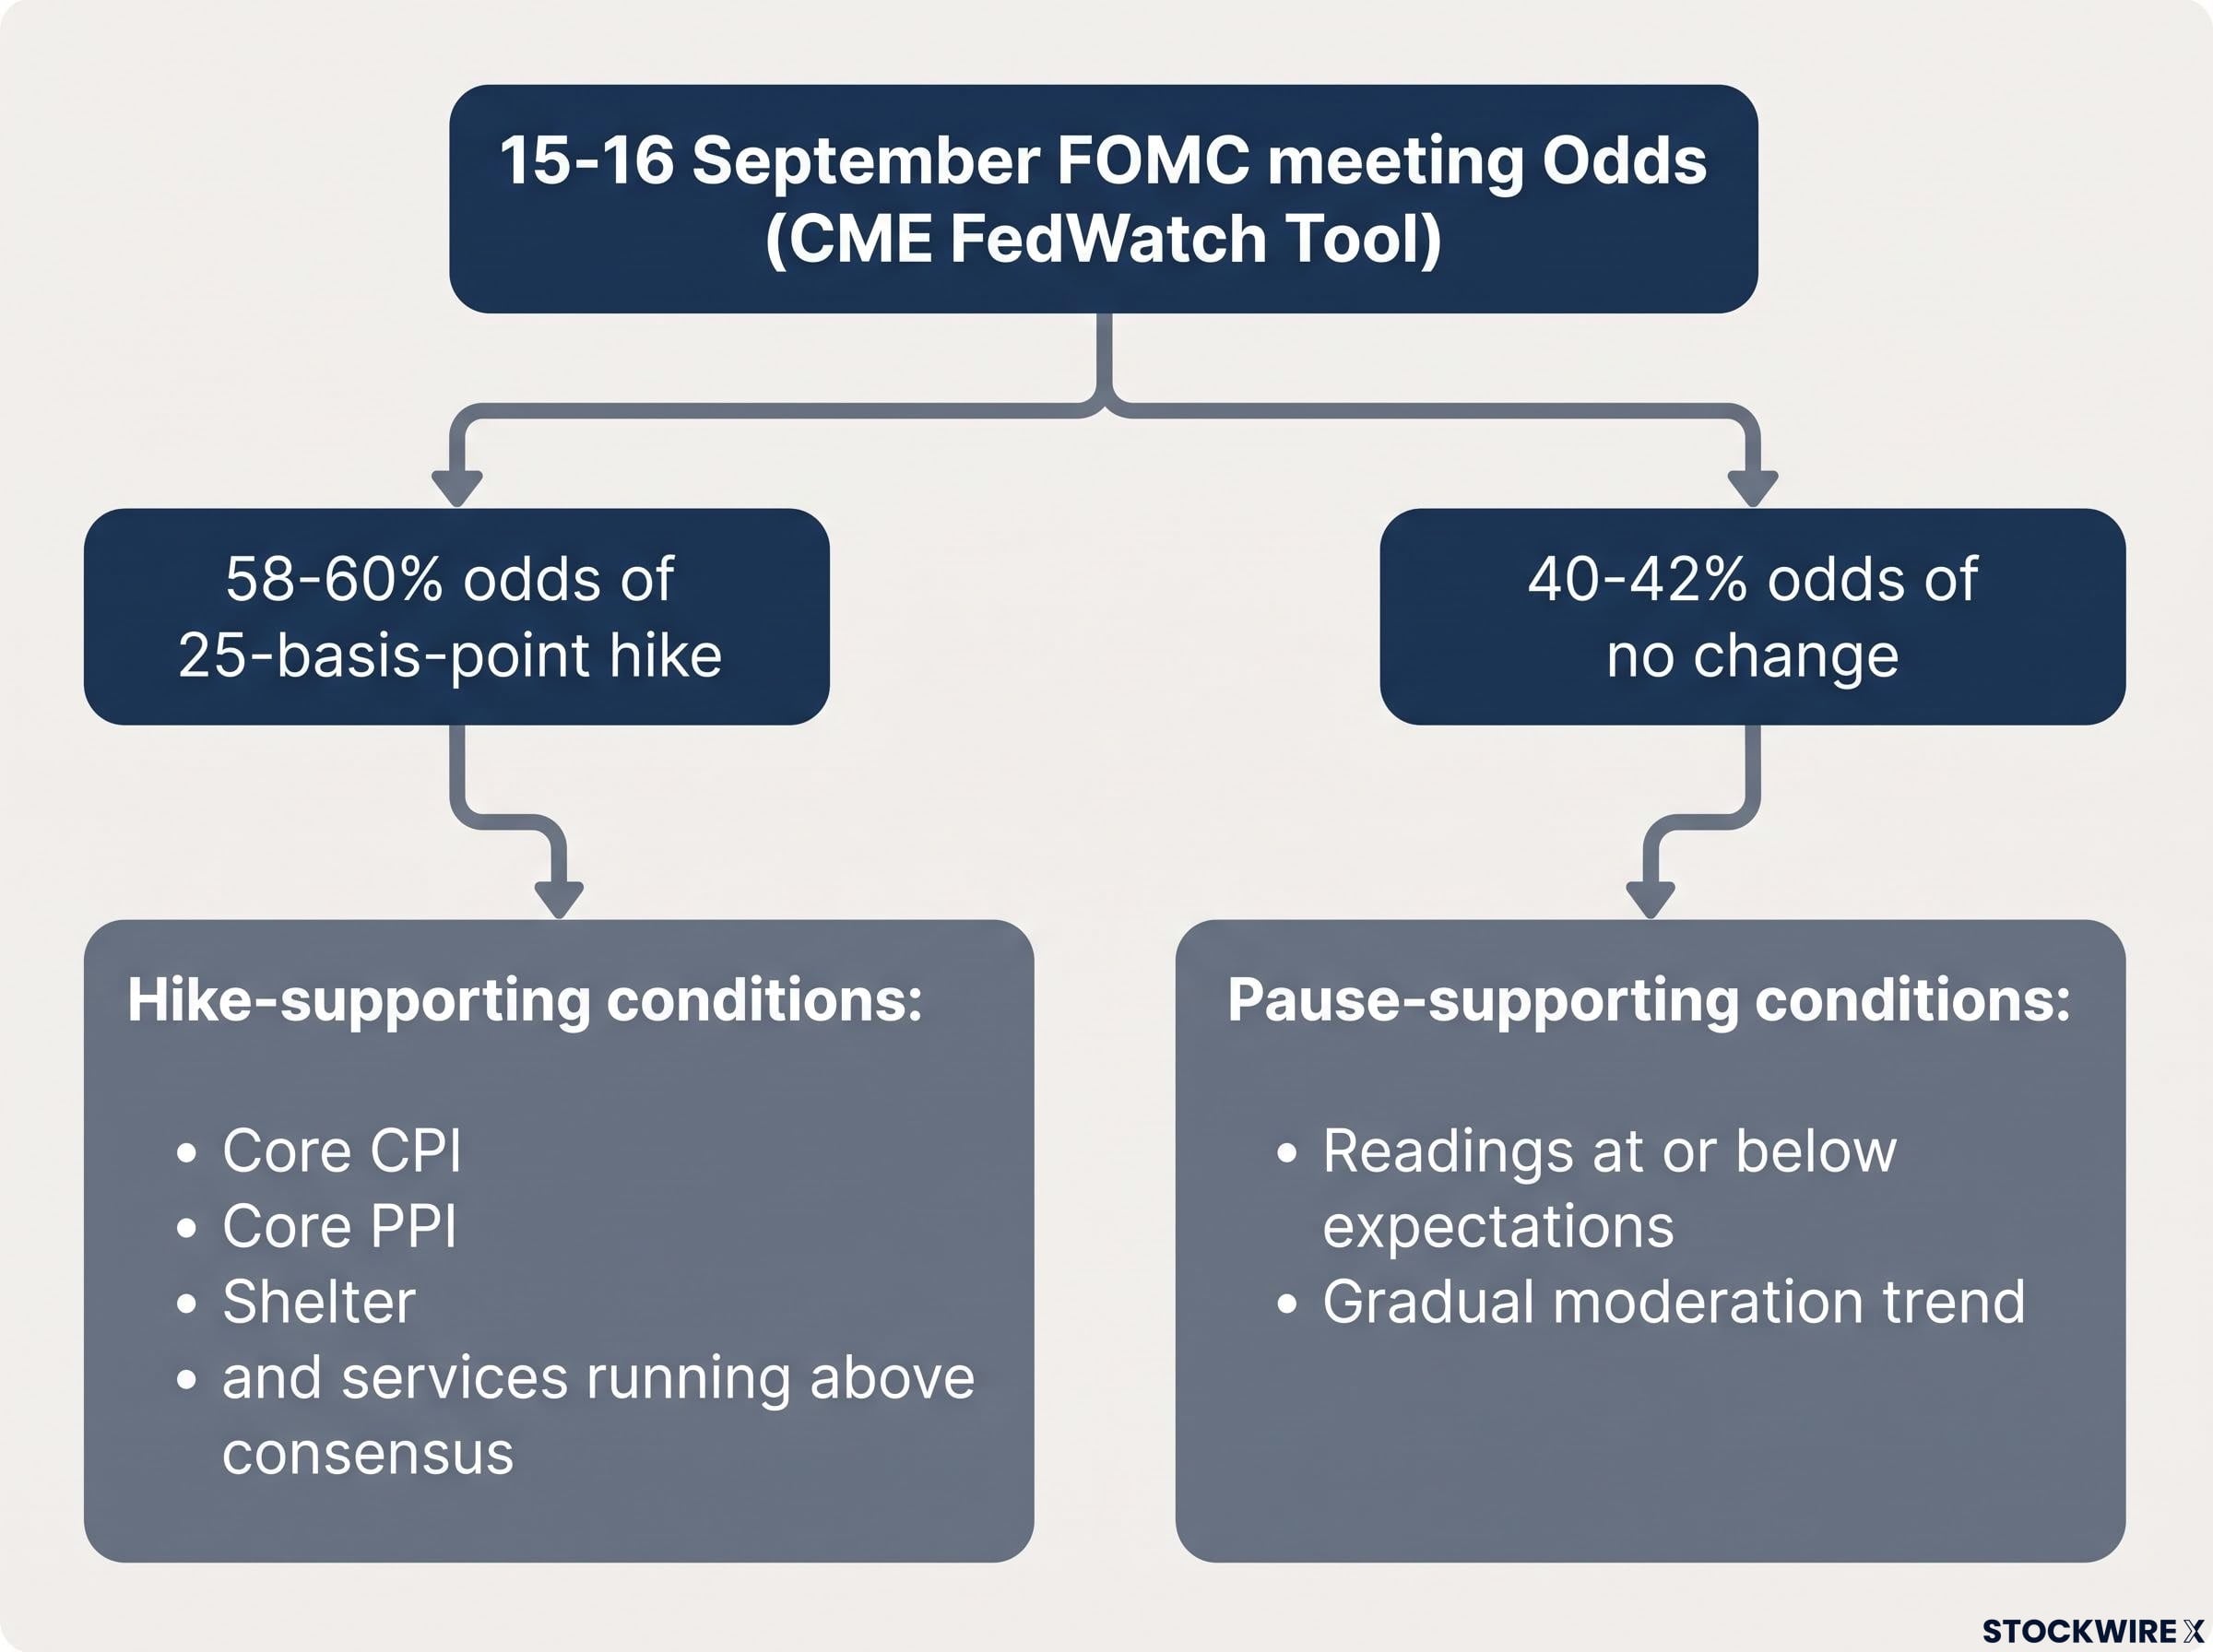
Two releases now sit between markets and the Fed. PPI is due Thursday, CPI is due Friday, both landing before the 15-16 September FOMC meeting. As of early September, the CME FedWatch Tool put the odds of a 25-basis-point hike at roughly 58-60%, with the balance of about 40-42% reflecting no change.
Approximately 60% of market pricing points to a 25-basis-point hike at the September meeting, per the CME FedWatch Tool.
Here is the decision tree you can actually use. Two threshold scenarios shape whether the data supports a hike or a pause:
- Hike-supporting conditions: Core CPI, core PPI, shelter, and services components running above consensus and showing renewed upward momentum. Reacceleration in the stickier price components is the signal that would bolster the case for tightening.
- Pause-supporting conditions: Readings at or below expectations that continue a gradual moderation trend, giving the Fed room to hold and monitor the cumulative effect of prior hikes.
Knowing which components matter, core, shelter, and services rather than just headline CPI, lets you interpret the releases in real time rather than waiting for analyst commentary after the fact.
Core CPI thresholds carry more weight than the headline number in Fed deliberations because shelter and services components signal durable inflation momentum rather than transitory energy-driven spikes, and a monthly reading at or above 0.3% is the specific level that meaningfully strengthens the hawkish case heading into September.
But there is a complicating factor that makes a perfectly in-line print anything but neutral.
The July lesson in relative surprise
Look at what happened with the July 2026 CPI. The reading met expectations, and yet the Dollar gained while the yen slipped, as traders pushed back the timing of a Fed hike. An in-line number was not a non-event.
The mechanism is positioning. When markets lean heavily hawkish into a release and the data fails to deliver an upside shock, the unwind of long-Dollar positions can move the currency more than the data itself would justify.
That tells you something practical about this week. Walking into Thursday and Friday heavily positioned for a hike and receiving an in-line print could itself trigger Dollar selling, even without a dovish surprise, because crowded positioning amplifies the move regardless of direction.
The dynamic also runs in reverse. A hotter-than-expected print into a market already near 60% priced for a hike may produce a smaller Dollar rally than the number seems to deserve, simply because much of the move is already in the price.
Four risks that could make the September call harder to read
None of what follows is a simple warning label. Each is a genuine tension point where credible analysts disagree, which is precisely why the September call is hard to read.
- Persistent inflation and fiscal pressure. Buybacks pulled yields lower only briefly.
- Buybacks as symbolic, not mechanical. The operations may be too small to matter as much as markets assume.
- Dollar-debasement risk underpriced. The adjustment may shift onto the currency rather than disappearing.
- Fed independence optics. Markets may wrongly assume Fed-Treasury coordination.
On the first, Reuters and the Wall Street Journal report that the buyback announcement pulled yields down only briefly before long-term yields rose again, as investors refocused on inflation and expanding government debt. That rebound implies bond investors are demanding a higher risk premium, which could force the Fed to stay hawkish even if market pricing leans toward a pause.
On the second, the Council on Foreign Relations frames buybacks as a liquidity-support measure, not a monetary policy tool. Some strategists argue that at $4-6 billion per operation, the programme is small enough that markets may be overreacting and overpricing hawkish Fed outcomes in response.
Saxo Bank The $4-6 billion operation size is “vanishingly small” relative to market depth, but a “loud symbolic signal that the Treasury does not want higher yields.”
On the third, Reuters’ “dollar-debasement fears” framing suggests that if buybacks successfully restrain long-end yields, the macro adjustment does not vanish. It shifts onto the currency instead, and rising gold and bitcoin prices may signal that markets are underpricing a weaker-Dollar path.
The financial repression framing adds a longer historical lens to the current programme: a sovereign exceeding 120% of GDP-to-debt using institutional tools to hold borrowing costs below unfettered market levels mirrors the 1942-1951 regime, and rising gold and bitcoin prices may reflect that markets are beginning to price that parallel into hard-asset allocations.
On the fourth, by openly signalling discomfort with higher yields, the Treasury raises questions about whether the Fed will act independently of that preference. Analysts caution that markets may misprice September by assuming coordination that the Fed may not deliver.
The Treasury’s approach sits closer to informal yield curve control than to outright debt monetisation: no published yield targets, finite and capped operations that expire automatically, and no Federal Reserve participation as backstop, which is precisely why the programme creates probabilistic resistance zones rather than binding ceilings on long-end yields.
Taken together, these four risks tell you that no single data point this week resolves the September call. Holding a firm opinion on either a hike or a pause before Thursday’s PPI and Friday’s CPI is premature.
What to watch before the September 16 decision lands
Two forces now sit on top of each other: a buyback programme actively suppressing yields, and an inflation dataset that may or may not justify further tightening. Here is the specific watch list for the next five days.
- Thursday’s PPI: the core reading versus consensus.
- Friday’s CPI: the core and shelter components versus consensus, not just the headline.
- 10-year yield: whether it holds above or breaks below 4.80% heading into the meeting, with 4.85% as the recent intraday marker.
- Dollar response: whether each print moves the Dollar index and USD/JPY, and by how much relative to expectations.
The two scenarios to prepare for are clear. If core CPI comes in below consensus, watch for the Dollar to give back some of its post-9 September gains as hike odds compress toward or below 50%. If core CPI beats consensus, watch for USD/JPY and the Dollar index to extend, potentially amplified by the buyback-suppressed yield backdrop creating a sharper relative move.
What you are really watching is two policy levers pulling in potentially opposite directions. A Treasury programme designed to hold yields down, and a Fed dataset that may demand higher rates. The 16 September decision, at the close of the two-day meeting, will reveal which one the market believes is in control.
The November 4 review as the next reset point
Whatever the FOMC decides, the buyback programme itself is scheduled for review at the 4 November 2026 Quarterly Refunding. That makes September one of two near-term structural events, with market participants watching whether the Treasury extends, expands, or scales back the enhanced operations as conditions evolve.
This article is for informational purposes only and should not be considered financial advice. Investors should conduct their own research and consult with financial professionals before making investment decisions. Past performance does not guarantee future results, and these statements are speculative and subject to change based on market developments.