Markets have already made up their minds about what happens on 17 September 2026. A quarter-point hike, roughly two-thirds priced, and back to work. That consensus is precisely what makes the alternative so dangerous to ignore.
Underneath the calm pricing sits the strongest Japanese corporate sentiment survey in years and a group of central bankers who now have the domestic cover to move faster than anyone expects. A 50-basis-point move has crept from unthinkable to merely improbable, and that shift matters far beyond Tokyo.
The reason is the yen. When Japan’s funding currency appreciates sharply, it can act as a margin call on trillions of dollars of leveraged positions worldwide, from US megacap technology to emerging-market currencies to your own portfolio.
This piece breaks down what the data actually supports ahead of the decision, how a Bank of Japan rate hike transmits through the global carry trade, and how gold and crude are likely to behave when rate differentials shift. The goal is a framework you can use before the announcement, not a scramble to react after it.
The data driving the historic 50-basis-point speculation
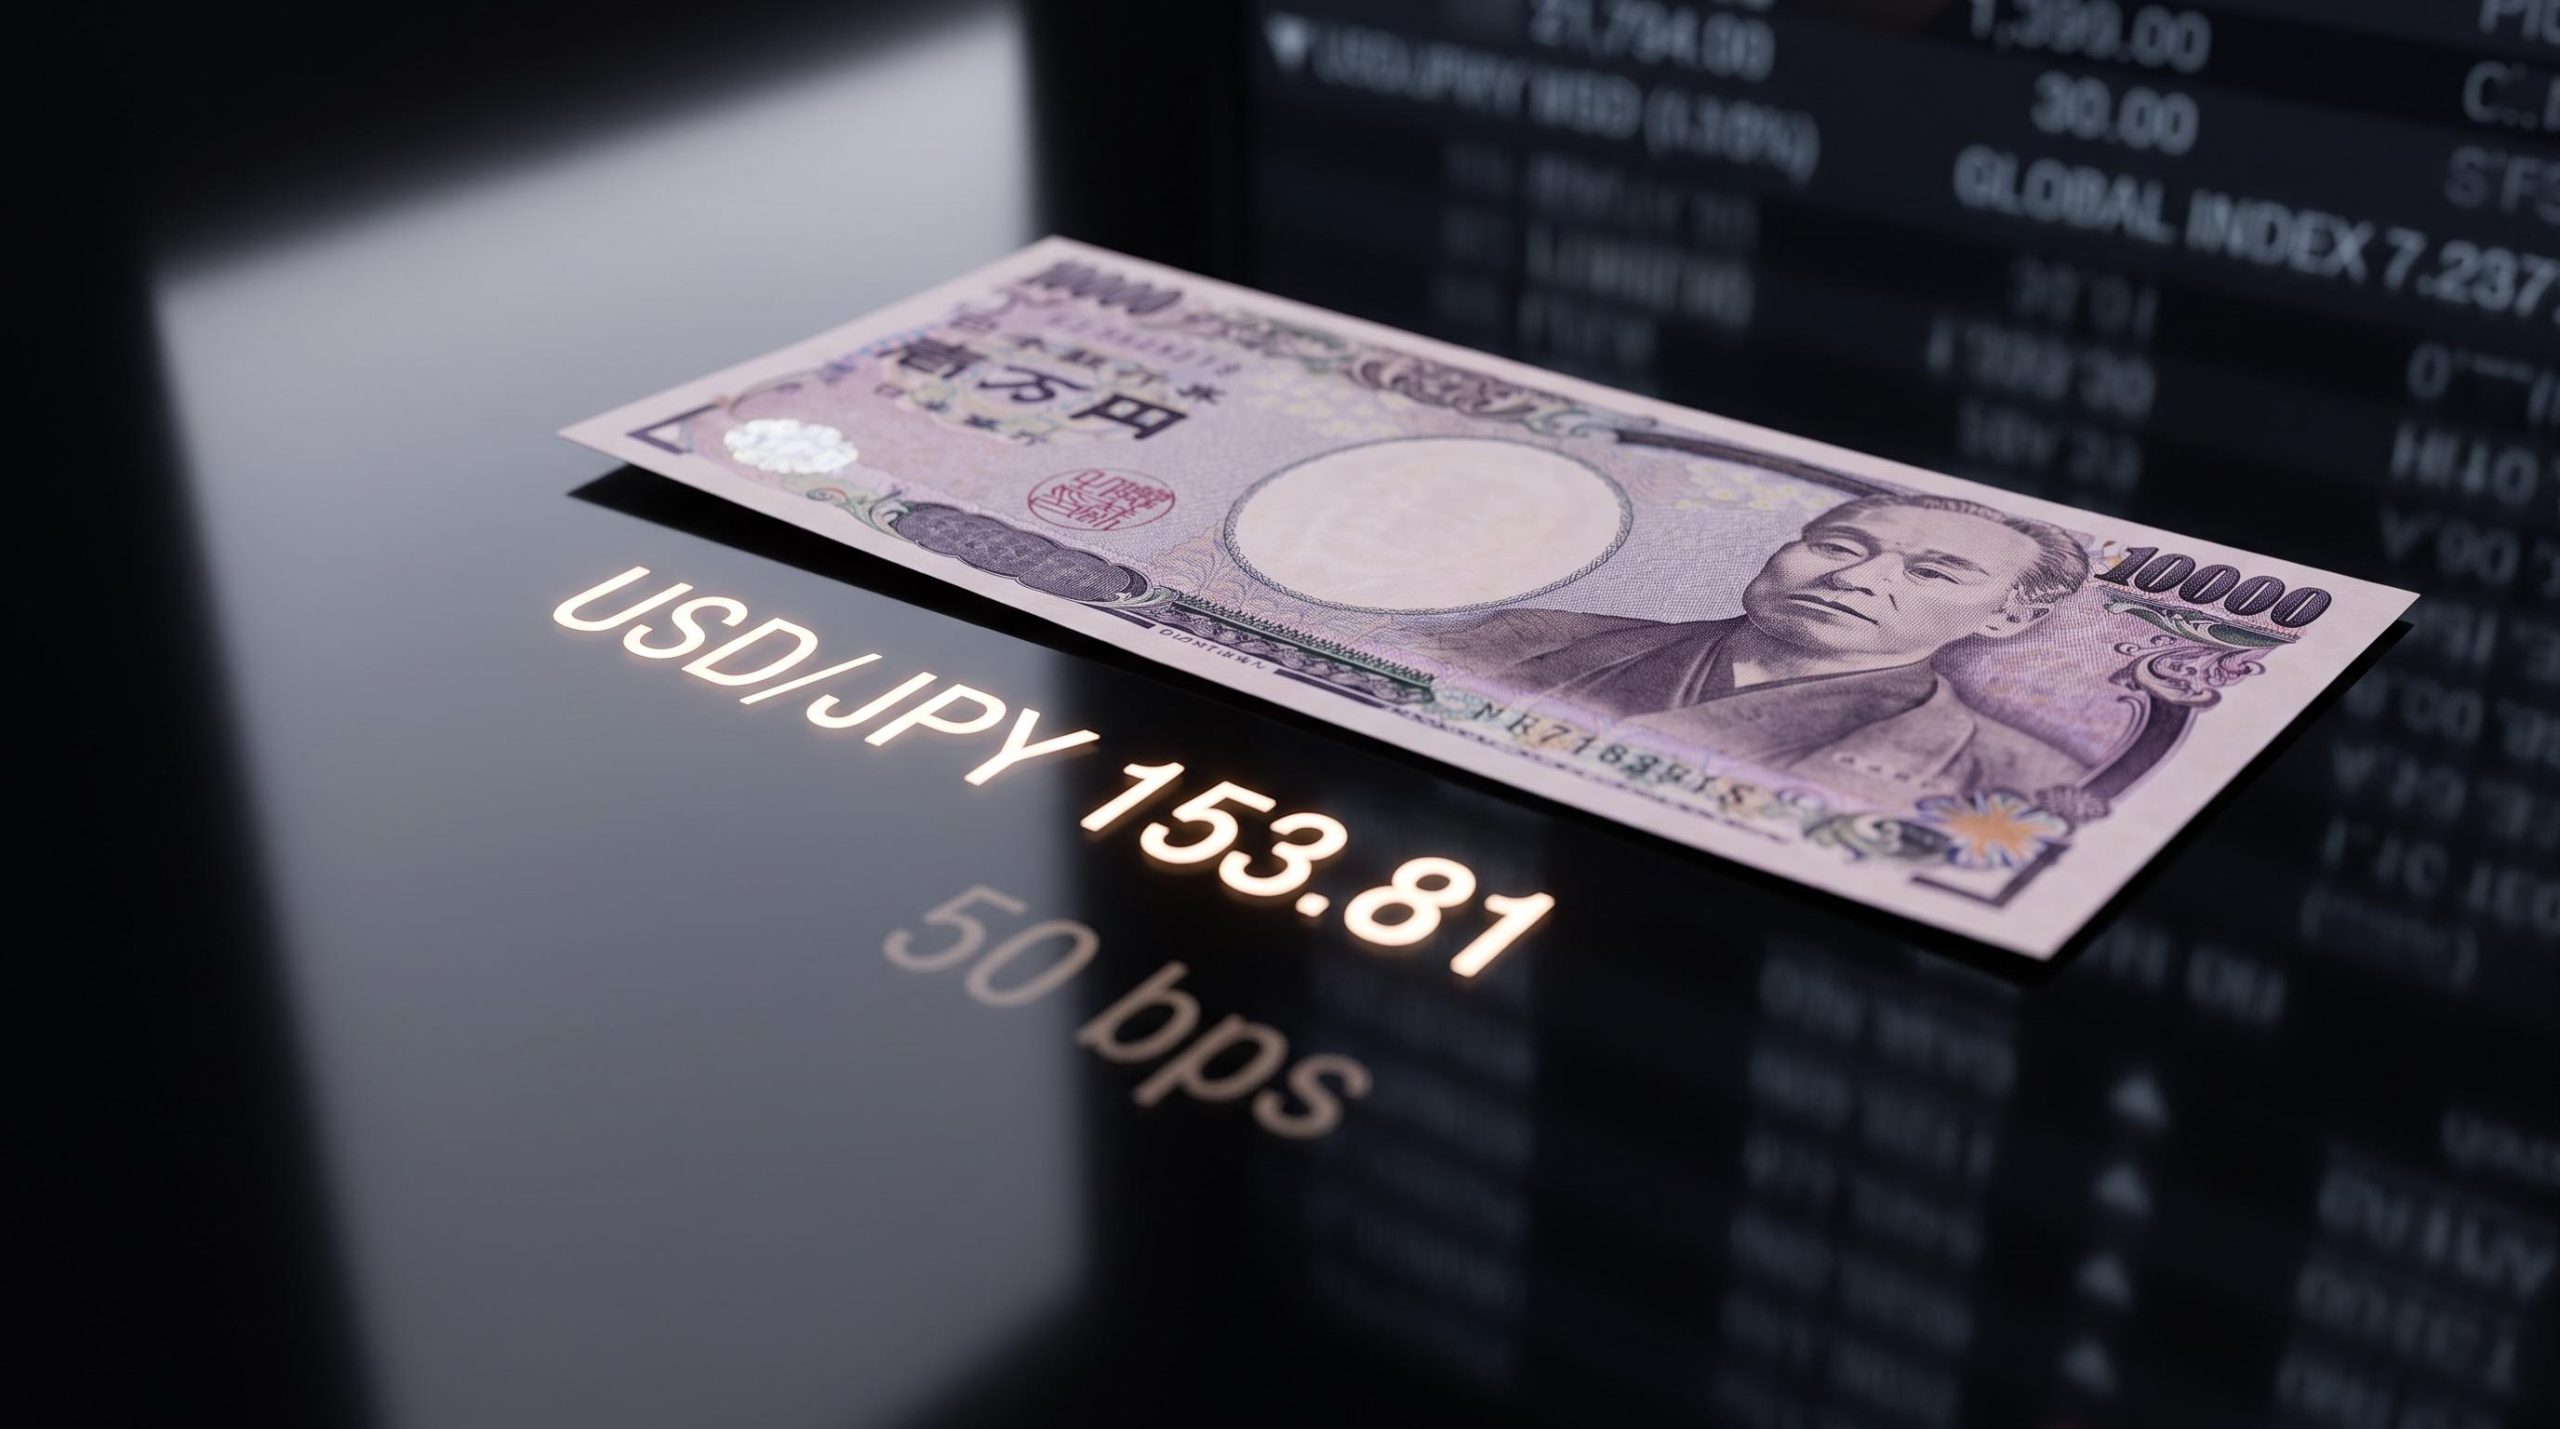
The dollar is telling one story. USD/JPY traded near 153.81 on 8 September 2026, with an intraday low around 152.89 and a weekly loss of roughly 1.81% against the yen. That is the currency drifting toward levels last seen about seven months earlier, and it reflects a market that increasingly expects the Bank of Japan to keep tightening.
Rates pricing tells a more precise story. According to Goldman Sachs, cited by CNBC, markets are pricing approximately a 65% chance of a 25-basis-point hike to 1.25% in September, with a separate BoJ probability tracker putting the figure at 64.1% as of 8 September 2026. Around 40 basis points of cumulative tightening is priced by year-end.
The base case, then, is boring: a measured quarter-point step from the current 1.0% rate set in June 2026. What the consensus does not capture is the tail. A 50-basis-point hike would be the Bank’s first since 1989, and the fundamental data gives that outlier more oxygen than a 64% headline suggests.
The June 2026 rate decision that moved the benchmark to 1.0%, the highest level since 1995, was accompanied by a structured bond tapering schedule reducing monthly JGB purchases by approximately 200 billion yen per quarter, compressing the carry trade’s borrowing-cost advantage from both the rate and the balance-sheet side simultaneously.
Here is how the immediate picture reads:
| Metric | Current September 2026 level | Market implication |
|---|---|---|
| USD/JPY | 153.81 (intraday low 152.89) | Yen strengthening on tightening expectations |
| 25 bp hike probability | 64-65% | Quarter-point move is the base case, not certainty |
| Goldman terminal rate forecast | 1.5-1.75% by mid-2027 | Gradual, stepwise normalisation path |
The read for your portfolio is this: the market is pricing a standard hike, but the corporate data below is strong enough that you should be positioned for a shock, not surprised by one.
Corporate sentiment and the case for accelerated tightening
The September 2026 Reuters Tankan survey, published 8 September 2026, put manufacturers’ sentiment at +21, up from +18 in August and just +7 in April, its highest reading in nearly five years. Non-manufacturers came in around +29, supported by strong domestic demand and services activity.
Reuters treats this survey as a leading indicator for the Bank’s own quarterly Tankan, and the breadth of the optimism is what matters. When confidence is broad-based across factories and services alike, policymakers can argue that raising rates will not immediately choke off growth.
That is the fundamental justification for sustained tightening. Robust demand hands the central bank the confidence to keep moving, and it is exactly the kind of backdrop that keeps a 50-basis-point surprise credible even when it is not the consensus.
When big ASX news breaks, our subscribers know first
How the yen carry trade transmits local hikes to global portfolios
To understand why a Tokyo rate decision can move a US technology stock, you need to understand the plumbing that connects them. That plumbing is the yen carry trade.
The mechanics are simple. Investors borrow yen at very low Japanese interest rates and use the cash to buy higher-yielding assets elsewhere, pocketing the difference. The trade works beautifully when Japanese rates stay low, markets stay calm, and the yen stays weak or stable.
The yen carry trade mechanics that make this transmission so persistent are rooted in a structural carry spread that, even at current BoJ rates, still leaves yen-funded investors with roughly 2.5 percentage points of yield advantage over US dollar assets, which is why the trade rebuilt so quickly after the August 2024 episode.
The problem arrives when any of those conditions breaks. If the Bank of Japan raises rates or the yen suddenly appreciates, borrowing costs climb and the currency move erases the profit. Investors are then forced to sell their foreign assets and buy back yen to repay their loans, often all at once.
That forced selling is what makes an unwind so violent. The sequence looks like this:
- Investors borrow cheap yen and buy higher-yielding foreign assets, from US equities to emerging-market bonds.
- A rate hike or risk shock pushes the yen sharply higher, wiping out the carry profit.
- Rising funding costs and margin pressure force investors to raise cash fast.
- They liquidate foreign assets and buy yen to close positions, accelerating the yen’s rise and feeding the cycle.
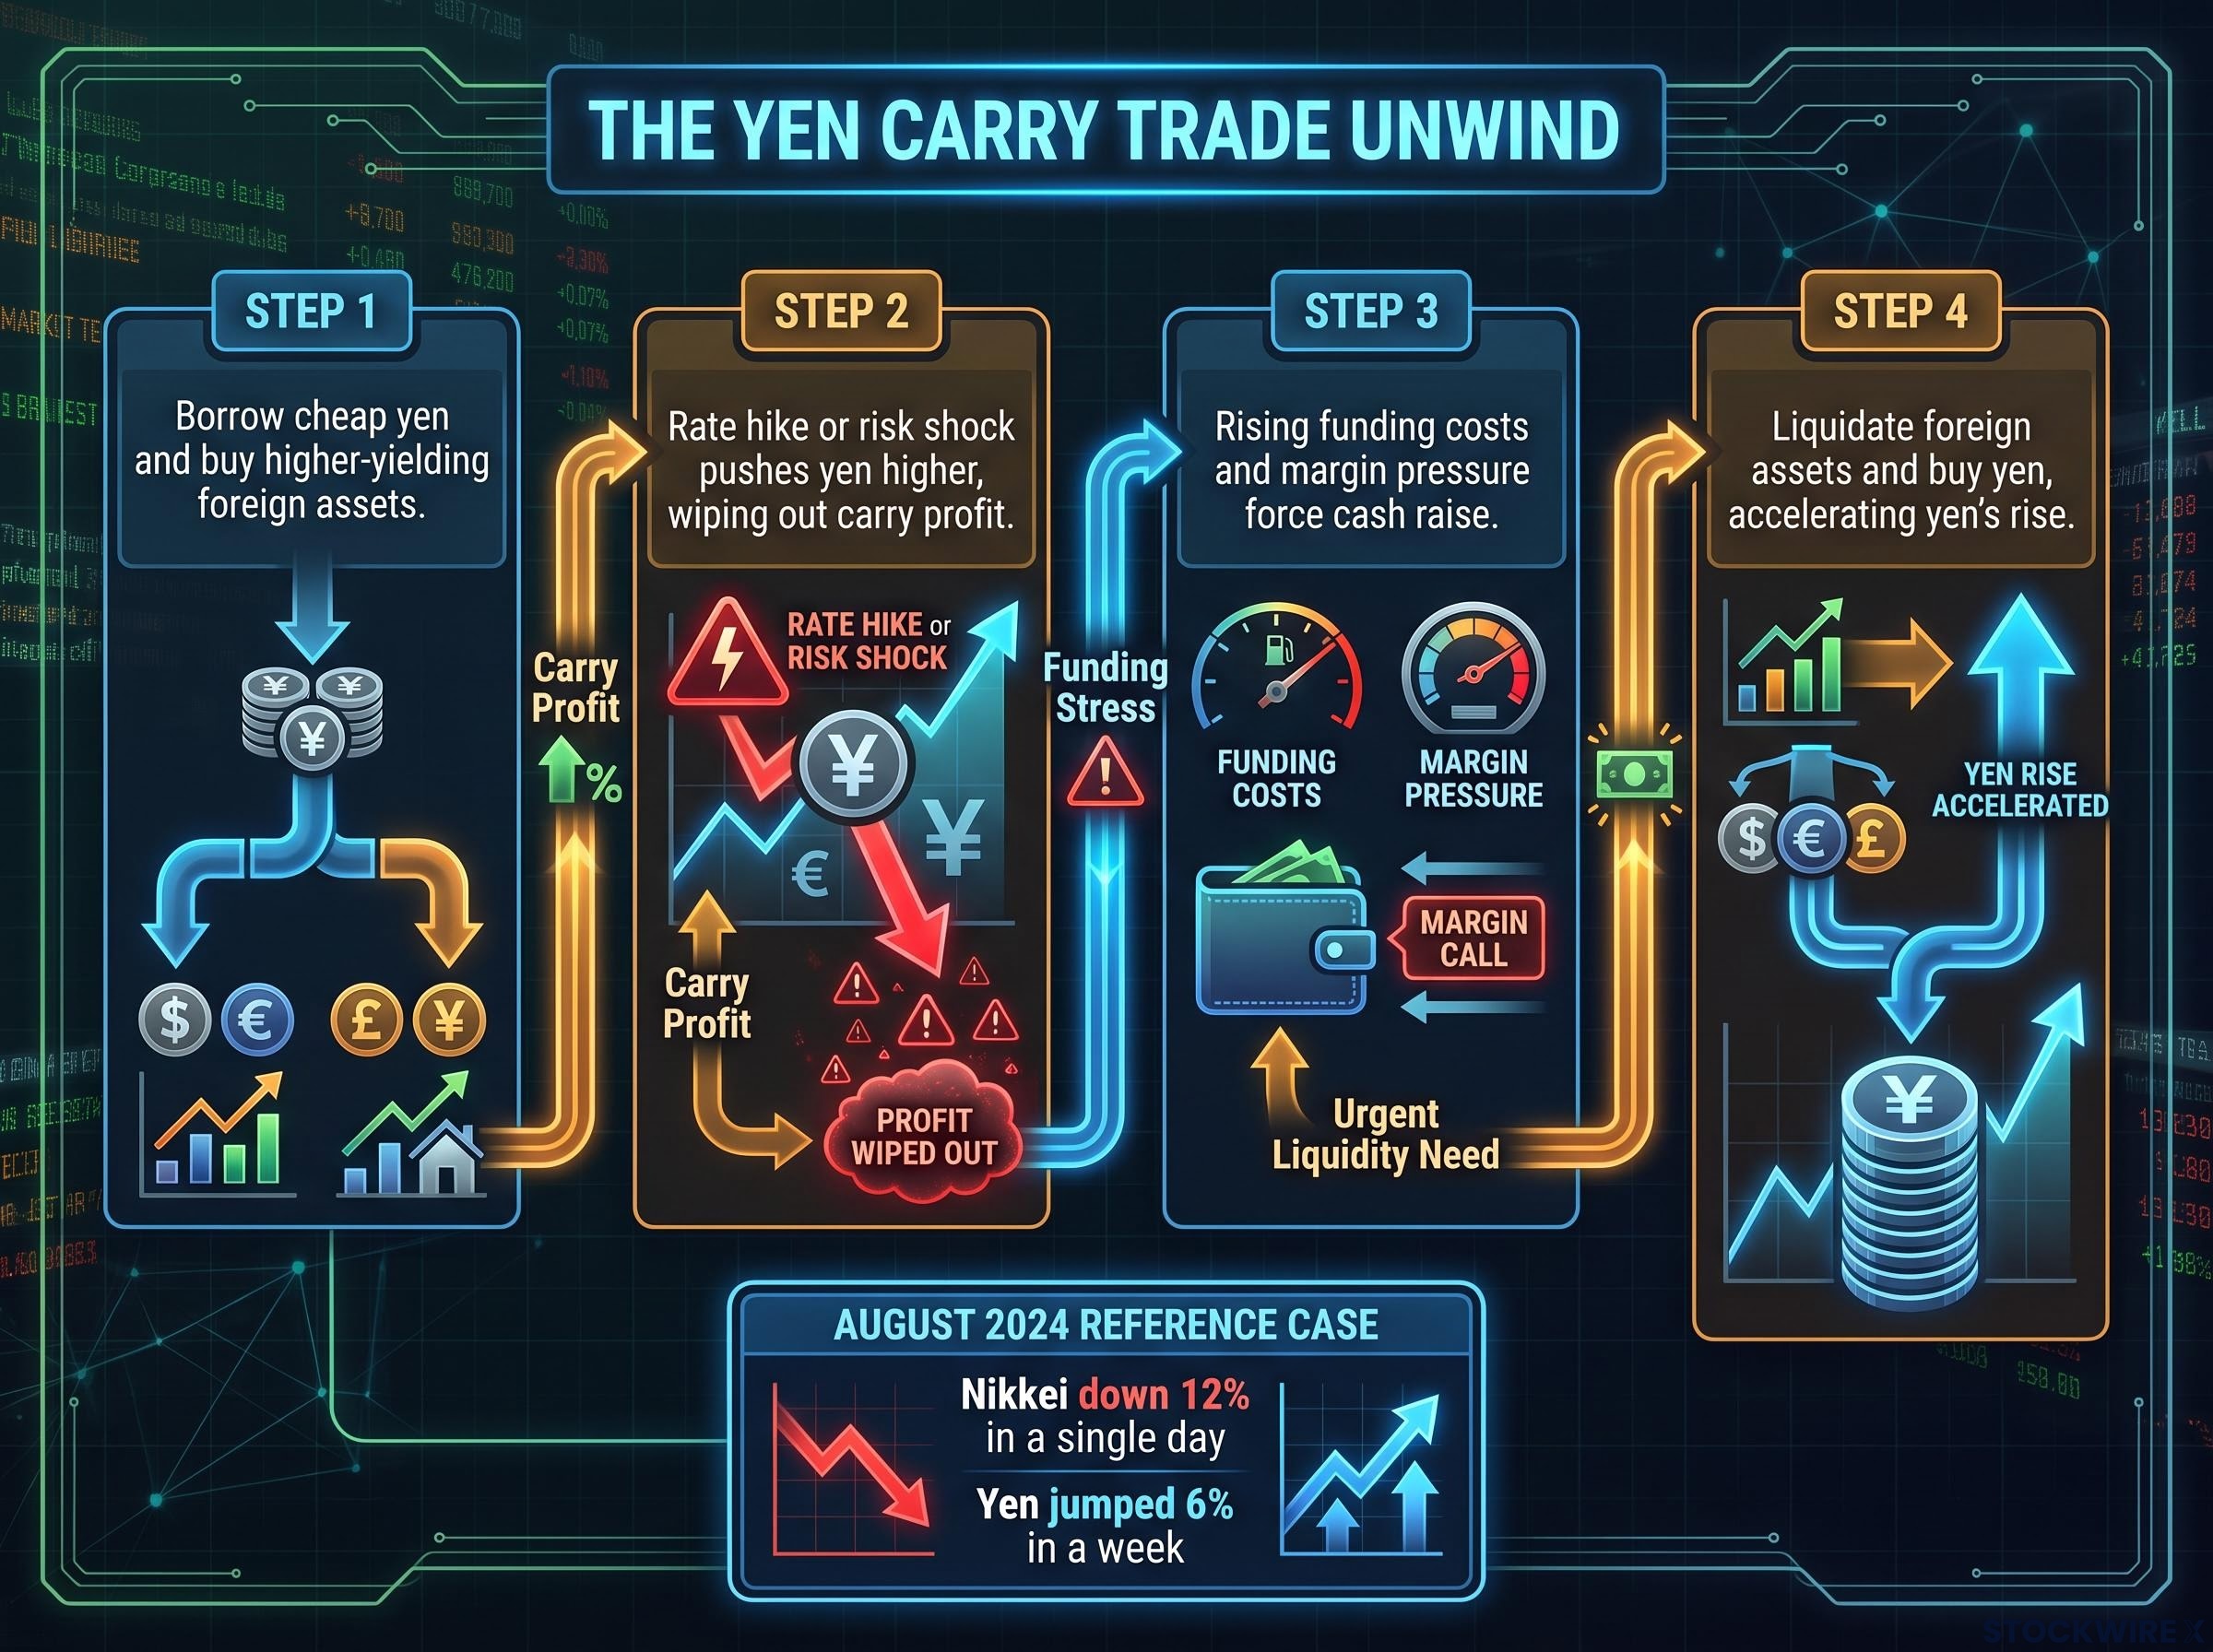
The August 2024 episode is the reference case. A BoJ hike at the end of July 2024 collided with a weak US jobs report, and the unwind that followed sent Japan’s Nikkei down roughly 12% in a single day, its worst drop since 1987. The yen jumped about 6% in a week.
The yen carry trade has been described by JPMorgan as the biggest carry trade seen in more than 30 years. UBS estimated at least $500 billion in dollar-yen carry exposure existed before the August 2024 unwind, with roughly $200 billion closed within two to three weeks.
The assets most exposed are exactly the ones many global investors hold. High-yield emerging-market currencies, leveraged US megacap technology positions, and credit built on cheap yen funding all sit in the blast radius. JPMorgan analysts Junya Tanase and Ikue Saito estimate that a full unwind of large short-yen positions could push USD/JPY into the 142-146 range.
The point for you is direct. A rising yen behaves like a global margin call, and it can threaten leveraged positions far from Japan, including holdings you may own in US tech or emerging markets.
Gold, crude, and the multi-asset ripple effect
Shift from mechanics to markets, and the picture gets more textured. Spot gold traded near $4,400-$4,410 per ounce in early September 2026, advancing more than 1% on 9 September as sustained dollar selling, itself partly a function of yen strength, lifted the metal off a one-week low.
The relationship between gold and the yen is not direct causation. According to Goldmoney research, both assets tend to strengthen for the same underlying reasons: falling US real yields and rising demand for safe havens. When the US-Japan rate differential narrows and real yields drop, gold and the yen often rise together.
That makes yen strength a useful concurrent signal for gold’s medium-term direction. Kitco argued in July 2024 that the correlation between the yen and gold had reappeared, and that a rising yen could be positive for the metal because it reflects the same shift in rate and risk dynamics.
There is a catch, and it is important. During an acute carry unwind, correlations break. In July 2024, gold fell about 1.3% to roughly $2,365 per ounce even as the yen surged, because forced de-leveraging pushed investors to sell everything liquid, gold included, to raise cash.
Here is the split you need to hold in mind:
- Medium-term structural drivers: falling US real yields, a softer dollar, and safe-haven demand all support gold, and yen strength tends to coincide with that environment.
- Short-term liquidity risk: in the first hours of a rate shock, a carry unwind can force gold down alongside equities as leveraged players scramble for cash, regardless of the bullish backdrop.
The interpretation for your holdings: a strengthening yen generally signals an environment that supports gold over the medium term, but you should expect, and look past, sharp correlation-breaking sell-offs in the immediate aftermath of a shock.
Geopolitical premiums and energy market volatility
Oil is digesting a different pressure. WTI crude traded near $92 per barrel in the European session on 9 September 2026, with TradingEconomics quoting $92.30 on 8 September after Reuters reported a settlement of $90.22 on 1 September, a jump of 5.2% on renewed US-Iran supply concerns.
The driver is geopolitical. Escalating Middle East tensions, with market focus on threats to the Strait of Hormuz, pushed WTI to its highest level since early June and added to the broader risk-off mood that monetary uncertainty was already feeding.
One signal underlines the stress. The US diesel crack spread, which measures the premium of ultra-low sulphur diesel futures over crude, reached an intraday record above $102 per barrel for the first time. That kind of reading tells you the strain sits in refined products and supply routes, not just headline crude, and it compounds the cautious positioning a possible rate shock encourages.
The Plaza Accord parallel and what constrains policymakers
Aggressive tightening is not a free option, and history explains why. According to the original source, Rabobank has drawn a parallel between the current BoJ deliberations and the economic tensions of the late 1980s, including the Plaza Accord era, when coordinated currency adjustment collided with global market stability.
A 50-basis-point hike would be the Bank of Japan’s first such move since 1989. The Plaza Accord parallel frames the central tension policymakers face: necessary currency normalisation on one side, and the risk of destabilising global markets on the other.
The first domestic constraint is exports. A sustained yen rally erodes the price competitiveness of Japanese exporters, squeezing their margins even as it lowers import costs, and historically that has weighed on domestic equities when the currency climbs.
The second, and larger, constraint is fear of deflation. A 2 September 2026 BoJ speech explicitly raised concern about whether the economy could run the risk of returning to deflation, underlining why the institution favours a gradual path. This is the primary governor on how fast the Bank is willing to go.
Not everyone on the board is equally cautious. Bloomberg reported that Board Member Hajime Takata, one of the more hawkish policymakers, left the door open to an outsized rate increase and even back-to-back hikes, which nudged the yen higher. Analysts still treat that as data-dependent rather than the central expectation.
The July hold decision, carried 8-1 with Board Member Hajime Takata as the named dissenter explicitly pressing for an immediate move to 1.25%, established the baseline from which September pricing is anchored and gave hawkish policymakers a formal record of dissent to cite in the upcoming deliberations.
Understanding this deep institutional fear of deflation helps you gauge how far the Bank will let the yen run before it moves to protect exporters and cap the rally.
Navigating portfolios through the next phase of normalisation
The framework across these assets points to one conclusion: Japanese monetary policy is now a primary driver of global market architecture, not a regional footnote. A single funding currency links leveraged positions across equities, credit, and commodities worldwide.
A 25-basis-point move is priced, and on its own it is manageable. The systemic fragility comes from the accumulated scale of global carry positioning, which is why the tail risk of a 50-basis-point shock deserves more attention than its probability alone suggests.
The 17 September 2026 decision, and the forward guidance that follows, is the next pivot point for cross-asset volatility. Watch the guidance as closely as the rate itself.
For readers wanting to understand the other side of the yen normalisation story, our full explainer on Japanese equity dynamics covers how the MSCI Japan Index returned 15.7% in USD terms in the first half of 2026 despite the yen hitting 40-year lows, including the structural governance and earnings drivers that can persist alongside a rising yen.
This article is for informational purposes only and should not be considered financial advice. Investors should conduct their own research and consult with financial professionals before making investment decisions.
Past performance does not guarantee future results, and forward-looking projections are subject to market conditions and various risk factors. Statements about future policy and market moves are speculative and subject to change based on data and central bank decisions.