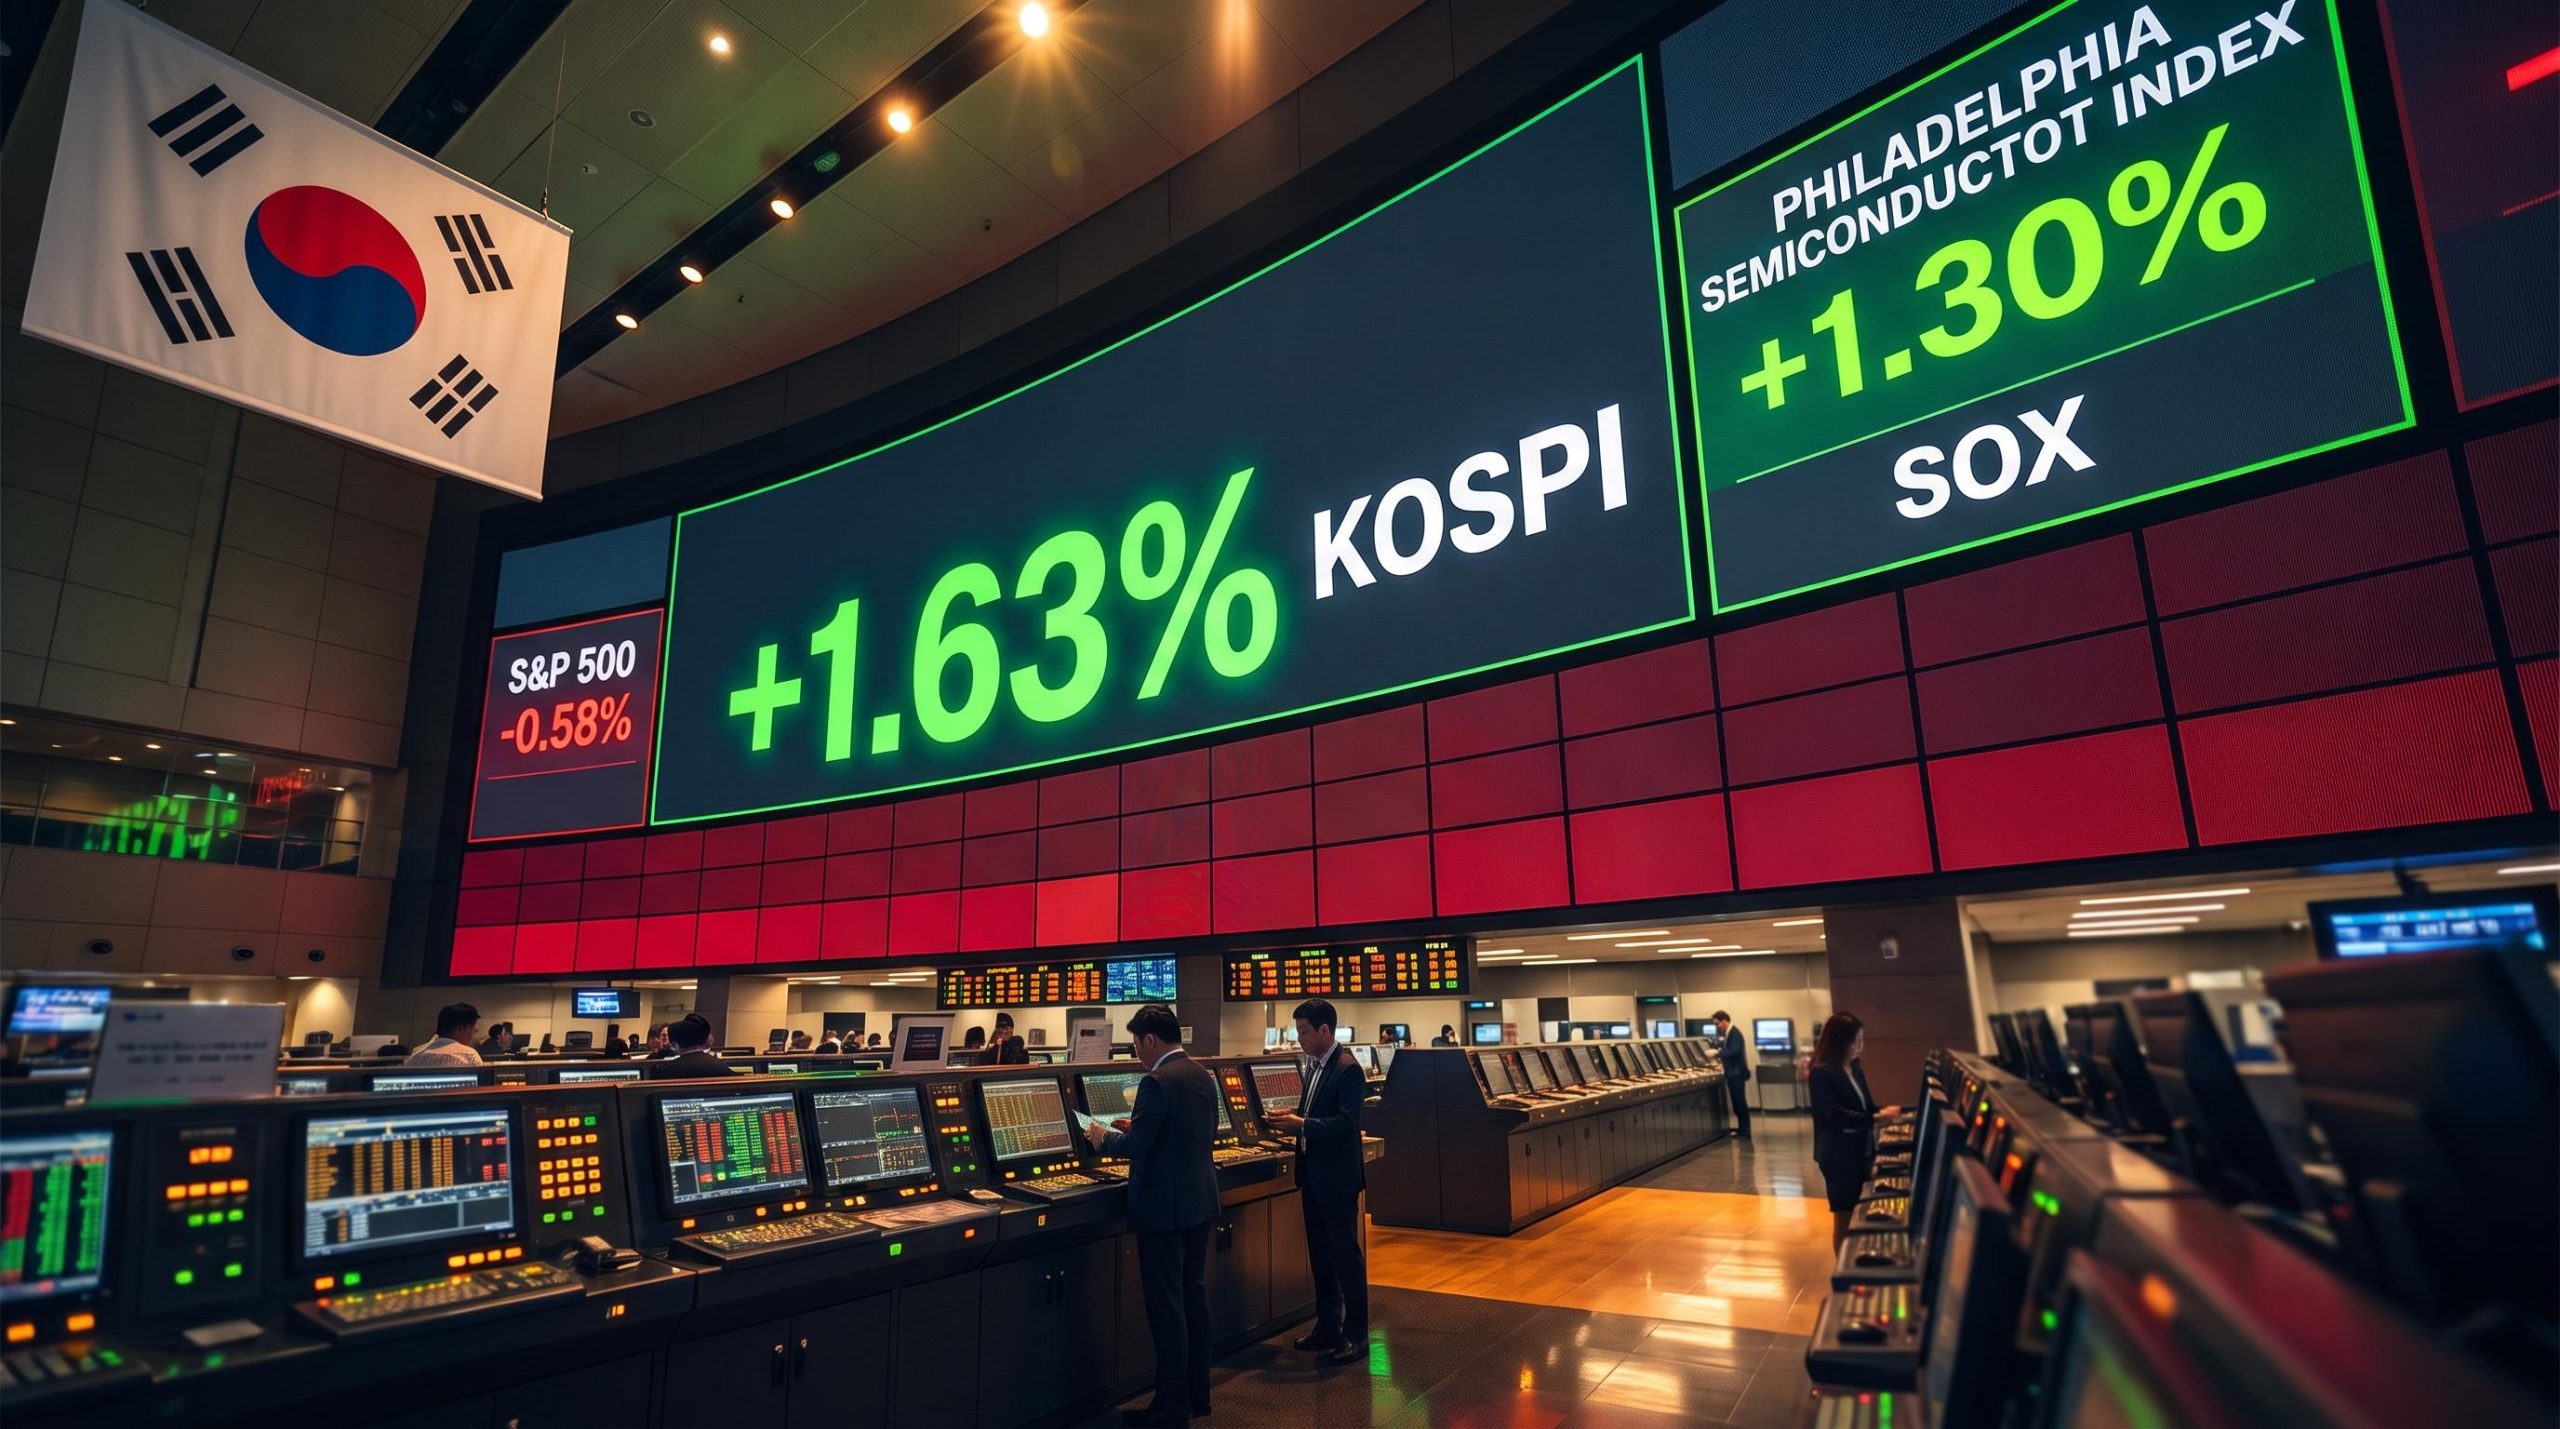
On 8 September 2026, more than seven in ten S&P 500 stocks closed lower, yet the Nasdaq barely flinched, because one sector refused to give way.
The surface data reads like a broad retreat: a weak US session, a flat Europe, and a range-bound Asia. Beneath it sits a more specific story. The Philadelphia Semiconductor Index posted its fourth straight gain, rising 1.30%, and South Korea’s KOSPI surged 1.63% to outrun every other major regional market.
Those two data points explain more about global markets right now than any headline index figure. This piece breaks down what drove each region’s session, why chipmakers are pulling away from the broader market, and what the session’s patterns suggest for the days ahead. Here is what the numbers actually tell you about which forces are steering global equities today.
When most of the S&P 500 fell but the Nasdaq held, chipmakers were the reason
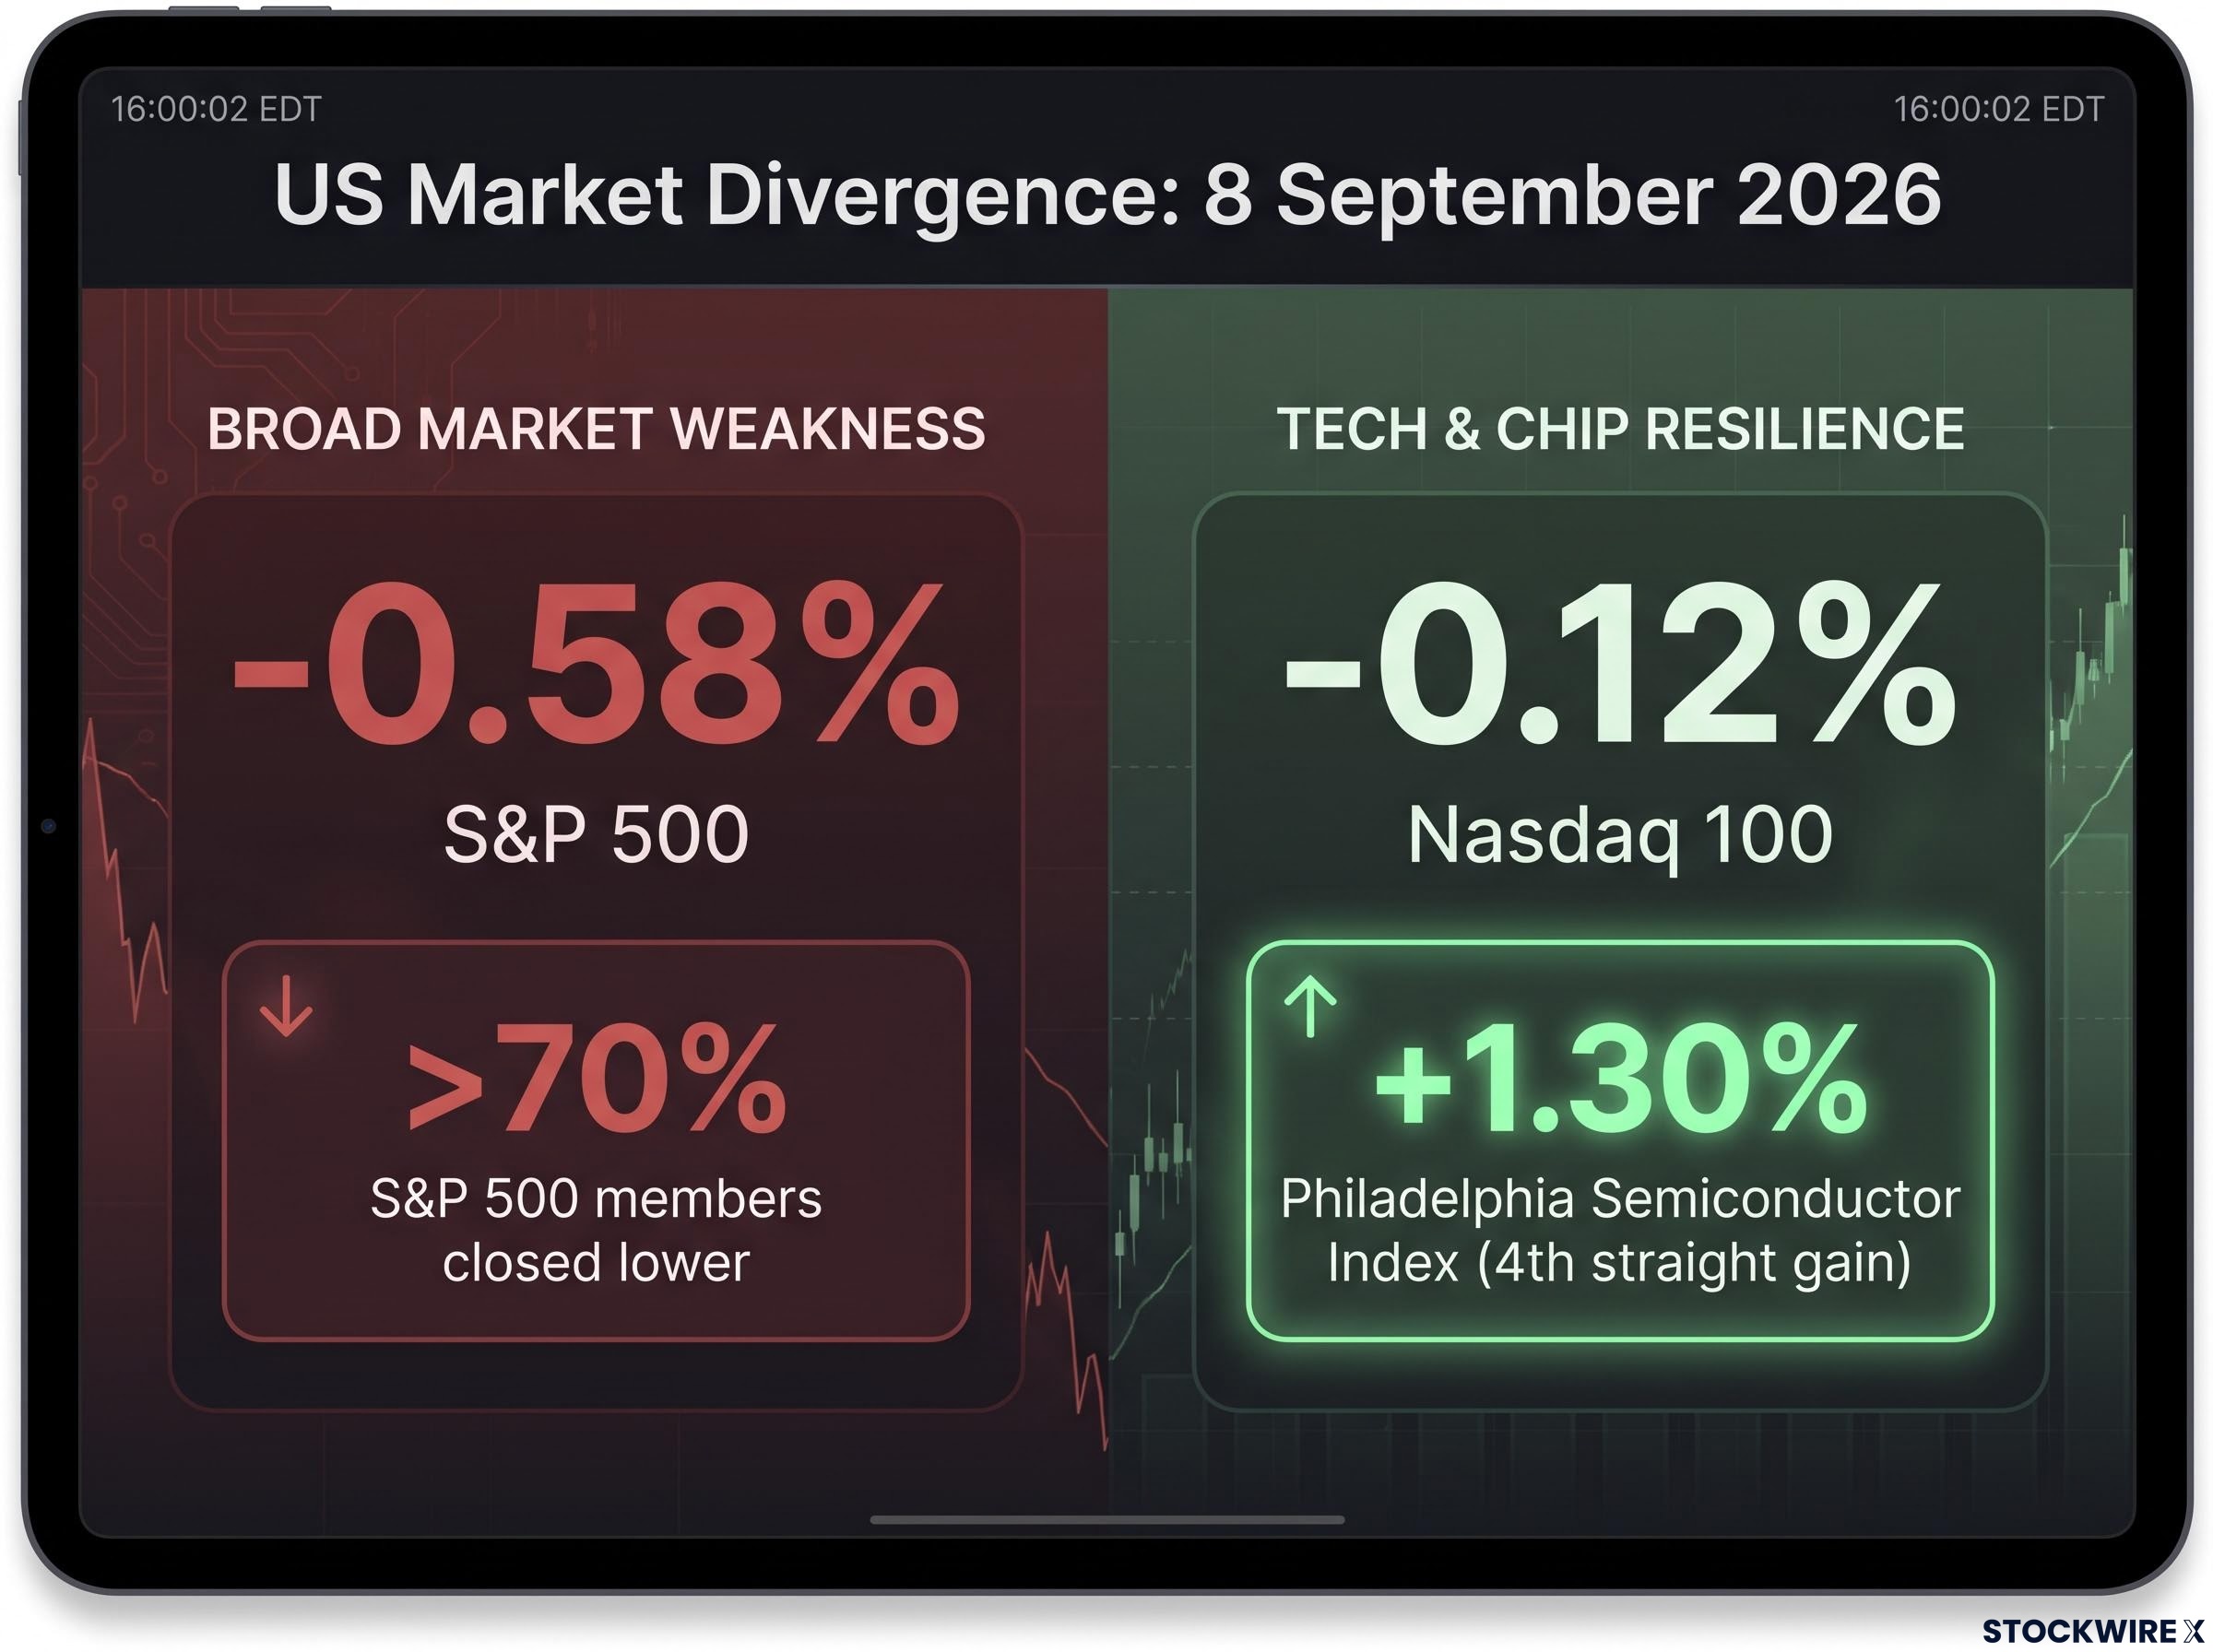
The breadth was ugly. More than 70% of S&P 500 constituents finished the session in the red, which tells you this was a genuine, wide-ranging retreat rather than a couple of mega-caps dragging an otherwise healthy index lower.
And yet the tech benchmarks barely registered the damage. The S&P 500 shed 0.58%, while the Nasdaq 100 slipped just 0.12%. The gap between those two numbers is the whole story of the day.
| Index | Close | Change (points) | Change (%) |
|---|---|---|---|
| S&P 500 | 7,673.52 | -45.08 | -0.58% |
| Nasdaq Composite | 26,421.41 | -85.58 | -0.32% |
| Nasdaq 100 | 29,507.70 | -36.45 | -0.12% |
| Magnificent Seven | – | – | -0.35% |
Even the Magnificent Seven basket, the seven largest US technology names, fell only 0.35%, holding up better than the broader S&P 500 despite carrying its own share of weakness. The mechanical reason for all of it sits in a single index of chipmakers.
The Philadelphia Semiconductor Index rose 1.30% on 8 September 2026, its fourth consecutive positive session.
That four-session run is doing the heavy lifting. Because semiconductors carry outsized weight in tech-heavy benchmarks, their strength directly offset losses everywhere else, keeping the Nasdaq roughly flat while the average stock in the market was falling.
The SOX index methodology applies a tiered capping mechanism to its constituents, which means no single chipmaker can dominate the index’s movement, yet the collective weight of the sector’s largest names still gives semiconductors an outsized influence on tech-heavy benchmarks like the Nasdaq 100.
For you, the read is this: a Nasdaq that looks calm can be hiding a market where conviction has narrowed to one theme. When index-level performance depends this heavily on a single sector holding the line, the headline number stops telling you how most stocks are actually doing.
Europe steadied near the flatline while South Korea’s KOSPI left every Asian peer behind
Cross the Atlantic and the same chip theme reappears, though at very different intensities depending on where you look.
Europe barely moved at all. The STOXX Europe 600 closed at 649.60, down just 0.05%, with the FTSE 100 off 0.10%, a picture of consolidation near recent levels rather than any decisive break. Deutsche Bank strategists flagged STOXX 600 futures pointing roughly 0.5% lower ahead of the next open, suggesting the continent was in a more cautious posture than a directional one.
Asia told a sharper story, and it belonged almost entirely to Seoul.
| Index | Region | Change (%) |
|---|---|---|
| KOSPI | South Korea | +1.63% |
| Nikkei 225 | Japan | +0.07% |
| Hang Seng | Hong Kong | +0.02% |
| CSI 300 | China | +0.10% |
| ASX 200 | Australia | -0.17% |
| STOXX 600 | Europe | -0.05% |
| FTSE 100 | United Kingdom | -0.10% |
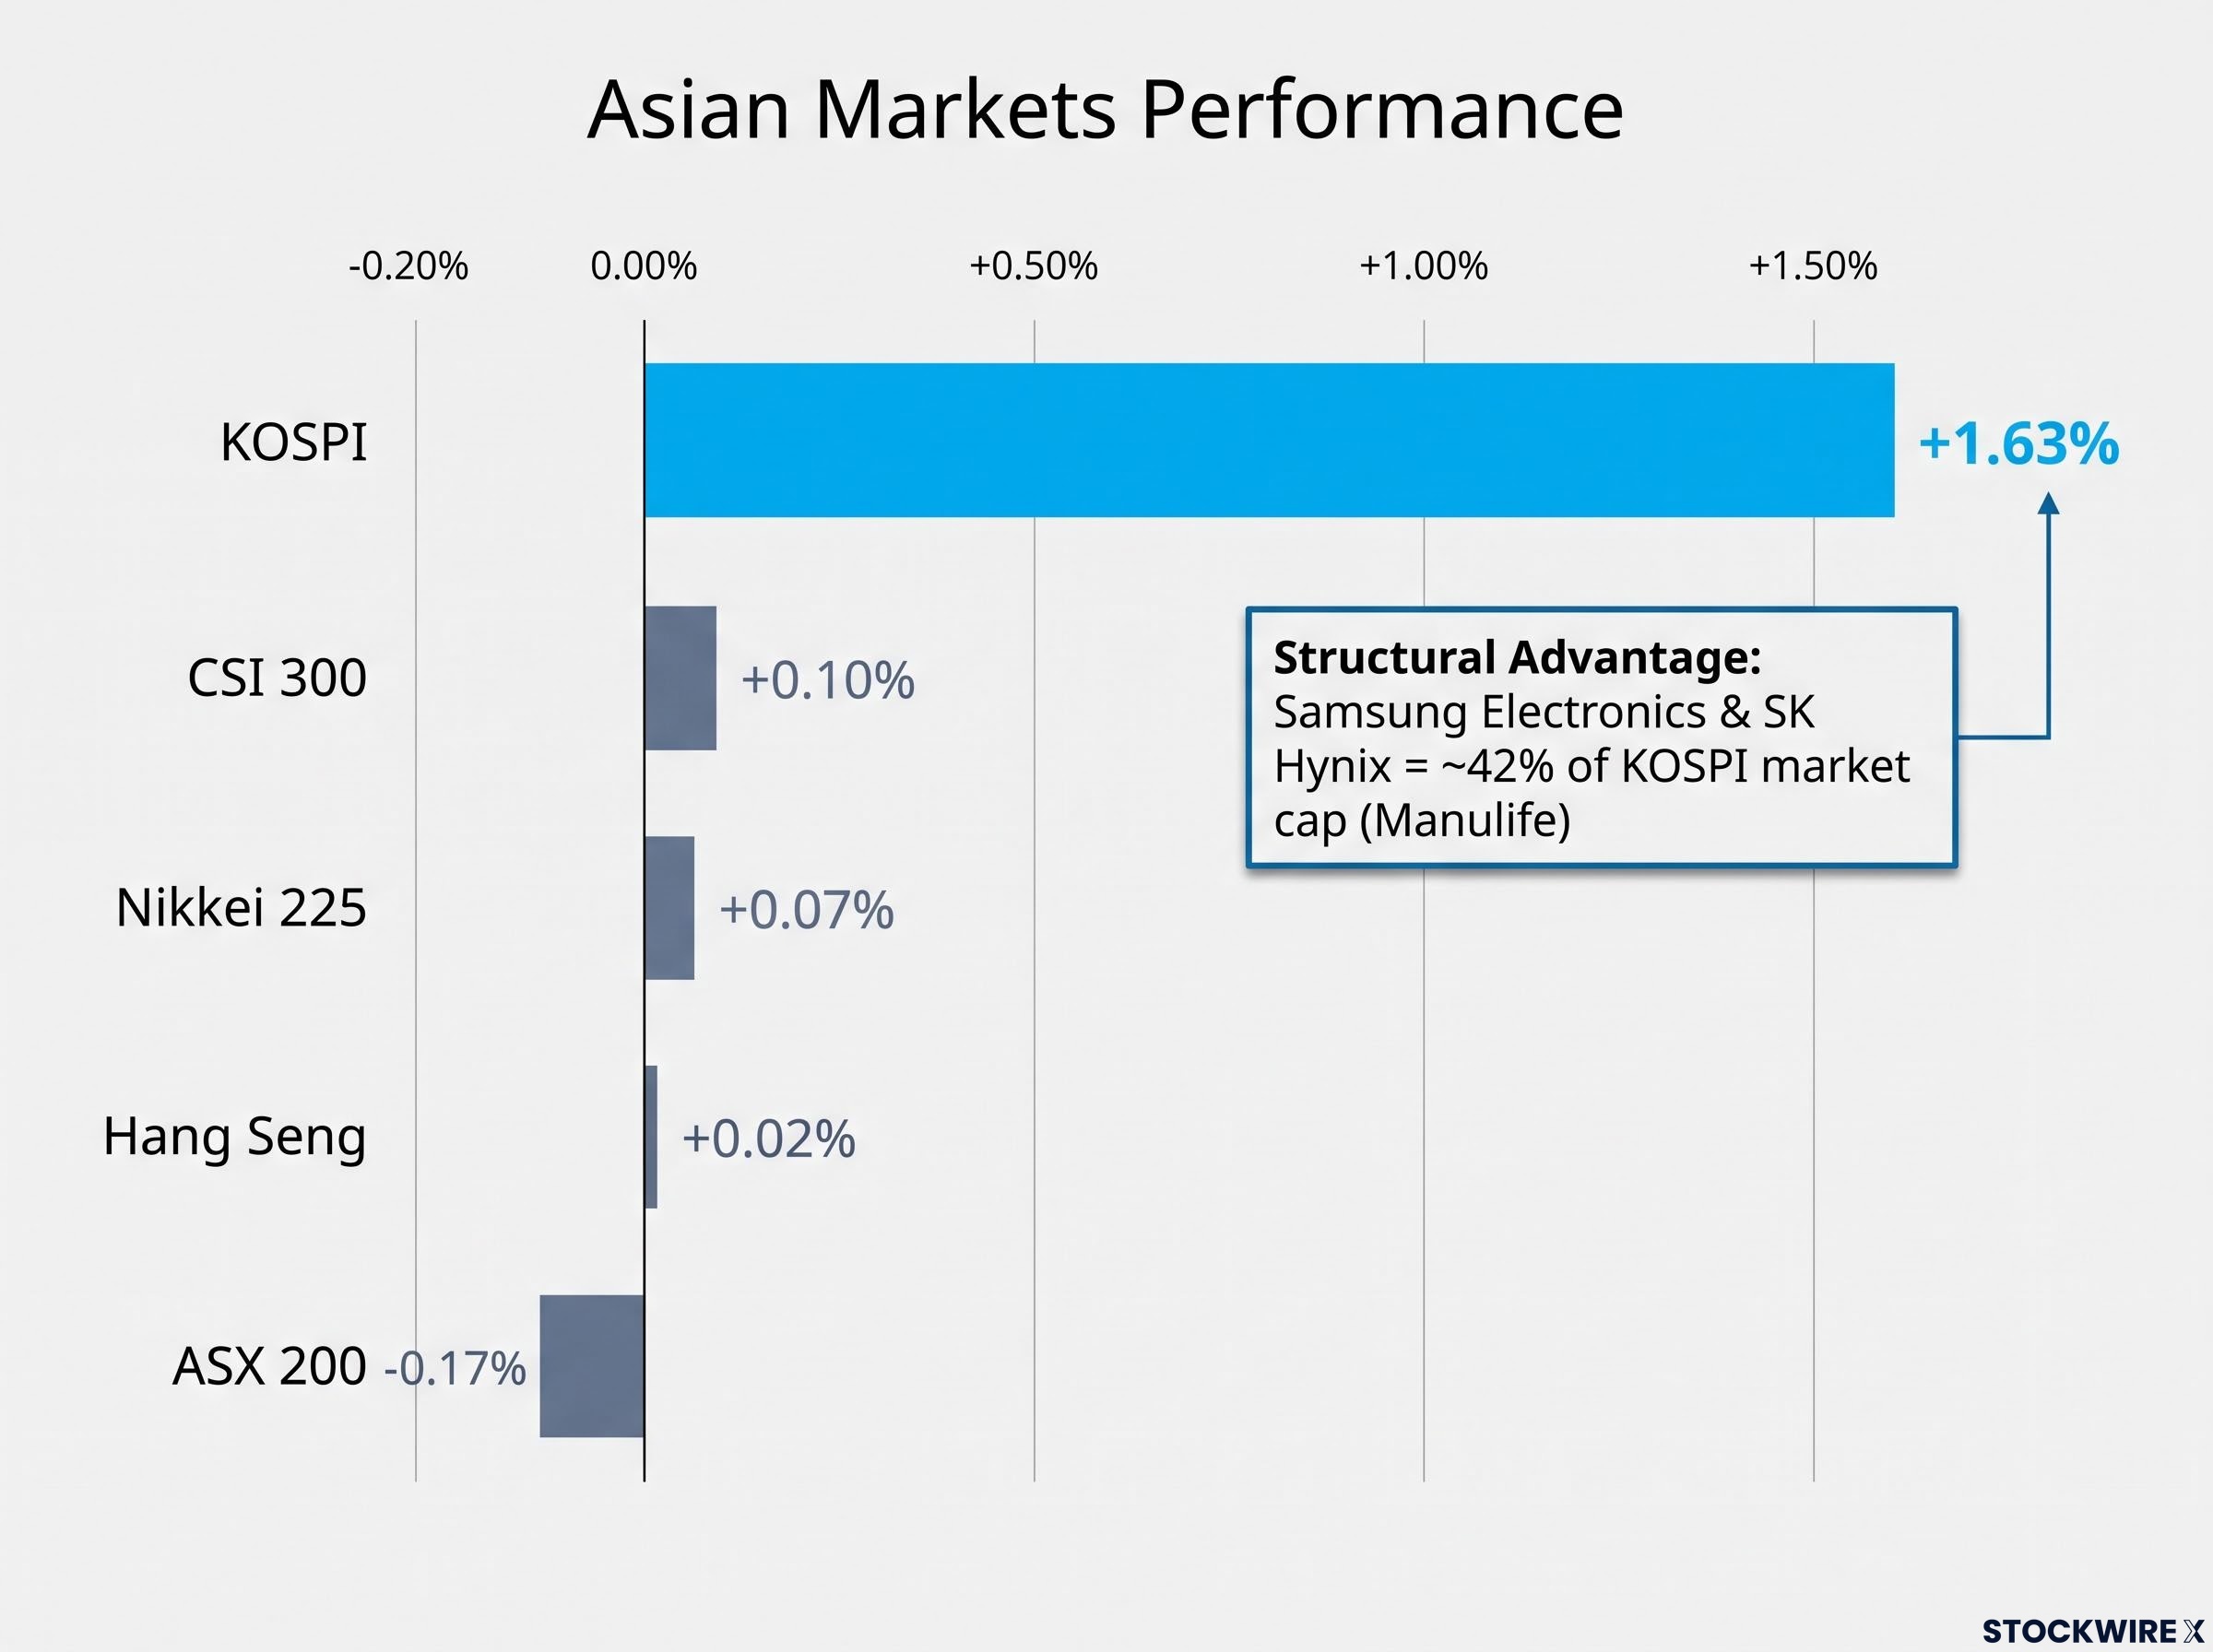
The KOSPI climbed 1.63% against a field of near-zero moves: the Nikkei 225 managed just 0.07%, the Hang Seng 0.02%, and the CSI 300 0.10%, while Australia’s ASX 200 dipped 0.17%. That is not coincidence. It is structure.
The reason KOSPI moves like this comes down to what sits inside it:
- Samsung Electronics and SK Hynix together account for roughly 42% of the index’s market capitalisation, according to Manulife data
- That concentration means a chip rally translates almost mechanically into KOSPI gains
- The AI-memory demand cycle, driven by a shortage of AI-grade memory chips, flows straight through both companies
- Shareholder return initiatives, including large buyback programmes, have added a further tailwind
Put simply, when semiconductors run, Korea runs hardest. Japan, China, and Hong Kong all have technology exposure, but none carry the same combined weight in two memory-chip giants.
Samsung Electronics and SK Hynix together account for roughly 42% of the KOSPI, which is precisely what index concentration risk looks like in practice: a two-stock semiconductor rally mechanically lifts the entire national benchmark, just as a two-stock selloff can drag it down more than 6% in a single session.
For you, that makes KOSPI the highest-beta way to express a view on the global AI and semiconductor cycle among major Asian indices. Its gap from regional peers is not noise. It is a signal about how tightly one country’s equity market is now tied to a single global demand story.
What the session’s patterns are signalling for the sessions ahead
The forward picture, at least in the US, points to more of the same.
S&P 500 futures ticked up 0.09% in early pre-market trading, with Nasdaq 100 futures advancing 0.22%. That is continuity, not a sharp turn: the market is leaning toward extending the chip-led divergence rather than resolving it.
The single most important variable is whether the semiconductor sector can keep its streak alive. The SOX’s four-session run is what has cushioned the Nasdaq, so if that momentum stalls, the tech-heavy indices lose the one thing propping them above the broader market.
That concentration cuts both ways, and the crowding risk is real.
Semiconductors have become one of the most crowded trades in equities, with rebounds accompanied by rising volatility and risk of abrupt position cuts.
That warning comes from JPMorgan strategists led by Nikolaos Panigirtzoglou, who flag the danger of value-at-risk shocks, the mechanical selling that kicks in when portfolio risk limits are breached. The more capital piles into the same handful of chip names, the sharper the reversal if sentiment turns.
JPMorgan’s warning on VaR shocks connects to a dynamic already observed in the sector: crowded-trade positioning has previously triggered sharp single-session selloffs of 8% or more in individual chip names on ambiguous headlines, even when underlying supply constraints remained fully intact.
Europe, meanwhile, is not sharing the momentum. Softer STOXX 600 futures, pointing around 0.5% lower per Deutsche Bank, suggest the continent remains anchored by geopolitical and energy-price caution rather than any chip-driven lift.
Here is what to keep an eye on:
- S&P 500 and Nasdaq 100 futures levels heading into the next US open
- Whether the SOX can extend its four-session winning streak
- The STOXX 600 futures trajectory as a gauge of European risk appetite
- Signals on AI capital expenditure sustainability, which Morningstar suggests may be peaking around 2025-2026 with downside risks emerging
- Crowding and VaR shock risk building in chip names
The practical takeaway for you: the near-term path for the major US indices depends far more on whether chipmakers can sustain their run than on any broad macro catalyst.
The divergence will not hold indefinitely, but today it is chipmakers driving the global narrative
Strip the session back to its essentials and one fact organises everything. A single sector, semiconductors, is simultaneously cushioning US index losses, powering KOSPI’s regional leadership, and quietly revealing where genuine conviction sits in global equities right now.
The numbers make the point. The S&P 500 fell 0.58% with more than 70% of its members down, yet the Nasdaq 100 lost only 0.12%. In Asia, the KOSPI rose 1.63% while the Nikkei managed just 0.07%. The same force explains both gaps.
South Korea’s year-to-date gains sit within a broader international equity rotation that has seen emerging markets ex-China outperform the S&P 500 for the first time in roughly two decades, with AI semiconductor demand identified as one of the primary structural drivers separating outperforming markets from laggards.
That force is powerful, but it is not unbreakable. Crowded positioning, JPMorgan’s warning on VaR shocks, Morningstar’s view that AI capital spending may be nearing a peak, and Europe’s more cautious posture all point to conditions that can shift quickly. For you, the useful frame is to hold both truths at once: the pattern is real today, and its foundations are narrow.
Two variables are worth watching above the rest: the SOX’s next move and any fresh signals on AI infrastructure spending. Together they will tell you whether this divergence deepens, narrows, or reverses.
This article is for informational purposes only and should not be considered financial advice. Investors should conduct their own research and consult with financial professionals before making investment decisions. Past performance does not guarantee future results, and forward-looking statements are speculative and subject to change based on market developments.