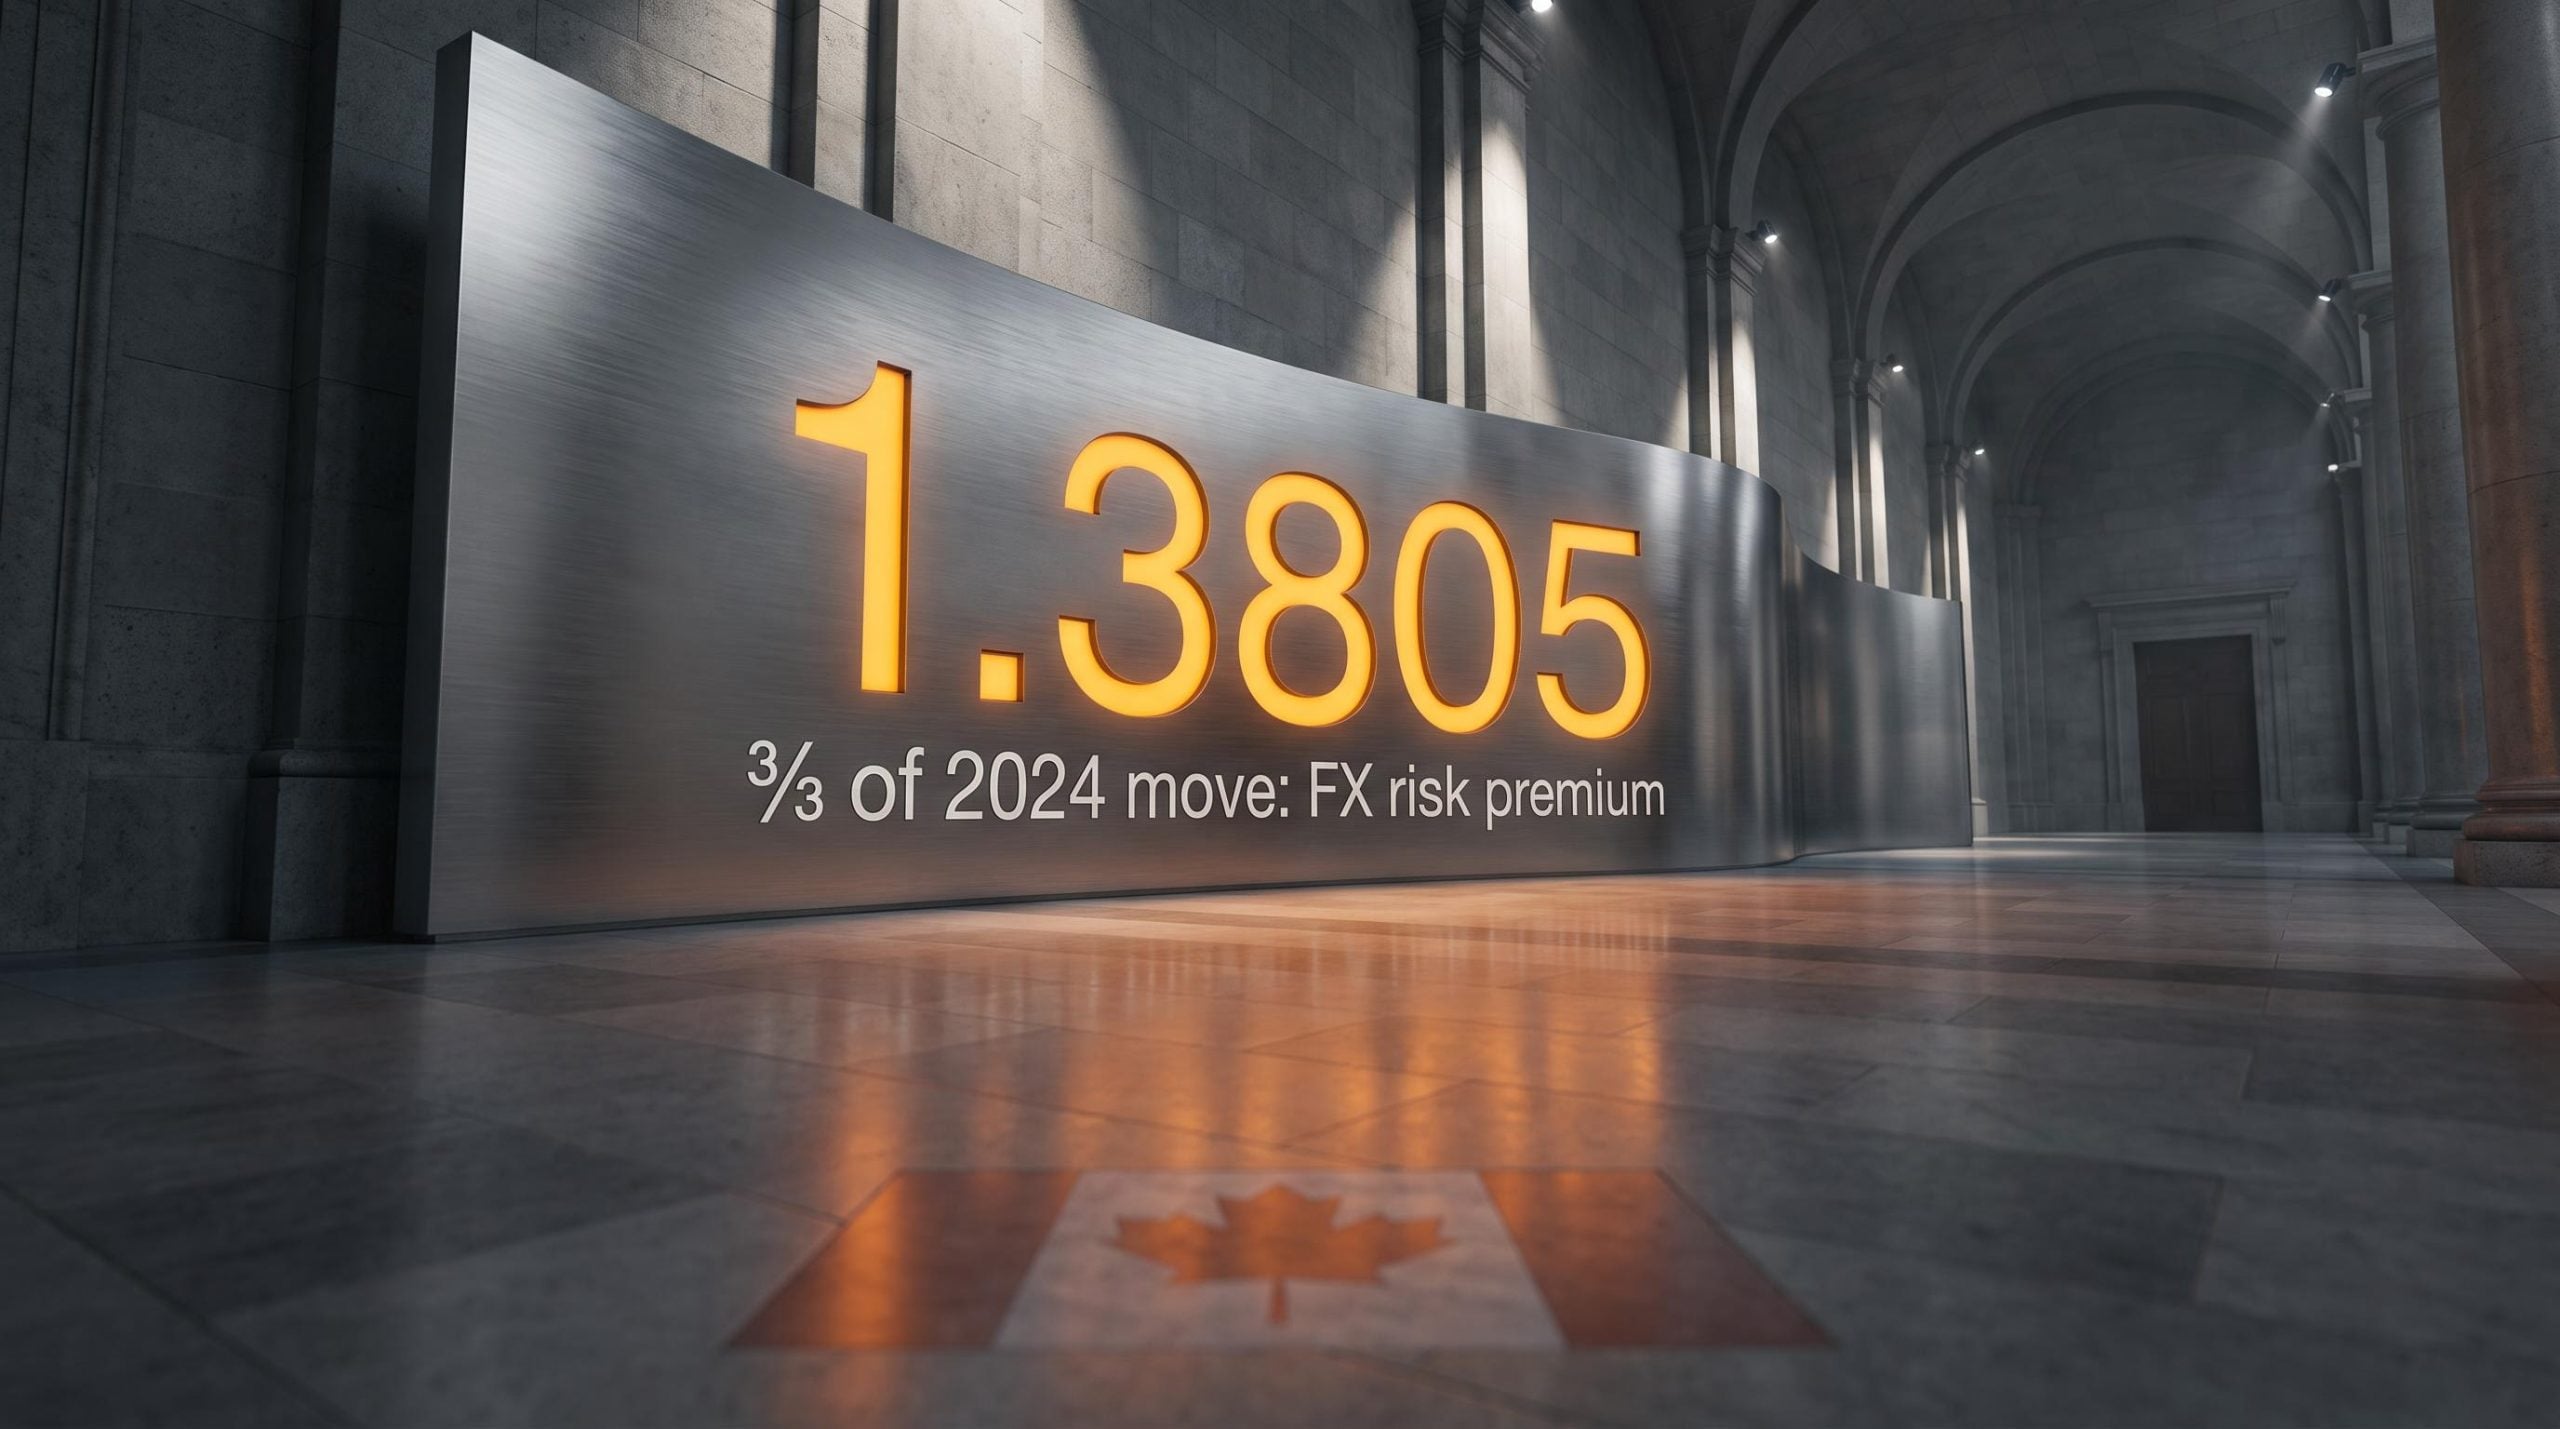
Most people assume currencies move on two things: interest rates and trade balances. For the Canadian Dollar, that is partly right, but it misses the driver that did most of the damage in 2024.
Roughly two-thirds of CAD’s slide against the US Dollar that year had almost nothing to do with the gap between Canadian and American interest rates. It was a foreign-exchange risk premium, the extra return investors demanded to hold a currency exposed to trade-war anxiety. That is exactly the kind of force the conventional framework fails to capture.
The Canadian Dollar is often called one of the more readable major currencies, because its main levers are well documented: Bank of Canada policy, crude oil export revenues, the gravitational pull of the US economy, and the mood swings of global risk appetite. Readable, though, does not mean simple. The link between CAD and oil has structurally broken since 2024, and the risk-premium channel now regularly overrides classical rate differentials.
This guide maps the full set of Canadian Dollar drivers: the fundamental forces first, then the technical tools practitioners use to gauge near-term direction, using the current USD/CAD chart as a live example. After this, you will have a structured way to interpret CAD moves across both news and charts, not just a list of things to keep an eye on.
Why the Bank of Canada is the first dial to check
Start with the most intuitive lever. The Bank of Canada (BoC) targets an inflation range of 1-3%, and it moves interest rates to keep inflation inside that band. When Canadian rates sit high relative to other countries, foreign capital tends to flow in chasing better returns, and that demand strengthens the Canadian Dollar. When the Bank eases, the opposite pressure builds.
Here is where it gets less obvious. The currency does not usually wait for the decision itself. Markets price the probability of a rate move in advance, so by the time the BoC actually acts, much of the move can already be baked into the exchange rate.
The recent easing cycle shows this repeatedly:
- June 2024: CAD weakened about 0.4% to 1.3680 per USD as markets priced an 80% chance of the BoC’s first cut since 2020. The currency moved before the cut, not after it.
- January 2025: CAD fell to roughly 1.4420 per USD following a BoC cut, with widening Canada-US yield spreads deepening the pressure.
- July 2026: CAD strengthened about 0.2% to 1.4032 after the Bank held rates at 2.25%.
- September 2026: CAD climbed to a more-than-one-week high after the BoC held rates but flagged intensifying inflation risks.
That last one is the tell. No rate changed, yet the currency rose on tone alone.
Hawkish language on its own pushed CAD higher in September 2026, with no rate move at all. Rhetoric moves this currency, not just decisions.
What matters most for the medium term is not the BoC’s absolute rate level, but how it diverges from the US Federal Reserve. When the two central banks pull in different directions, the yield spread between them widens, and that spread is a far more powerful signal than any single Canadian rate reading in isolation.
As of 2 September 2026, the BoC held the overnight rate at 2.25%, with the next announcement scheduled for 28 October 2026. The C.D. Howe Institute’s Monetary Policy Council has recommended holding at 2.25% through October before raising to 2.5% by April 2027.
Core inflation measures like CPI-trim and CPI-median are tracking below the BoC’s 2% target and beneath the Bank’s own quarterly forecasts, a configuration that removes any independent justification for tightening and reinforces the rate-divergence headwind that has been weighing on CAD.
The practical takeaway for you is that circling the BoC’s decision date is less useful than tracking how market pricing shifts in the weeks before it. By announcement day, the move is often already in the price.
When big ASX news breaks, our subscribers know first
What crude oil actually tells you about CAD now
For decades, the oil story was the CAD story. Crude is Canada’s largest export category, with oil and energy products making up roughly 20-25% of merchandise exports (crude petroleum alone was about 19.5% in 2024).
The mechanism was clean. When global oil prices rose, more US dollars flowed into Canada to pay for those exports, lifting demand for CAD and mechanically pushing USD/CAD lower. Higher prices improved Canada’s terms of trade and drew more capital into the energy sector. Oil up, Canadian Dollar up.
Then that relationship quietly fell apart.
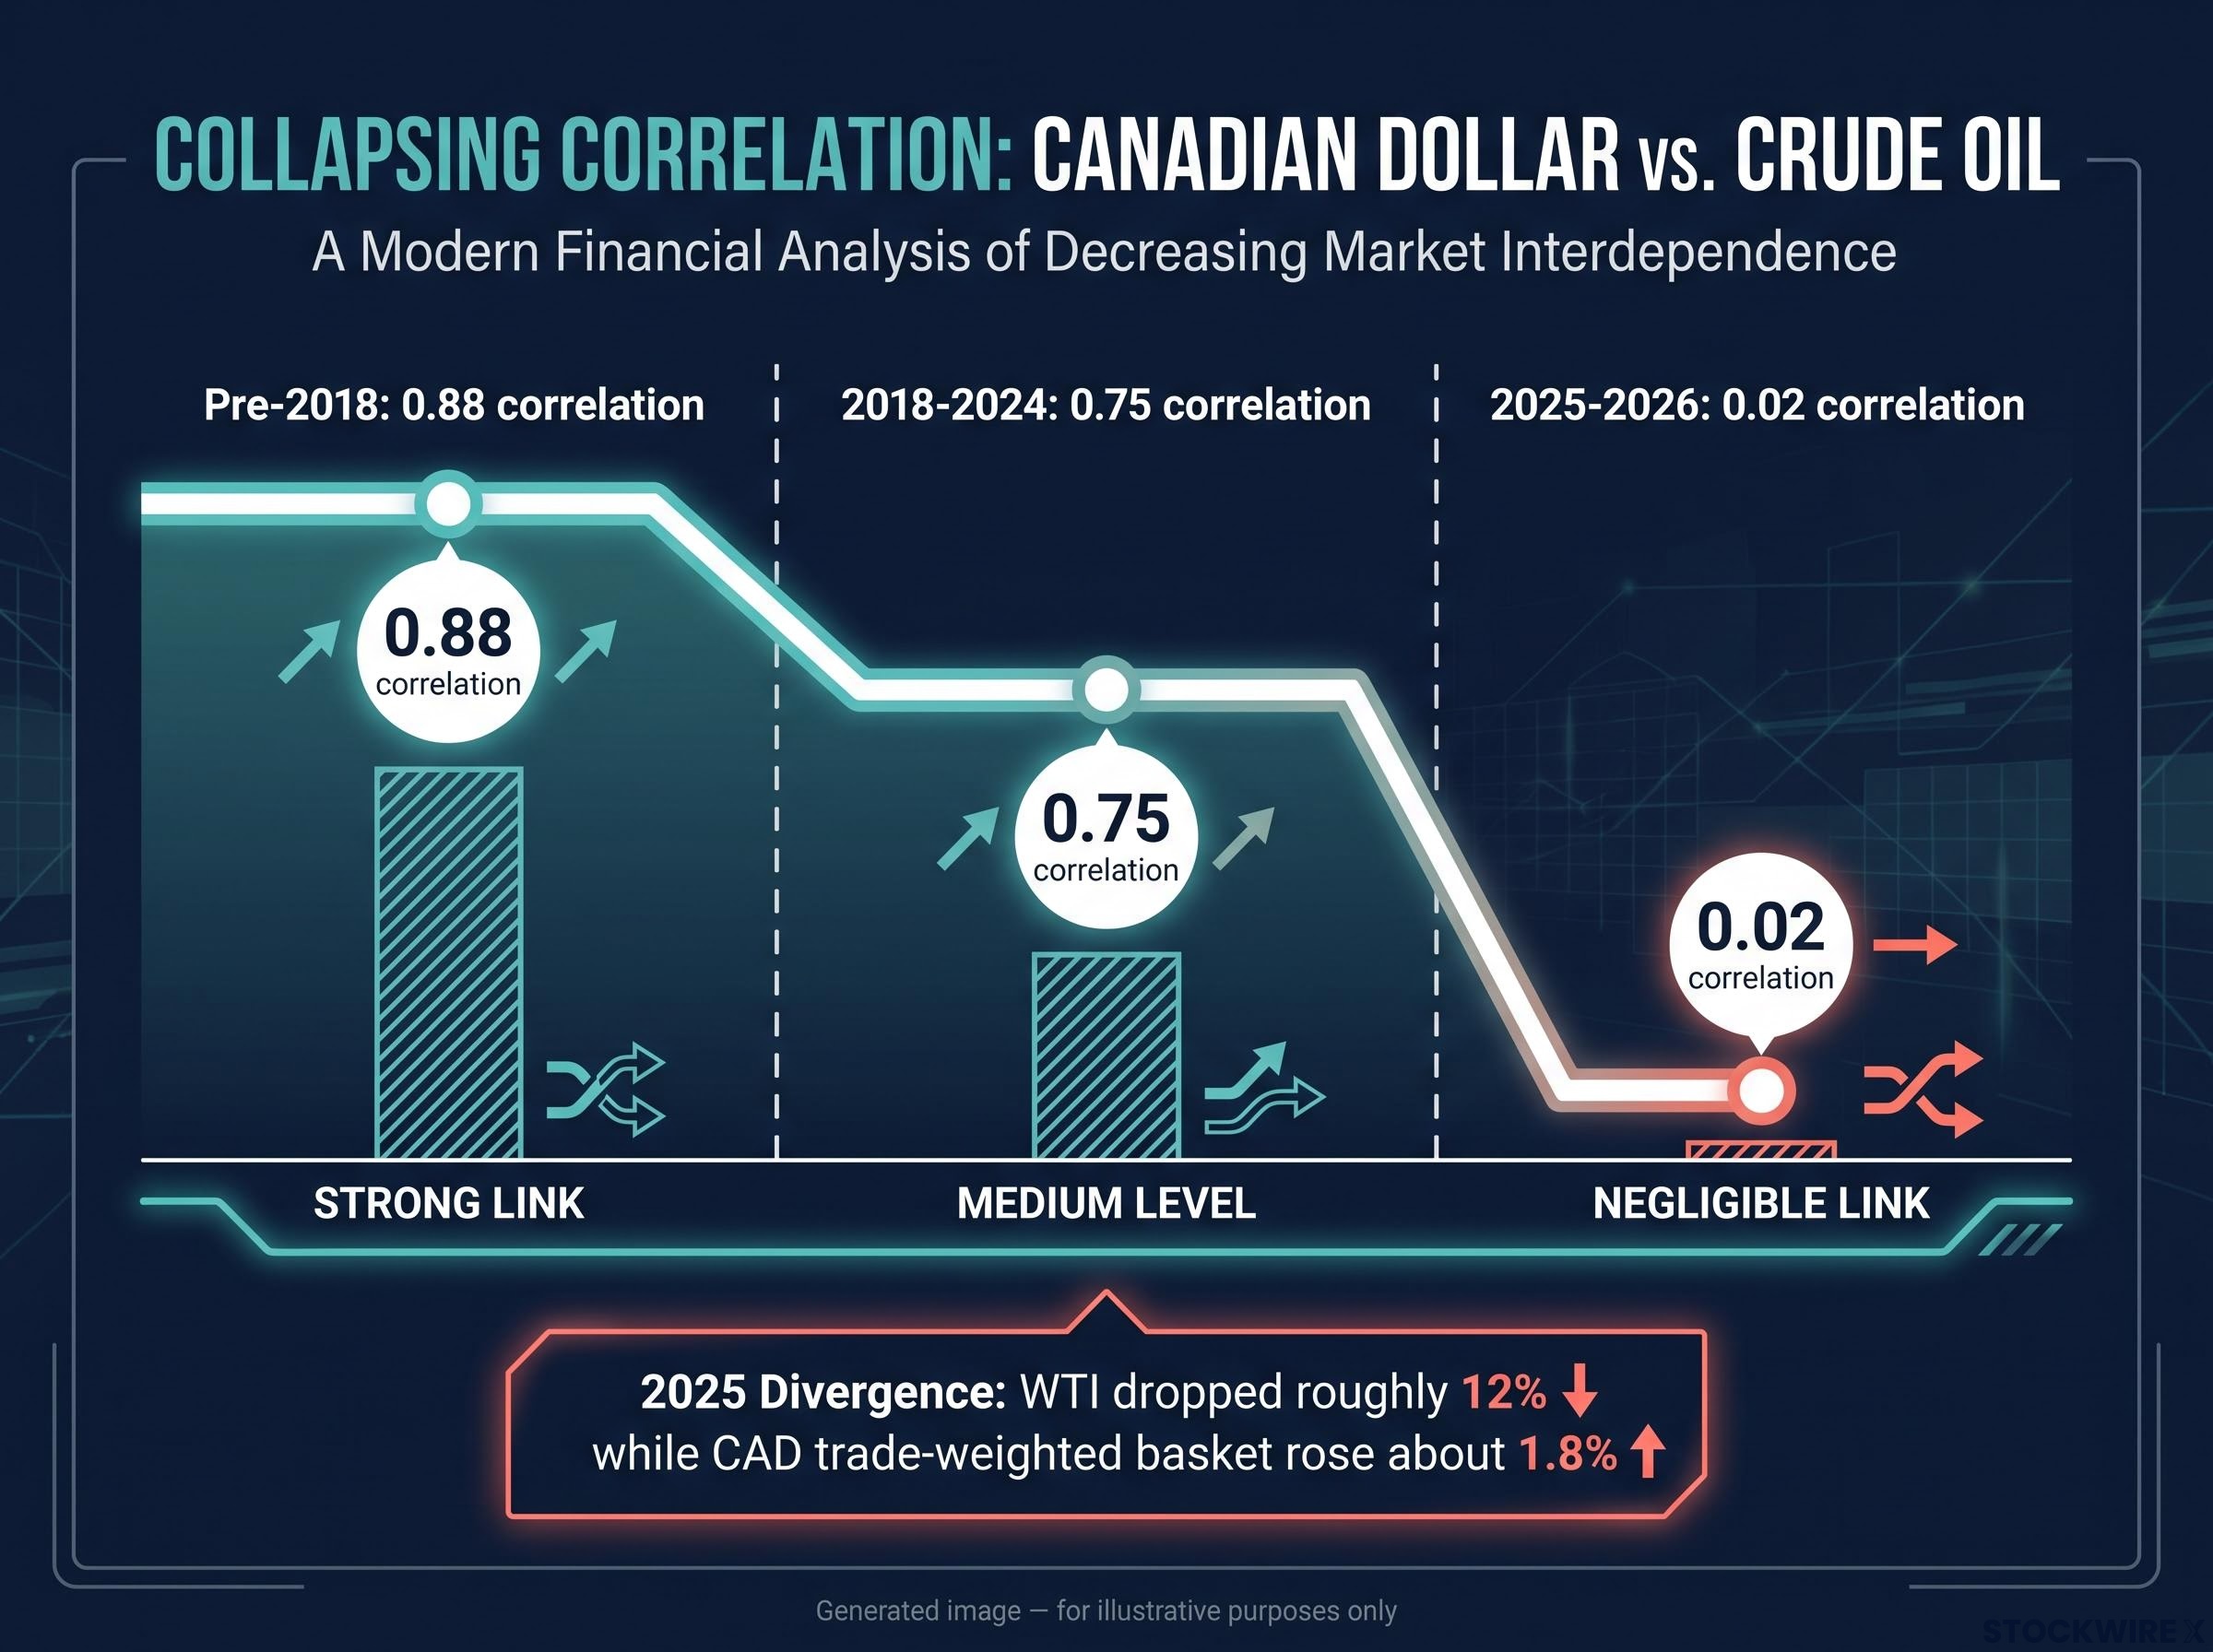
The correlation between USD/CAD and WTI crude sat near 0.88 before 2018, a very tight link. It slipped to around 0.75 across 2018-2024. Over the 2025-2026 window, the 12-month return correlation collapsed to just 0.02, statistically close to no relationship at all.
| Period | Approx. CAD-oil correlation | What it means for using oil as a CAD signal |
|---|---|---|
| Pre-2018 | 0.88 | Strong link. Oil was a reliable real-time proxy for CAD direction. |
| 2018-2024 | 0.75 | Weakening but still meaningful. Oil useful with other confirmation. |
| 2025-2026 | 0.02 | Effectively no link. Oil is noise as a daily directional signal. |
The clearest evidence came in 2025, when WTI dropped roughly 12% for the year while the CAD trade-weighted basket actually rose about 1.8%. Falling oil no longer guaranteed a weaker Canadian Dollar.
Why the break? Analysts point to new pipeline capacity such as the TMX expansion, a more diversified Canadian export base, and a shift in central bank posture. In April 2026, BoC Governor Tiff Macklem indicated the Bank would “largely look through the oil price shock” rather than treating it as an automatic trigger for tighter policy.
The oil-to-CAD transmission weakened not in a single event but across a decade of structural shifts, including pipeline capacity expansion and a change in BoC posture that decoupled the Bank’s policy response from energy price swings.
The BoC signalling it would “largely look through” oil shocks marks a structural change. Oil spikes no longer force the Bank’s hand the way they once did.
There is one important caveat. The link re-emerges in severe downturns. An early-2026 Brent slide of roughly 30% over two months damaged Canada’s terms of trade and contributed to about a 4.2% appreciation in USD/CAD. WTI was trading in the low-$90s in early September 2026 ($92.30 per barrel on 8 September 2026, per Trading Economics), a benign level where the correlation stays quiet.
For you as a CAD watcher, this reframes oil as a tail-risk monitor rather than a daily directional signal. You can largely ignore it in moderate conditions, but you should treat a severe energy shock as a live threat to your CAD thesis. Trading oil as a real-time CAD proxy today means working with a broken model.
The broader macro picture: US exceptionalism, risk appetite, and what actually moved CAD in 2024
Canada does not set its currency’s fate alone. The United States is its principal trading partner, and the health of the US economy is a structural external driver of CAD value.
Recently that driver has cut one way. Resilient US growth, a durable American labour market, and stickier US inflation have pushed the Federal Reserve toward fewer rate cuts than the Bank of Canada. That widening macro gap, sometimes called “US exceptionalism,” has created a persistent headwind for CAD even when Canadian domestic data looks stable.
Macro fundamentals worth tracking
A useful CAD framework watches the indicators that shape both growth expectations and, indirectly, BoC rate decisions:
- GDP growth: The headline gauge of economic momentum, feeding directly into currency strength.
- Manufacturing and services PMIs: Forward-looking activity surveys that hint at where growth is heading.
- Employment figures: Labour strength influences both consumer demand and central bank policy.
- Consumer confidence: A read on future spending, which underpins domestic growth.
- Trade balance: Stronger export prices raise the odds of a positive balance, which supports the currency.
Track these together and a pattern usually emerges before any single data point confirms it.
Risk appetite and the premium you cannot see on a spreadsheet
Global risk sentiment moves capital between currencies. In risk-on conditions, safe-haven demand for the US Dollar softens and CAD tends to benefit. In risk-off conditions, that reverses as investors retreat to the safety of the USD.
Sitting on top of this is the foreign-exchange risk premium: the extra return investors demand to hold a currency facing elevated trade-policy or geopolitical uncertainty. It operates independently of interest-rate differentials, and during periods of trade-policy volatility it can dominate the rate signal entirely.
This is not a fringe idea. The BoC’s January 2025 Monetary Policy Report stated that CAD’s decline since October 2024 was driven largely by a rise in the FX risk premium, fuelled by US tariff threats and global trade uncertainty, rather than by rate differentials.
The FX risk premium is not a theoretical construct: when the US announced 50% tariffs on roughly US$20 billion of Canadian goods, the CAD posted the largest single-session drop of any major currency on announcement day, then recovered sharply on a three-day pause, illustrating exactly how trade-policy uncertainty gets priced and repriced in real time.
The scale is what stands out. A 2025 analysis concluded that roughly two-thirds of CAD’s 7.7% depreciation against the USD in 2024 was attributable to risk-premium effects, not the rate spread.
What this tells you is that a CAD forecast built only on BoC decisions and oil prices is structurally incomplete. You also need a view on US economic momentum and the current level of global trade anxiety before your directional bias has a solid foundation. Macro health indicators and geopolitical risk belong in the framework alongside central bank decisions, not as optional extras.
Reading the chart: how technical tools apply to a macro-driven pair
Technical analysis is a secondary lens for USD/CAD, not the primary one. It measures price behaviour, and for a pair this sensitive to policy and geopolitics, fundamentals can override the chart in minutes. Used with that caveat, though, two tools give you a disciplined read on near-term positioning.
The first is the Exponential Moving Average (EMA), a moving average that weights recent prices more heavily than older ones, so it reacts faster than a simple average. Traders watch the 9-day EMA for short-term momentum and the 50-day EMA for medium-term trend direction. Where the price sits relative to both establishes a basic directional bias.
The second is the Relative Strength Index (RSI), a momentum gauge that runs from 0 to 100. A 14-period reading below 30 conventionally signals oversold conditions and above 70 signals overbought. The critical caveat: in a strong trend, RSI can stay parked in oversold or overbought territory for a long time, which makes counter-trend signals unreliable.
Here is how the current USD/CAD setup reads:
| Indicator | Current value | Conventional interpretation | Key limitation |
|---|---|---|---|
| 9-day EMA | ~1.3819-1.3856 | Above spot, confirming short-term bearish bias | Lagging indicator; prone to whipsaws in choppy markets |
| 50-day EMA | ~1.3920-1.3941 | Further above spot, confirming medium-term bearish structure | Relies on past prices; cannot predict new trends |
| 14-day RSI | ~38-40.7 | Mildly negative territory | Can stay below 30 in strong trends, so not a standalone buy signal |
With spot near 1.3779-1.3805 in early September 2026, the price sits beneath both EMAs, which confirms a downside bias. Reclaiming the 9-day EMA on a daily close would signal that selling pressure is starting to fade, though the pair would need to push all the way toward the 50-day EMA before the medium-term bearish structure comes under any genuine threat.
Reading the setup follows a simple three-step logic:
- Establish where price sits relative to the 9-day and 50-day EMAs to fix the directional bias.
- Check the RSI to confirm whether momentum agrees with that bias.
- Cross-check both against the upcoming macro calendar before acting on anything.
Technical signals in USD/CAD must be cross-checked against key macro events, because fundamental surprises can rapidly invalidate otherwise clean chart setups.
For you, the current picture supports caution about near-term CAD strength. The more valuable discipline, though, is knowing which upcoming macro events could override that signal before you act on it.
Building a complete CAD view: where the framework holds and where it breaks
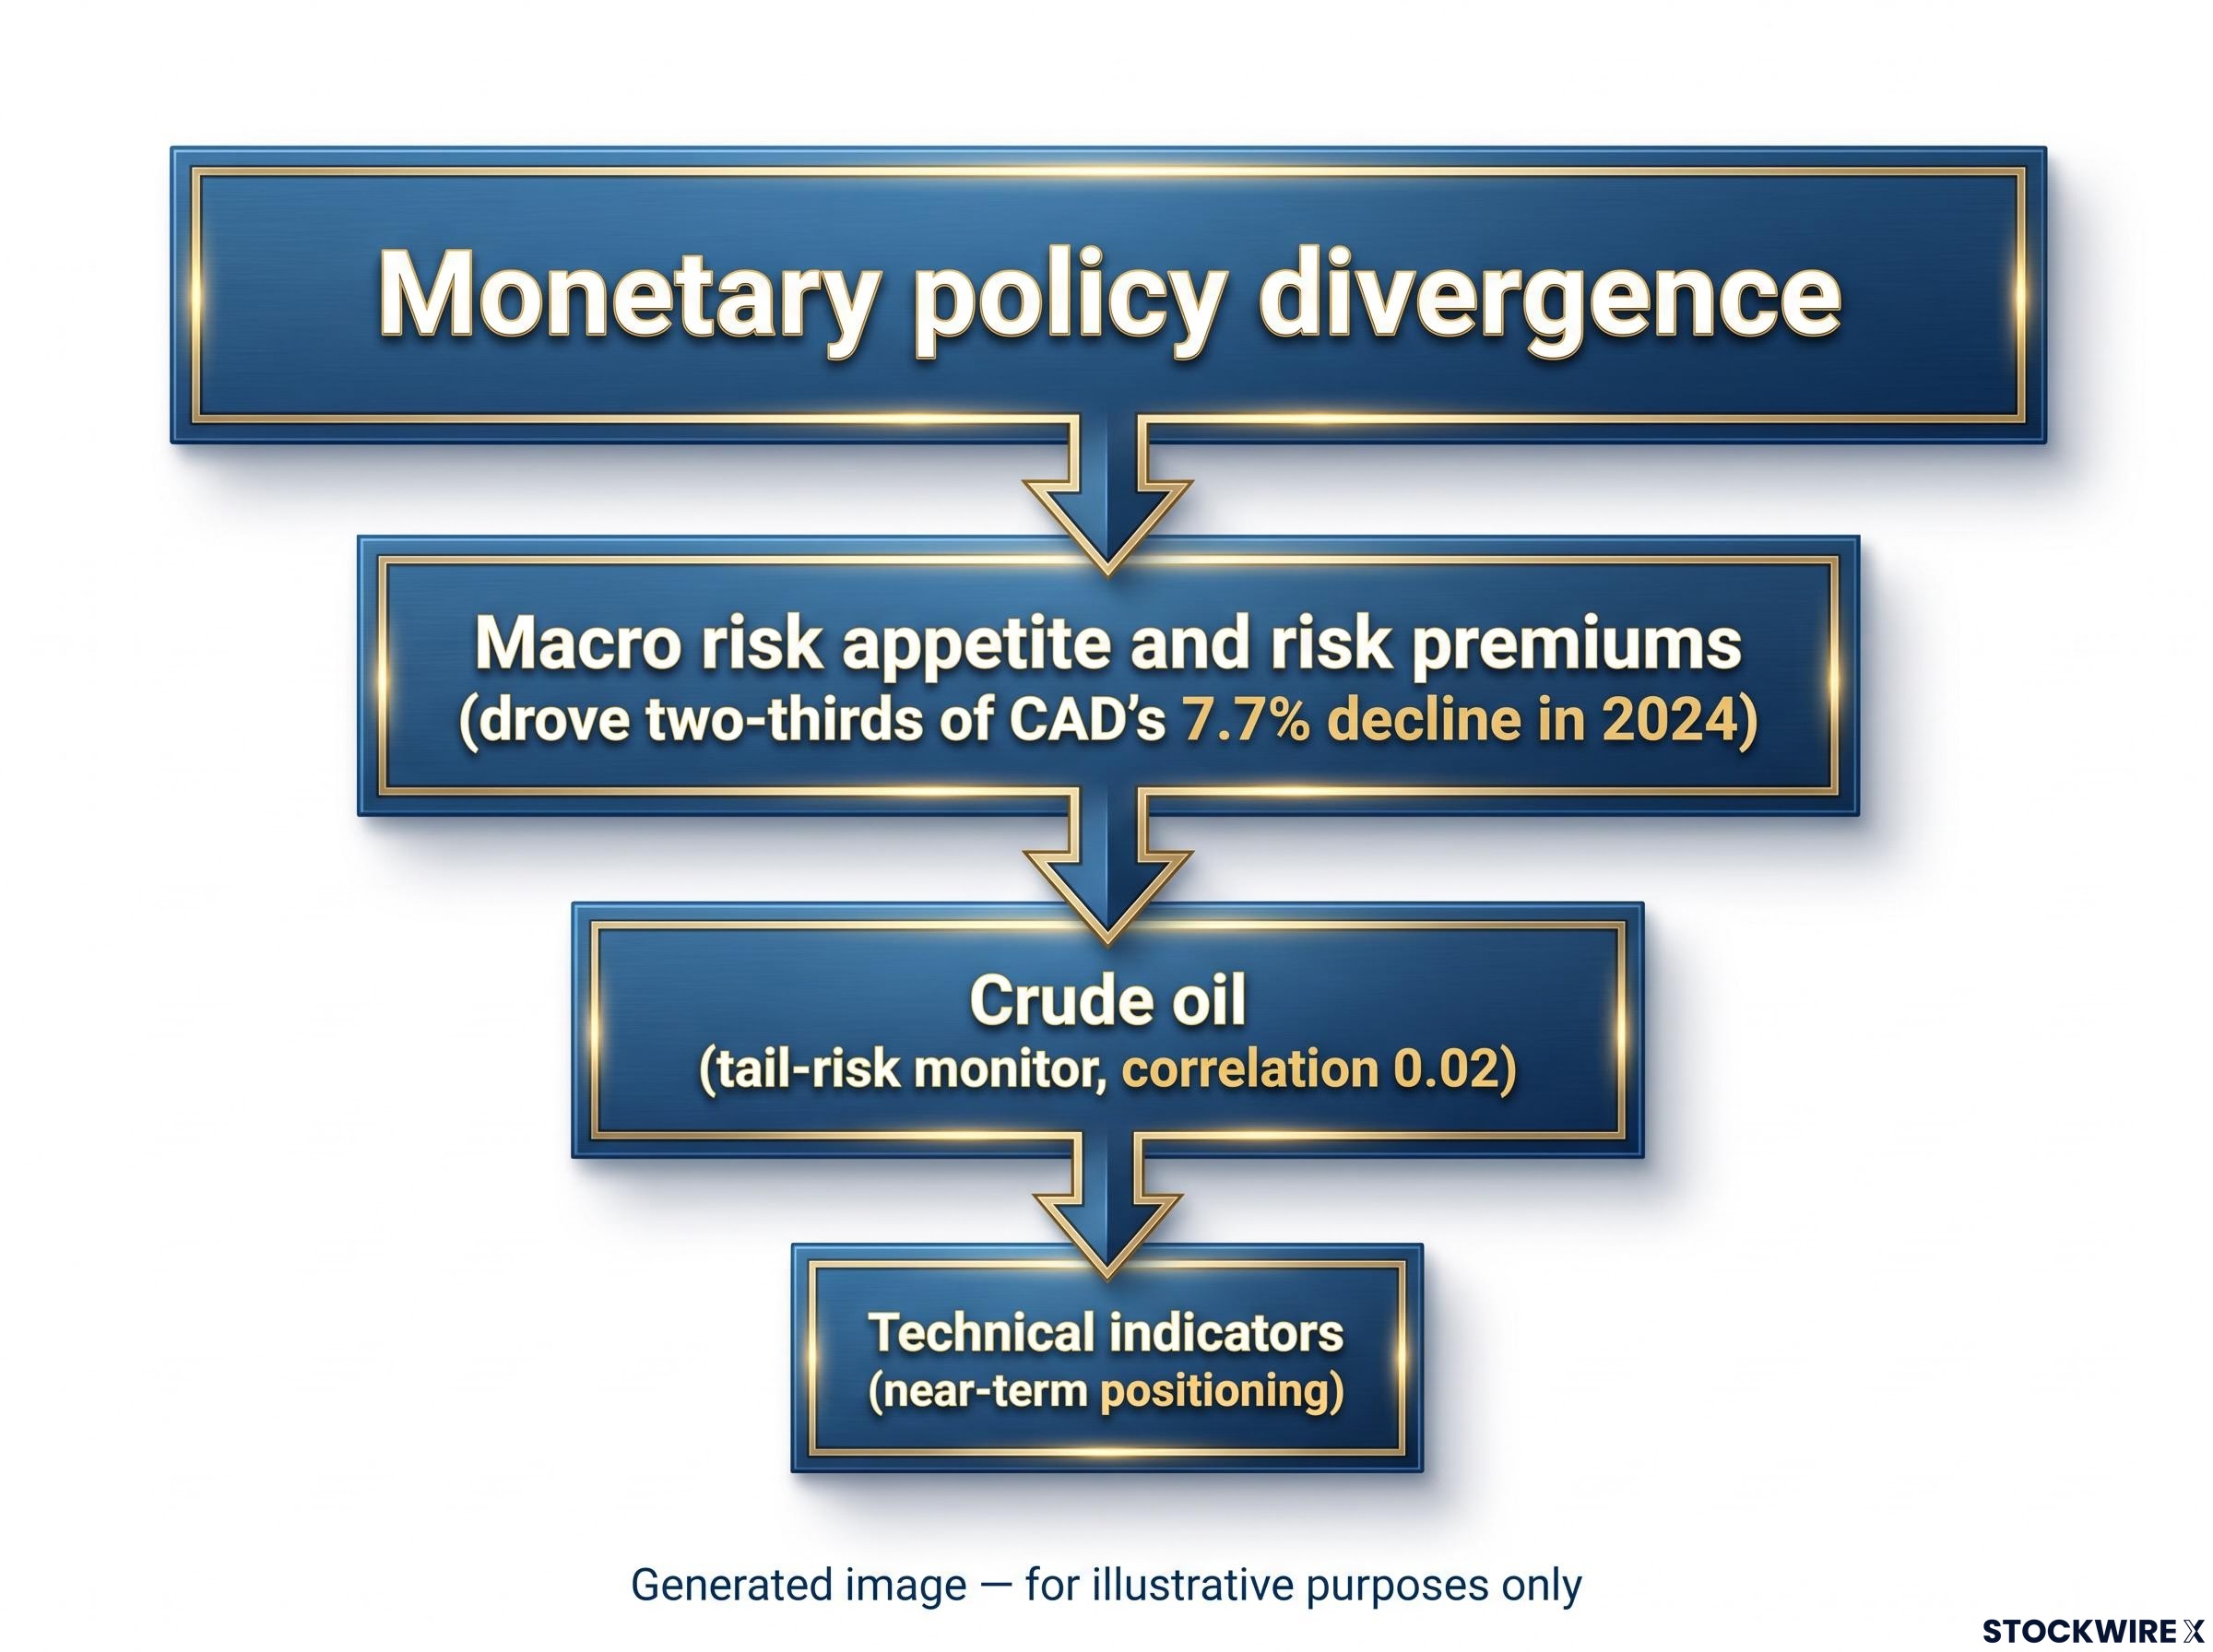
Put the four pillars together and a clear hierarchy appears. Not every driver carries the same weight, and knowing which one leads in the current regime is the real skill.
- Monetary policy divergence: The dominant medium-term signal. The BoC-Fed gap is currently the anchor of the fundamental view.
- Macro risk appetite and risk premiums: Increasingly powerful cross-cutting forces, capable of overriding rate spreads during trade-policy stress.
- Crude oil: A tail-risk monitor, not a daily signal. Relevant only in severe energy shocks right now.
- Technical indicators: A near-term positioning layer on top of the fundamentals, useful for timing, not for the core thesis.
The most common analytical errors map directly onto this hierarchy. Treating oil as a reliable real-time proxy, when the correlation has collapsed to 0.02. Ignoring risk premiums because they are harder to measure than rate spreads, when they drove two-thirds of CAD’s 2024 decline. And trading technical signals without glancing at the macro calendar.
Competing channel balance explains why USD/CAD can sit almost motionless even when oil surges and Fed expectations tighten simultaneously: the oil-commodity channel, the Fed rate channel, and the geopolitical dual-channel can offset each other with near-mathematical precision, producing range-bound price action as the rational outcome.
This is a living framework, not a fixed formula. The weight of each driver shifts across market regimes, and identifying the dominant regime is itself the key move.
Right now, the drivers broadly point the same way. The BoC is on hold ahead of its 28 October 2026 meeting, the oil correlation has gone quiet, US macro momentum remains relatively resilient, and USD/CAD sits beneath both EMAs with RSI in mildly negative territory. When all four align like this, that alignment is itself information: it signals higher conviction in a modest CAD-weakness view than any single factor could on its own.
What to watch next, and what the current setup is actually telling you
You now have the framework. The next step is knowing which incoming events could move it.
Four things deserve a place on your near-term watchlist:
- The BoC’s 28 October 2026 announcement and forward guidance. The single most important scheduled event for the fundamental picture. Watch the tone as closely as the decision.
- US Federal Reserve communications. Anything that shifts rate-differential expectations changes the core CAD headwind.
- WTI crude price. Benign at low-$90s levels today, but a severe drop toward the tail-risk threshold would put oil back in play.
- Global risk appetite. Equity volatility and trade-policy headlines feed straight into the risk premium.
On the chart, the levels to watch are clear. Sustained price action back above the 9-day EMA (roughly 1.3819-1.3856) would indicate that downside momentum is losing grip, but only a sustained advance toward the 50-day EMA (roughly 1.3920-1.3941) would put the prevailing bearish structure in real jeopardy.
When fundamental and technical signals align, conviction is higher. When they diverge, caution is warranted.
For you, the 28 October BoC decision is the near-term event to monitor above all others, and the 9-day EMA is the chart marker to watch in the weeks leading up to it as a real-time read on shifting sentiment. Check whether the fundamental and technical pictures agree before acting, because convergence raises conviction and divergence is a signal to slow down.
This article is for informational purposes only and should not be considered financial advice. Investors should conduct their own research and consult with financial professionals before making investment decisions. Past performance does not guarantee future results. Financial projections are subject to market conditions and various risk factors.