The ECB is widely expected to raise rates this Thursday, and nearly every headline frames it as a moment of danger for European bond markets. The question investors rarely stop to ask is whether a single quarter-point move and a sustained tightening campaign are actually the same event.
They are not.
Fisher Investments has argued publicly that the current yield curve configuration, a steepened German Bund curve with a 2s10s spread sitting at roughly +0.48 percentage points, reflects constructive conditions for lending and corporate health rather than the recessionary warning of a flattening or inverted curve. That distinction matters enormously for how you read Thursday’s outcome.
The ECB rate decision itself is only the surface of the story. What follows unpacks the mechanism behind that argument, maps it against the live data and the competing interpretations, and identifies the specific conditions that would break the constructive picture. After this, you will have a precise framework for deciding how much weight to place on Thursday’s announcement versus the sequence of decisions that might follow it.
What the Bund curve is actually telling you right now
Start with the raw numbers, because they anchor everything that follows. As of 4 September 2026, the German Bund 2-year yield sat at approximately 2.89% and the 10-year yield at approximately 3.37%, according to CentralBank.watch. That produces a 2s10s spread of roughly +0.48 percentage points.
CentralBank.watch labels the curve shape “Normal” and describes it as an upward slope that ranks among the steepest in the developed world. Both the 2s10s and the 3-month-to-10-year spreads are positive, which is what earns the designation.
Here is the number that most investors would not predict from the current headlines. CentralBank.watch attaches a 12.20% estimated 12-month recession probability to the eurozone outlook, and it ties that relatively low figure directly to the steep, non-inverted curve.
That probability is not a matter of sentiment or opinion. It flows from the shape of the curve itself, which is precisely why it sits so far below the anxiety in the headlines.
ECB Economic Bulletin research on yield curve inversion documents the empirical relationship between spread compression and subsequent recession probability in the euro area, providing the institutional framework underpinning the view that a positive 2s10s configuration carries materially different risk implications than a flat or inverted one.
| Metric | Value | Source |
|---|---|---|
| German Bund 2-year yield | ~2.89% | CentralBank.watch, 4 Sep 2026 |
| German Bund 10-year yield | ~3.37% | CentralBank.watch, 4 Sep 2026 |
| 2s10s Bund spread | ~+0.48 pp | CentralBank.watch, 4 Sep 2026 |
| Curve shape | Normal, upward-sloping | CentralBank.watch |
| 12-month recession probability | 12.20% | CentralBank.watch |
The ECB deposit rate currently stands at 2.25% after the July 2026 hold. Notably, the 2-year yield sits close to this level, which tells you the market is not pricing a prolonged, aggressive tightening sequence beyond the near term. Fisher Investments reads the recent steepening of the global curve the same way: as constructive for lending conditions and corporate financial health.
A steepening yield curve widens bank net interest margins by expanding the gap between short-term funding costs and longer-term lending returns, making credit origination more economically attractive and supporting the broader lending conditions that underpin corporate financial health.
Why the spread matters for banks and borrowers
When the curve slopes upward, banks earn a spread between what it costs them to fund themselves at the short end and what they earn lending at longer maturities. That spread is the engine of credit creation.
A positive 2s10s spread of nearly half a percentage point keeps that engine running. For you, the practical read is that the current configuration supports lending and, by extension, the broader corporate financial health that underpins equity and credit markets. Investors who equate “ECB hike” with automatic yield curve risk are conflating today’s setup with the inverted curves of past tightening cycles.
When big ASX news breaks, our subscribers know first
The distinction Fisher Investments is drawing: one hike versus a campaign
The core of the Fisher argument is a mechanism, not an assertion, and it is worth building piece by piece. Aggressive hiking cycles and single modest adjustments do very different things to a yield curve, and the difference is what separates a benign move from a recessionary one.
Consider how each path transmits into the curve:
- Aggressive sustained cycle: The central bank signals repeated hikes well above neutral. Short-dated yields rise quickly to reflect high policy rates for years ahead. Meanwhile, if markets expect that tightening to slow growth and eventually force cuts, long-dated yields stagnate or fall. Short exceeds long, the curve inverts, and that is the recession signal.
- Single modest adjustment: One move, communicated as fine-tuning rather than the start of a campaign, nudges the short end without materially repricing long-run growth and inflation expectations. The curve stays positive, and real-economy risk stays far lower.
According to Fisher Investments, the primary danger is not inflation per se, but rather the possibility that central banks pursue an unnecessarily aggressive tightening path, driven by a flawed diagnosis of price pressures, and flatten the curve as a consequence.
Apply that mechanism to the live ECB context, and the picture calms considerably. According to a Reuters poll of economists published on 3 September 2026, the ECB is expected to raise rates in September as the second and final move of the cycle.
Reuters characterised the anticipated cycle as “its shortest hiking campaign in 15 years.”
That framing is the anchor for everything. If the consensus caps the cycle at two total moves, the curve is not being asked to price a sustained above-neutral sequence.
The market has drawn the same conclusion. Ed Hutchings, head of developed market rates at Aviva Investors, noted via CNBC that traders had already priced in a +0.25 percentage point September hike. The move is, in other words, already absorbed.
That has a direct consequence for how you watch Thursday. If the hike is already in the price and the consensus caps the cycle at two, the announcement itself carries less new information than the communication that accompanies it. What matters is whether the ECB signals the door to further hikes is open or firmly shut. The 2-year Bund yield sitting close to the deposit rate reinforces the point: the market is not currently pricing a longer campaign, and misreading a routine adjustment as the opening of one is exactly the error that leads to premature repositioning in fixed income.
ECB communication after the July hold already signalled how the Governing Council is framing its September calculus, with the energy language in Lagarde’s statement and any acknowledgement of second-round effects carrying more forward-guidance weight than the rate number itself.
Why the inflation debate is not settled, and what that means for the curve
The whole constructive case rests on one contested assumption: that eurozone inflation is fundamentally energy-driven and therefore reversible. That is not a settled question. It is an active disagreement between two internally coherent camps, and the stakes are the series of meetings that might follow Thursday, not Thursday alone.
Fisher Investments sits firmly in the transitory camp. Its framework holds that sustained price growth requires sustained monetary expansion, and on that measure the firm notes that global money supply has been growing at a pace well short of what was observed during the pandemic years. Without that foundation, Fisher argues, energy-led price pressures lack the foundation to become entrenched and should continue to ease.
There is supporting evidence across the Atlantic. July 2026 US headline CPI came in at 3.4% year-over-year, its second consecutive deceleration, which CNN Business attributed largely to easing gasoline prices. That is a live demonstration of how quickly energy-led inflation can cool.
The hawkish camp is not making a weaker argument, only a different one. Reuters coverage of the July ECB meeting stressed that “renewed conflict in the Middle East has largely erased any hope of a quick moderation in energy costs.” Separately, Reuters has flagged a “war-induced peak” in inflation and an “unexpected pause in the decline,” signalling worry that stickiness extends beyond energy alone.
| Dimension | Transitory / energy camp | Persistent / hawkish camp |
|---|---|---|
| Inflation driver | Energy supply shock | Energy plus broader stickiness |
| Money supply condition | Moderate, below pandemic levels | Not the primary focus |
| Energy trajectory | Reversible as prices ease | Elevated by Middle East conflict |
| Implied ECB path | Cycle ends at two hikes | Risk of a longer, harder cycle |
The market itself leans hawkish, having already priced the September move. Here is where the debate connects back to the curve. The constructive signal is only threatened if the hawkish interpretation proves correct and forces a longer, harder tightening cycle that pushes the short end well above neutral.
For you, the practical takeaway is not to bet on which camp is right. It is to map your exposure to both. A steepening curve rewards positioning if the transitory view prevails; flattening or inversion risk builds if the hawkish view forces a longer cycle. The next real test arrives soon: the US August 2026 CPI print, scheduled by the Bureau of Labor Statistics for 11 September 2026.
The tail risks that could change the picture entirely
The constructive baseline is credible, but it is not guaranteed, and the honest move is to name the scenarios where it breaks. The point is not to panic. It is to convert vague anxiety into a specific, monitorable watchlist.
The first tail risk is a hawkish surprise. The Reuters economist baseline treats two total hikes, June and September 2026, as the complete cycle. Any outcome beyond that, whether an additional move or a September hike larger than +0.25 percentage points, would be a material deviation the curve has not yet priced.
The mechanical consequence is straightforward. A hawkish surprise would push the 2-year yield further above the 2.25% deposit rate, narrowing the positive 2s10s spread. As that spread compresses toward zero, the 12.20% recession probability estimate mechanically rises.
That is the key point to internalise: the recession probability is not a fixed number. It is spread-sensitive, and each hike beyond the two-move baseline tightens the spread and lifts the estimate.
CentralBank.watch notes that the steep, positive curve “can quickly lose its benign signal if policy or geopolitics shift in a hawkish direction.”
The primary exogenous driver of that hawkish forced hand is energy. Reuters has emphasised that renewed Middle East conflict has already erased hopes of a quick moderation in energy costs. Re-accelerating energy prices would keep headline inflation elevated, pressure the ECB to stay restrictive for longer, and squeeze margins at energy-intensive industries.
The relationship between energy prices and rate expectations has already been tested acutely in 2026; a sustained move in Brent above $110 per barrel earlier in the year simultaneously repriced Fed, ECB, and Bank of England trajectories, demonstrating how quickly a single commodity can collapse the market’s assumed policy path across multiple jurisdictions.
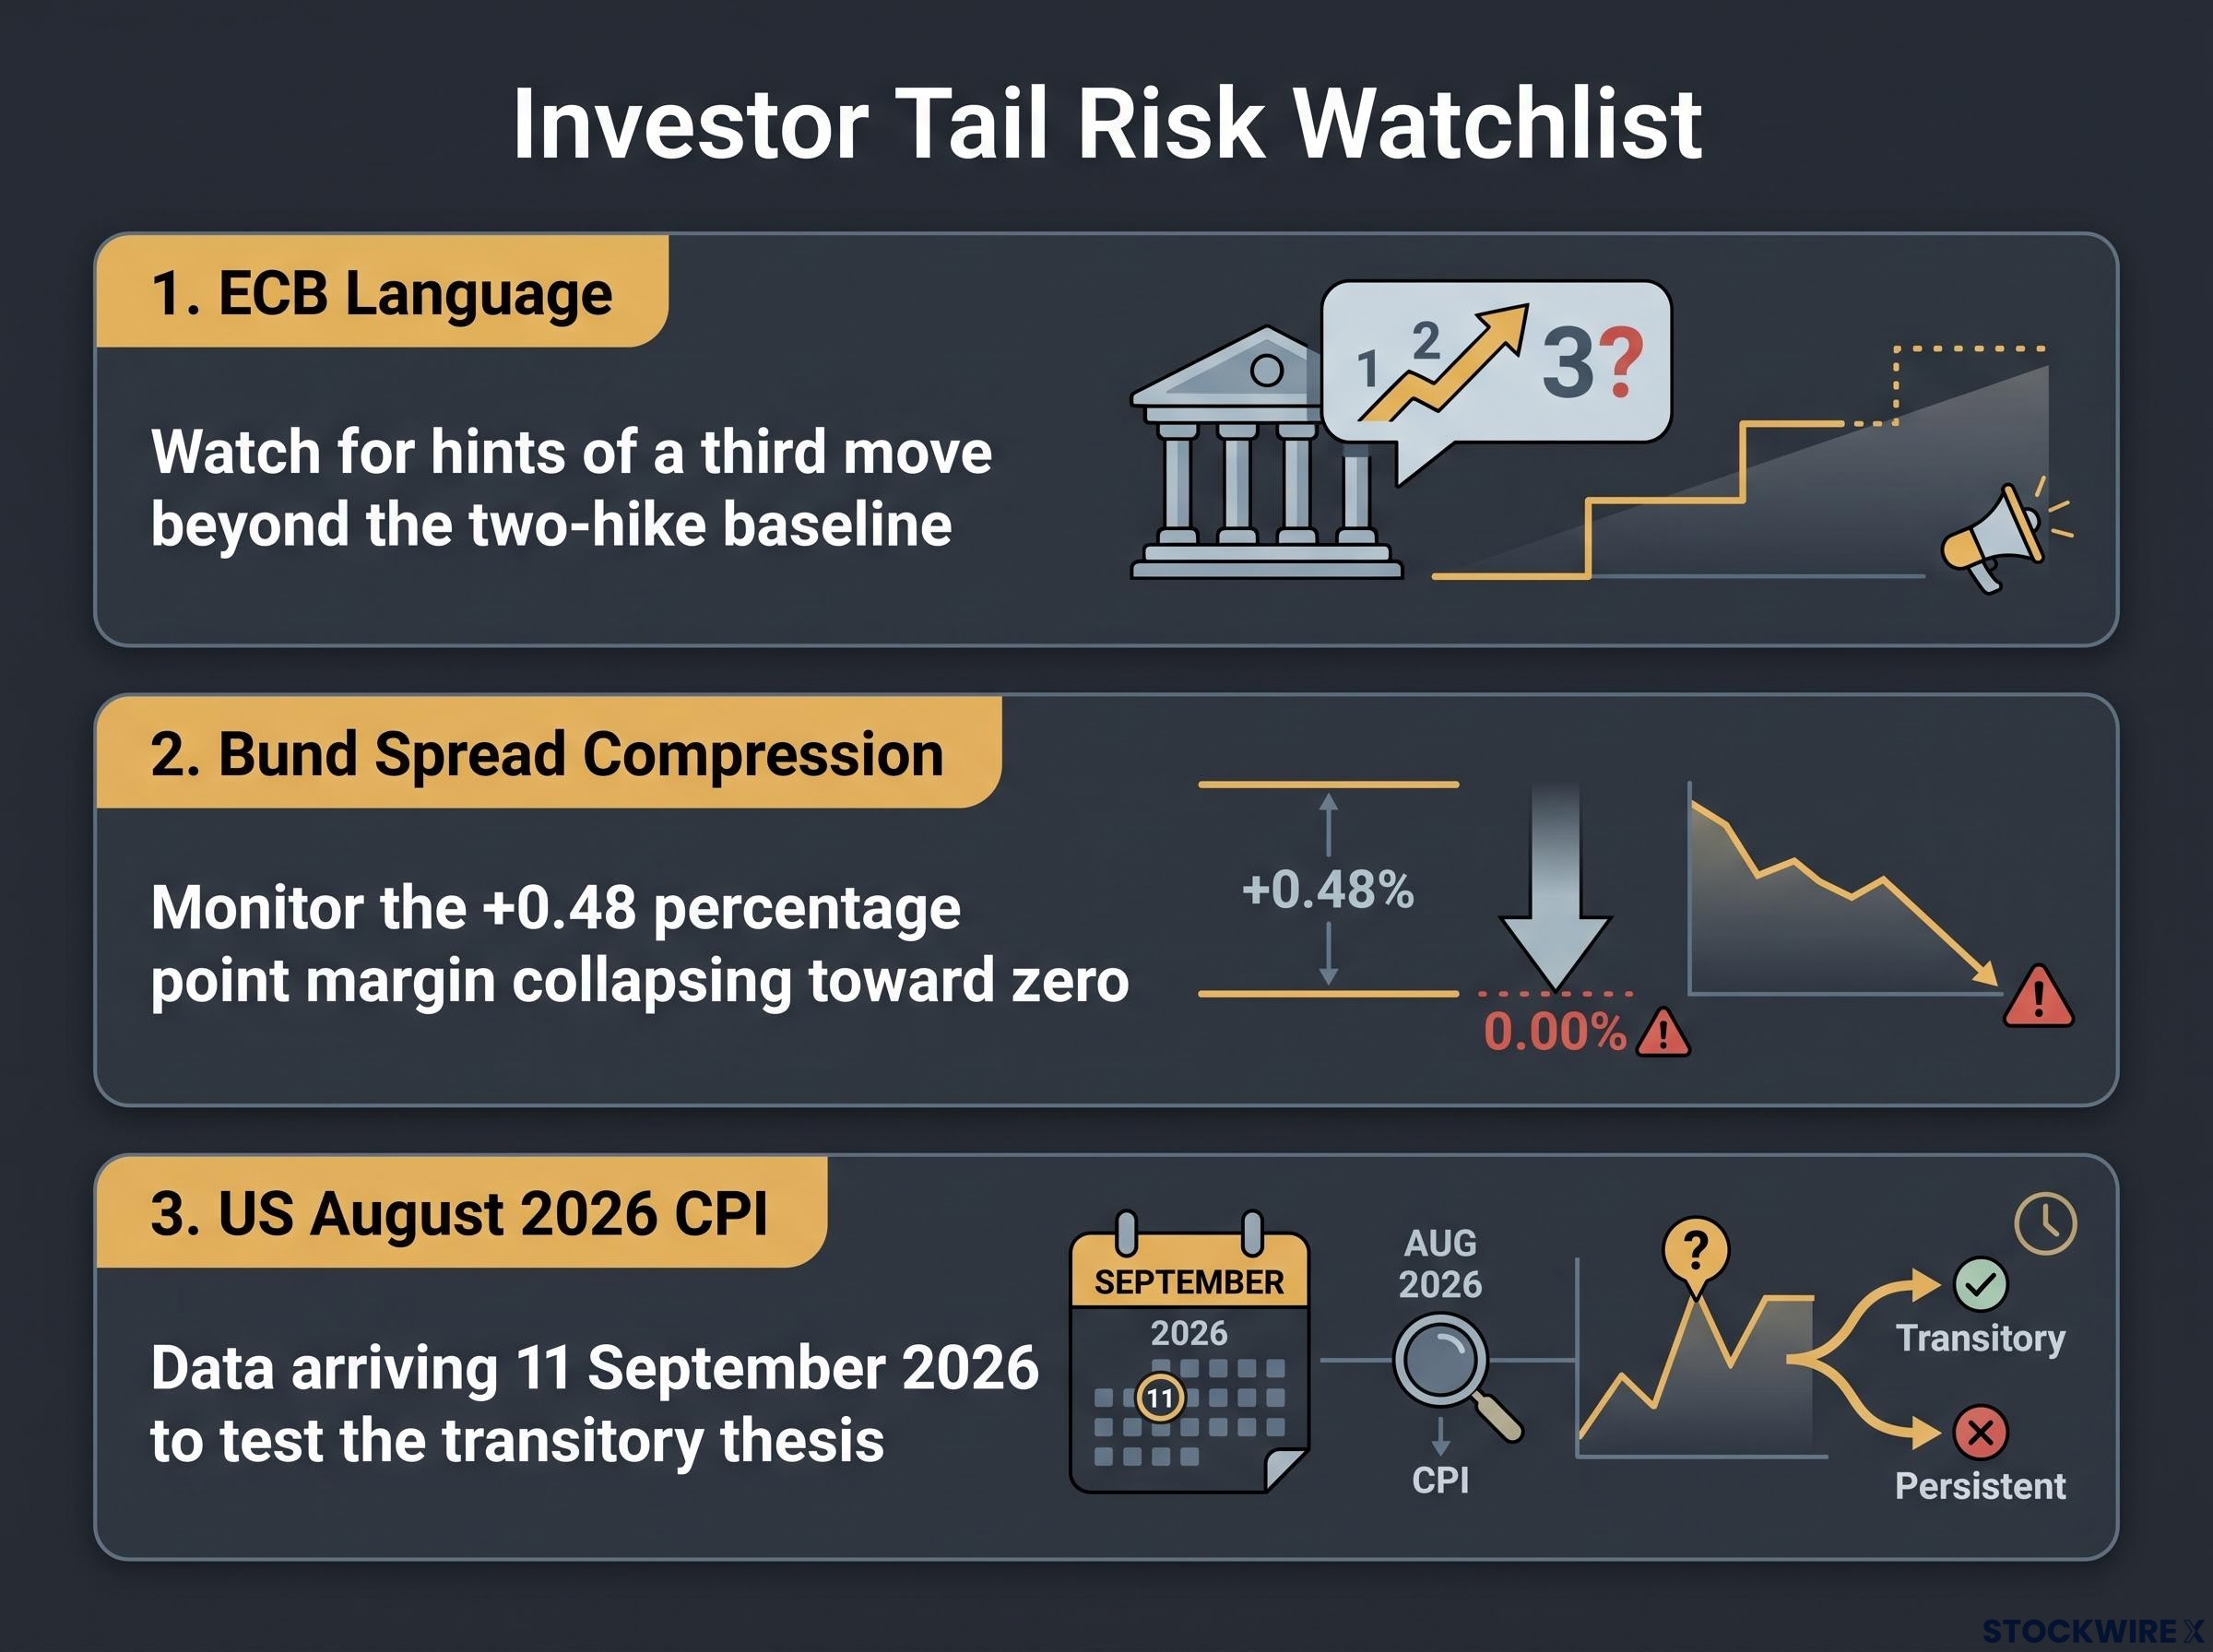
Rather than react to every headline, watch three specific conditions:
- ECB post-decision language on further hikes. Any hint of openness to a third move beyond the two-hike baseline is the most market-relevant element of Thursday’s communication.
- Movement in the 2s10s Bund spread. The current +0.48 percentage point margin is your comfort buffer. A collapse toward zero is the warning sign that the benign signal is fading.
- US August 2026 CPI on 11 September 2026. As a leading read on the transitory-versus-persistent debate, this print will either reinforce or complicate the energy-reversible thesis within days.
Investors who know exactly which conditions invalidate the constructive thesis can monitor them calmly, rather than flinching at every geopolitical headline.
Separating Thursday’s announcement from the decisions that follow it
Pull the threads together and the September hike, if it lands as consensus expects, is a data point already embedded in current pricing. Aviva Investors’ commentary confirms the +0.25 percentage point move is largely absorbed. Within the current consensus scenario, the curve’s constructive signal survives it.
That reframes how you should watch the event in real time. The rate number is the part you already know. The signal that carries genuine new information is the Governing Council’s language on whether the hiking cycle is complete, still open-ended, or subject to energy-driven reconsideration.
Fisher Investments’ framing sharpens the stakes: the real risk was never a single modest adjustment, but a shift to aggressive, sustained tightening driven by a misread of inflation’s nature. Because the Reuters poll caps the cycle at two moves, any language suggesting openness to a third is the most consequential thing the ECB could say.
Three signals deserve your attention:
- ECB press conference language on whether further hikes remain on the table.
- The Bund 2s10s spread in the 24 hours after the decision, watching for compression toward that half-point comfort margin.
- The 11 September US CPI print, arriving days later as an immediate pressure test on the transitory thesis.
Watching the press conference is more informative than watching the rate decision itself, and the CPI release three days later will either confirm or challenge the benign baseline before the month is out. Engage with the outcome analytically, using a framework, rather than improvising a response to a number you already knew was coming.
For readers wanting to situate the ECB’s September decision within the broader context of simultaneous Fed, BOJ, and Bank of England trajectories, our dedicated guide to global central bank divergence examines how the three irreconcilable policy paths of mid-2026 create distinct risks across bonds, equities, and cross-regional allocations.
This article is for informational purposes only and should not be considered financial advice. Investors should conduct their own research and consult with financial professionals before making investment decisions.
Past performance does not guarantee future results, and these forward-looking scenarios are speculative and subject to change based on market and geopolitical developments.