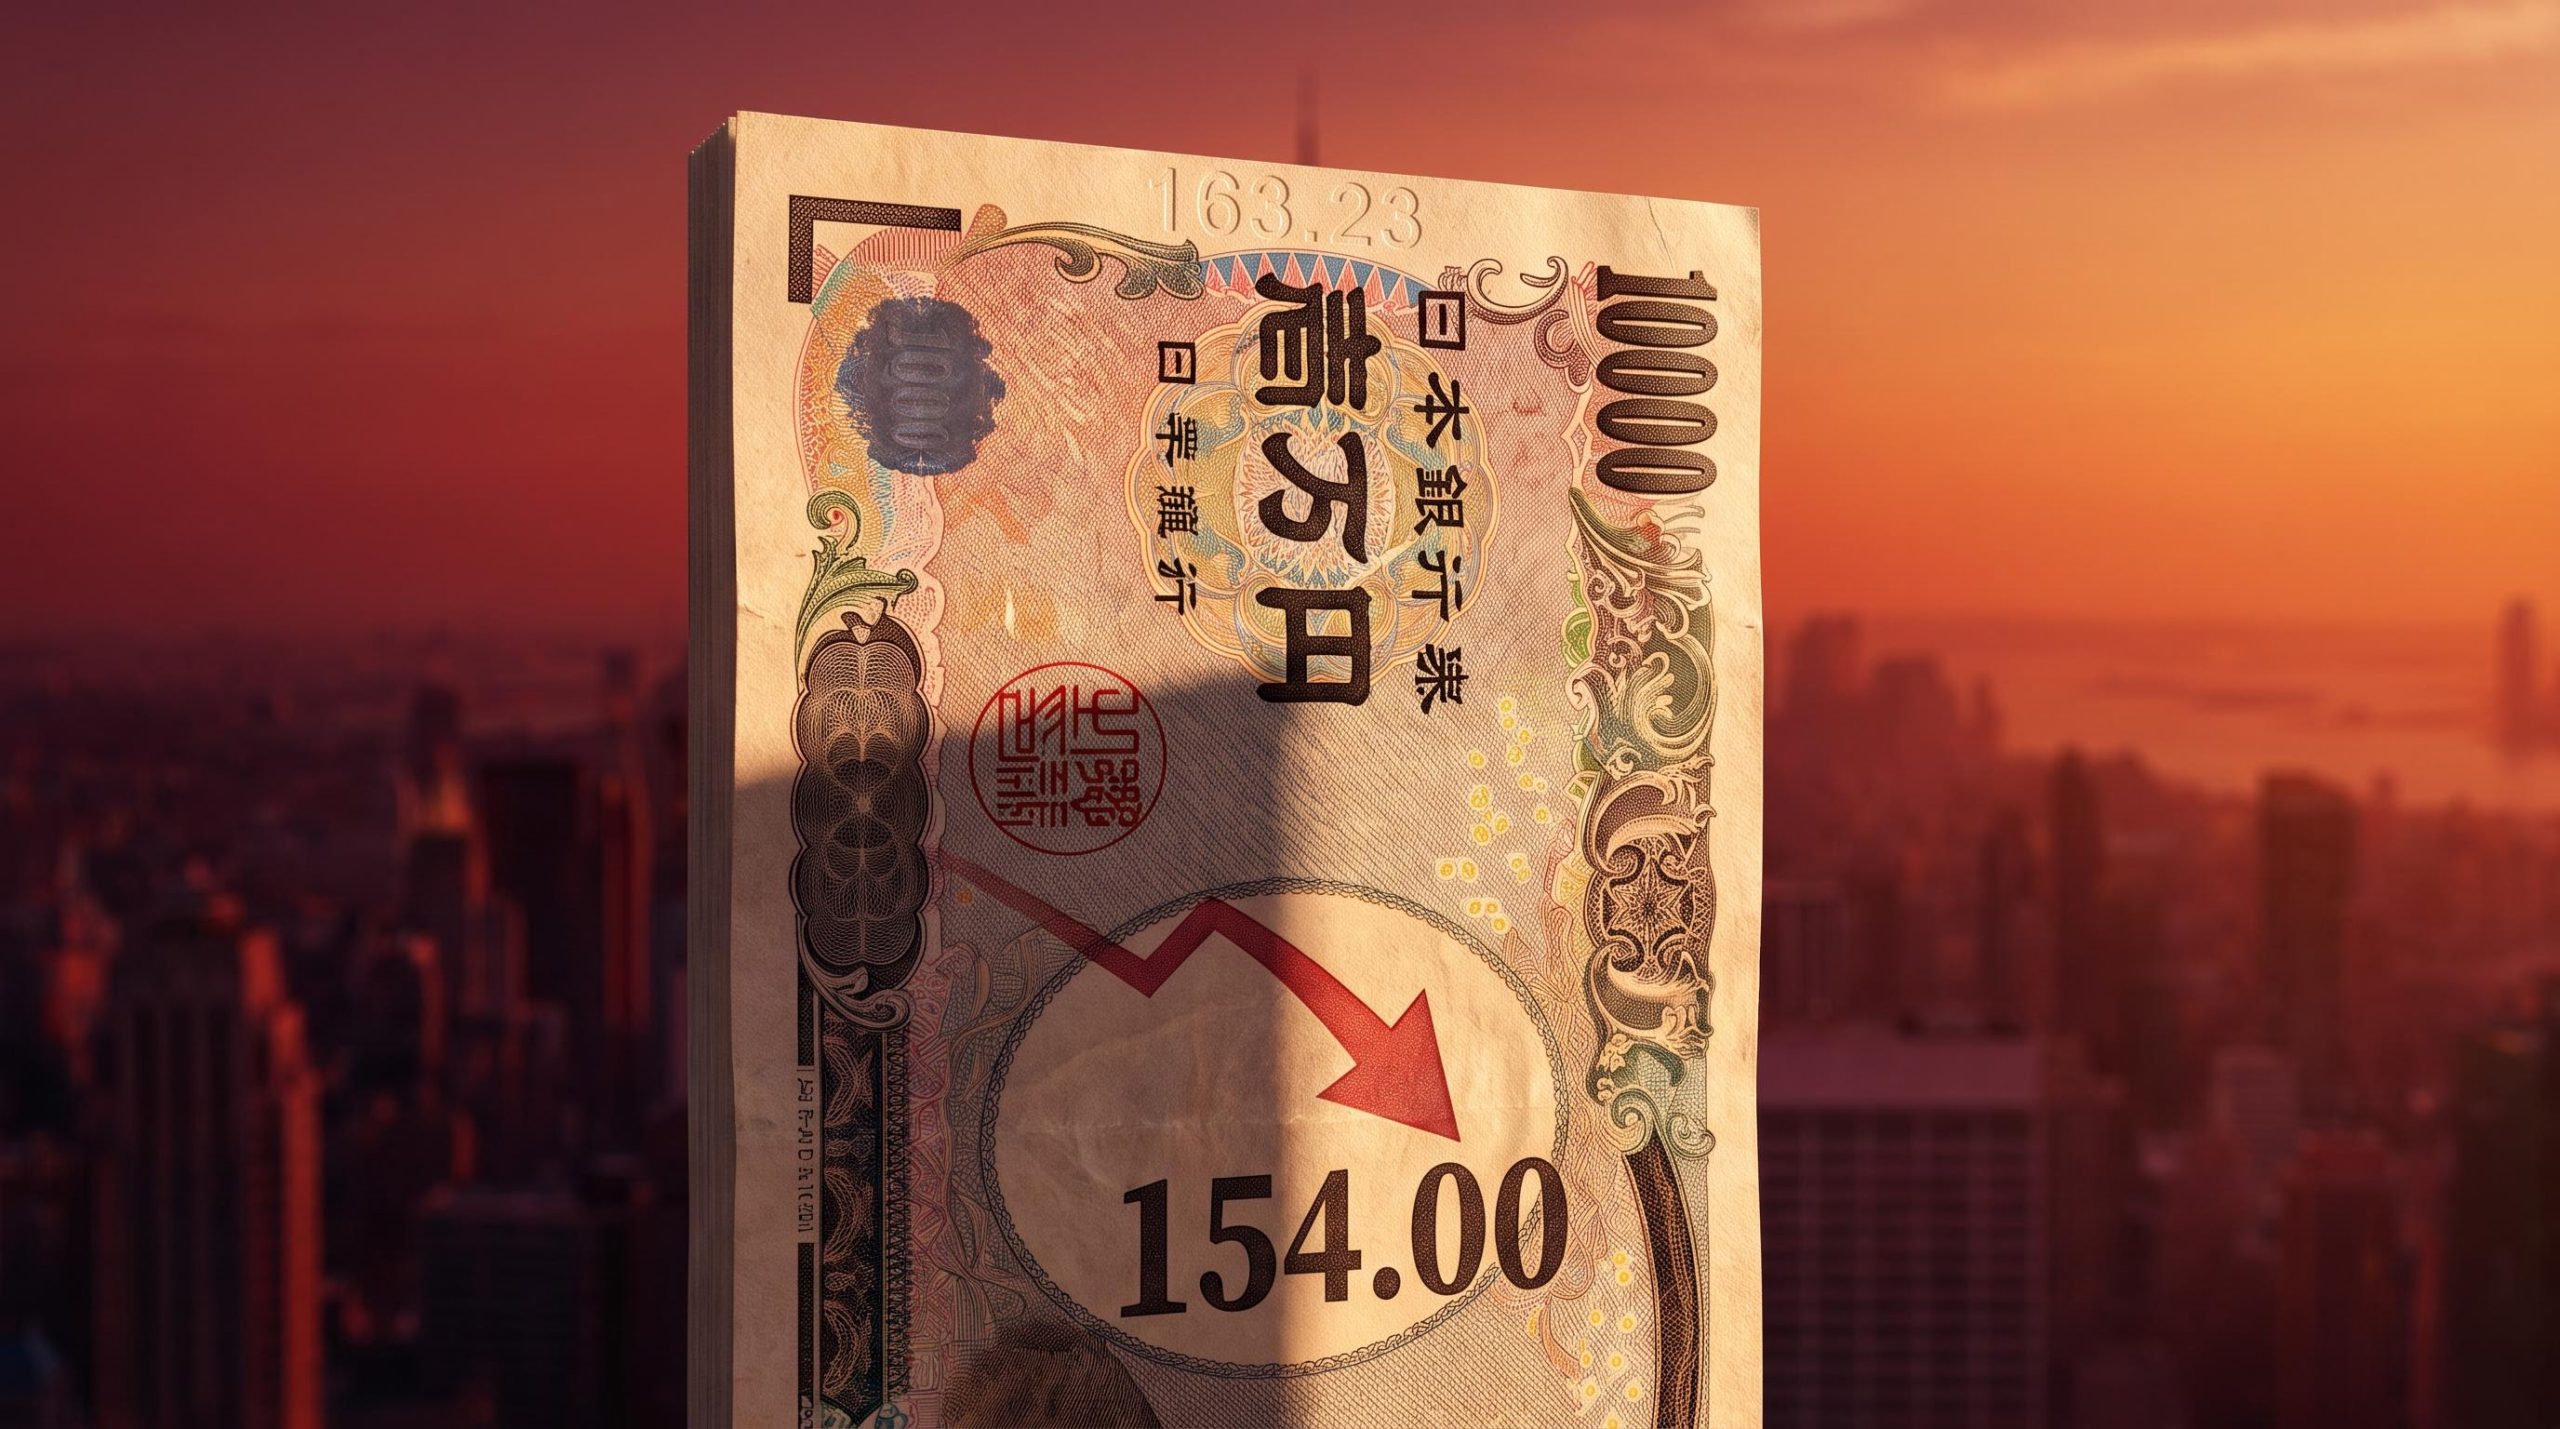
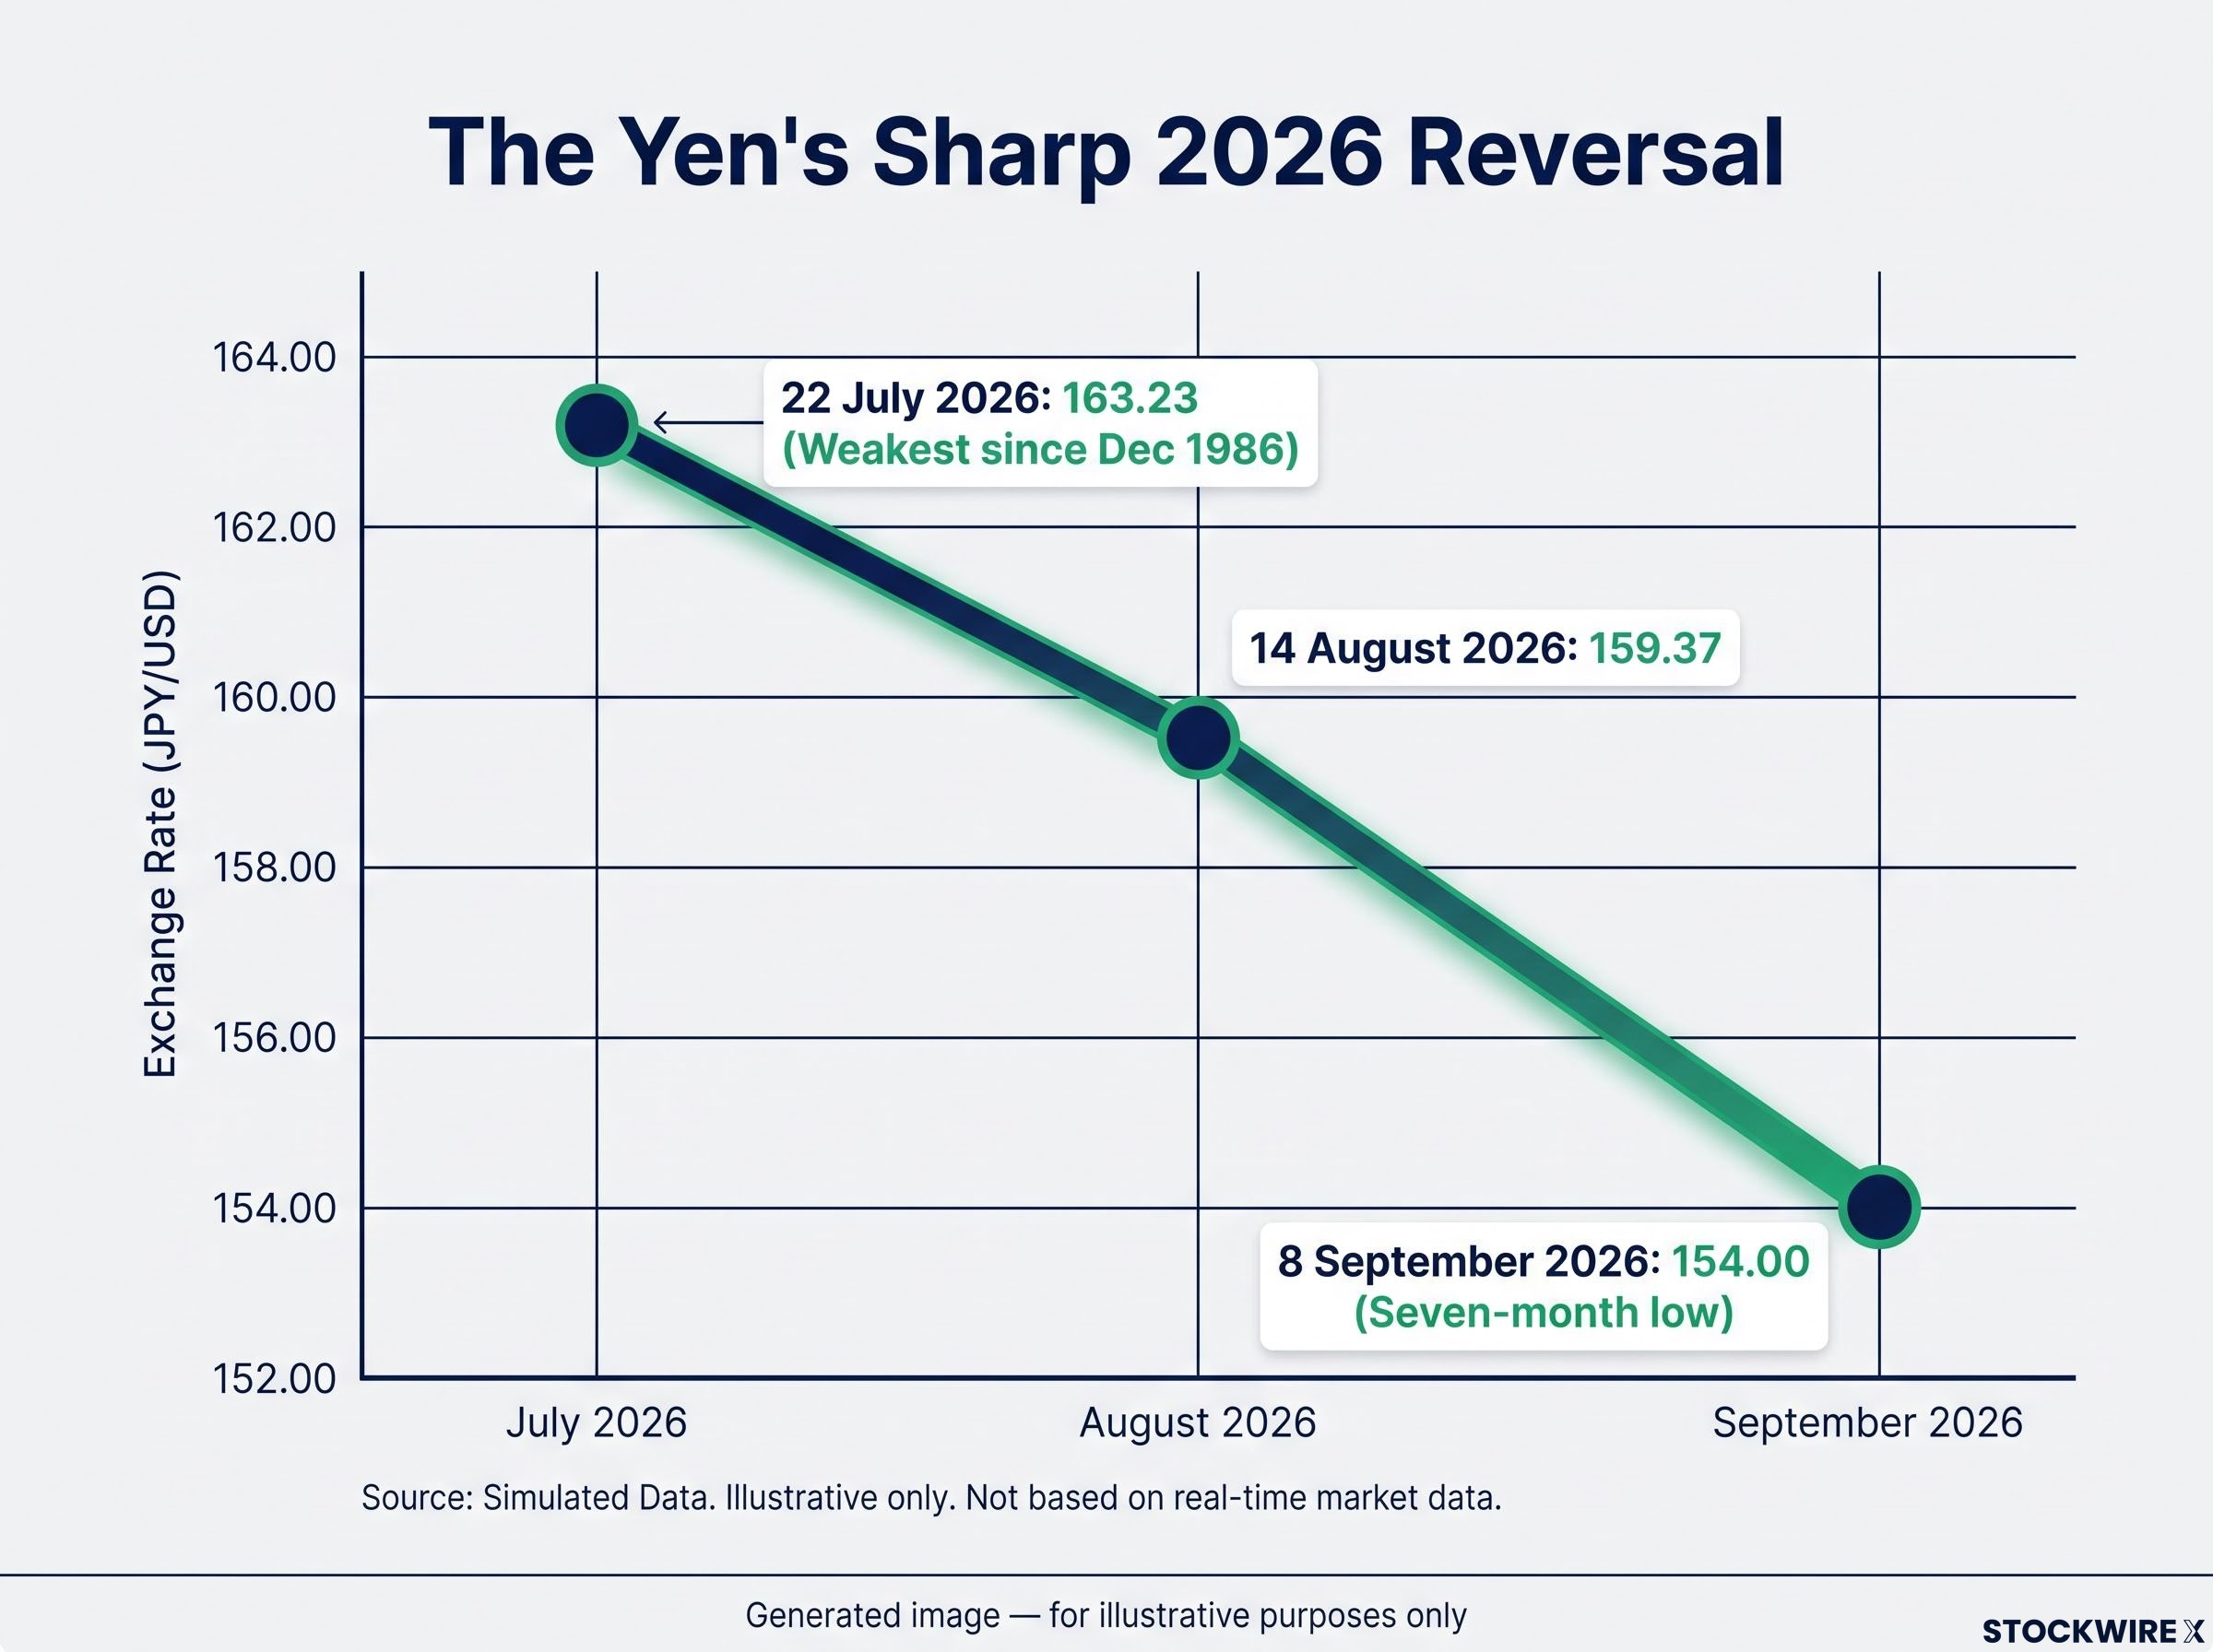
On 22 July 2026, the dollar bought 163.23 yen, the weakest the Japanese currency had been since December 1986. By 8 September 2026, that same dollar bought roughly 154.00 yen. That is a swing of nearly ten yen in a matter of weeks, the kind of directional shift that would normally play out over months.
Structural yen weakness persisted even after the BoJ lifted rates to a 31-year high, with USD/JPY holding above 159 as recently as August 2026, because the interest-rate differential, foreign equity hedging flows, and the BoJ’s continued bond purchases all worked against the currency simultaneously.
A move that fast is not noise. It is the visible surface of something structural. After decades of near-zero interest rates and two years of the yen sitting at multi-decade lows, the Bank of Japan (BoJ) is signalling a genuine policy shift, and markets are repricing at speed.
At the same time, crude oil pushed past $93 per barrel, driven by renewed US-Iran military tensions. These two moves are not separate headlines. They share a common driver, and they are reinforcing each other in ways that reach well beyond Japan.
Here is what the mechanics actually mean for you. If you hold global risk assets, have exposure to carry trades, or watch energy-linked inflation, this piece explains not just why the yen is moving, but what that move signals for your positioning going into the next phase of the cycle.
From four-decade lows to a seven-month high: what the yen’s move is actually telling you
Start with the arc, because the scale is the story. The yen did not drift stronger. It reversed hard, and it did so in stages that compressed a normal year of FX movement into a handful of weeks.
Here is the trajectory:
- 22 July 2026: 163.23 yen to the dollar, the weakest the yen had been since December 1986
- 14 August 2026: 159.37, after a surprise drop in US retail sales began pulling the pair lower
- 8 September 2026: 154.00, a seven-month low for USD/JPY and the strongest the yen had traded since early 2026
That final figure matters most. A seven-month low for USD/JPY means the yen recovered meaningful ground against the dollar, and it did so without any official hand on the wheel.
The key interpretive fact: Reuters data confirmed no direct intervention by the Bank of Japan or the Ministry of Finance was behind this move. This was the market repricing on its own.
That absence of intervention is what gives the reversal its weight. When a government sells dollars to prop up its currency, the effect can reverse the moment the buying stops. A market-driven move is different. It reflects a genuine change in how investors view Japan’s monetary future.
So when you read the yen at 154.00, do not read it as a temporary administrative fix. Read it as the market telling you it now expects a fundamentally different rate path from the Bank of Japan than it did in July. That distinction changes everything about how durable the move is likely to be.
When big ASX news breaks, our subscribers know first
How the Bank of Japan is changing the rules it set for a generation
For a generation, the rule was simple: Japanese interest rates were effectively zero, and everyone built their strategies around that assumption. That rule is now changing.
The BoJ hiked its policy rate from 0.50% to 0.75% in December 2025, then held at 0.75% through January 2026 while signalling more to come. Reuters reported on 12 June 2026 that the Bank was preparing to lift rates to a 31-year high, with board members likely to move the policy rate from 0.75% to 1.00%, a level not seen since 1995.
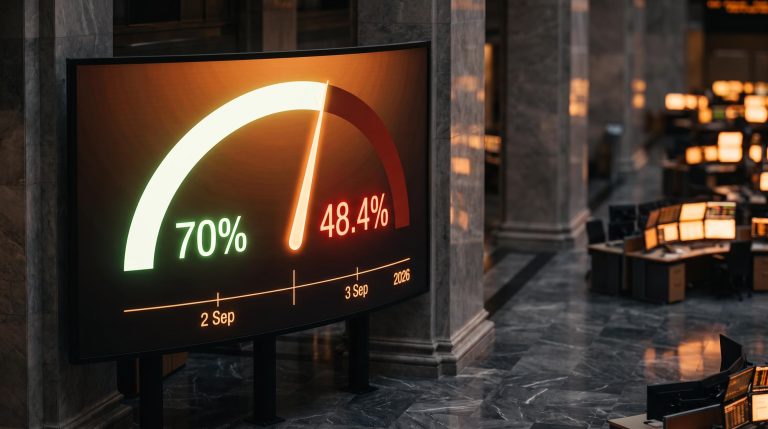
Then came the hawkish turn in language. On 31 July 2026, the BoJ warned for the first time that underlying inflation could exceed its 2% target, and stated that future policy discussions would focus on upside price risks. That was a direct signal that a hike could come as soon as September.
BoJ forward guidance shifted materially when Deputy Governor Himino declared the Bank does not need complete information before acting, a structural departure from a decade of data-confirmation-first communication that markets are now pricing at roughly 78-85% probability of a September hike.
| Date | Policy Rate | Context / Signal |
|---|---|---|
| December 2025 | 0.50% to 0.75% | Hike, hawkish tilt begins |
| January 2026 | 0.75% (held) | Held, but signalled more hikes |
| June-July 2026 | 0.75% | Prospective path toward 1.00% flagged (31-year high) |
| September 2026 | 0.75% | Forward guidance on upside inflation risks; hike live |
The internal dynamics reinforce the direction. Bloomberg reported that BoJ board member Naoki Takata, a known hawk, floated outsized rate increases and urged the Bank to act quickly.
Takata called for “nimble” moves to stop price risks from becoming entrenched, encouraging markets to price in a quicker or larger hike than the quarter-point-every-six-months cadence the BoJ had been running.
Why a 1% rate still moves global markets
A 1% policy rate sounds trivial in absolute terms. Most major central banks would consider that a rounding error. So why does it move global markets?
The answer is policy divergence. For years, the yen was cheap to borrow because Japanese rates sat near zero while US rates were far higher. That gap made yen-funded strategies enormously attractive. As Japanese rates rise and the gap narrows, the economic logic of borrowing cheap yen to invest elsewhere weakens.
The mechanism works through expectations, not just actual moves. Markets price the anticipated rate, not only the current one. So the moment the BoJ signals a credible path toward 1%, positioning shifts before the hike even lands.
For you, the read is this: if you had been borrowing yen at near-zero to fund higher-yielding positions, even a move to 1% changes the arithmetic of those trades materially. That is why a rate high not seen since 1995 registers as the beginning of a regime change rather than a footnote.
The carry trade and why yen strength sends ripples through global risk assets
To understand why a currency move in Tokyo ripples through markets in Brazil and Indonesia, you need to understand the carry trade. It is simpler than it sounds.
A yen carry trade works like this: you borrow money in yen, where interest rates are low, and you invest it in a higher-yielding currency or risk asset somewhere else. As long as the yen stays stable or weakens, you pocket the difference in yields. For years, with the yen near four-decade lows in the 162-163 range through June and July 2026, conditions for this trade were close to ideal.
Now watch what happens when the yen strengthens and the logic reverses:
- The BoJ signals higher rates, and markets begin pricing them in.
- The yen strengthens sharply, moving from 163 toward 154 in weeks.
- Traders face a double squeeze: the cost of borrowing yen rises, and their short-yen positions lose money as the currency appreciates.
- Traders unwind those positions, selling the emerging-market currencies and high-yield credit they had bought, which accelerates the yen’s rise further.
The speed matters here. A reversal from 163 to 154 in weeks compresses the unwind timeline, and a compressed unwind amplifies volatility. Reuters and Bloomberg have both framed this carry unwind as a spillover risk into emerging-market FX and high-yield credit, not a contained Japan story.
This is where the yen move becomes relevant to you even if you hold no yen at all. If you own a fund with emerging-market exposure or a high-yield allocation, the unwind of yen-funded trades affects the assets that fund holds. The currency move in Tokyo repositions risk premia far from Japan.
There is an important caveat. Reuters explicitly flags that BoJ tightening remains data-dependent and reversible, which tempers the unwind scenario. The Bank could slow or pause if growth or external shocks intervene, so the cascade is a risk, not a certainty.
Historically, carry unwind risk has been more episodic than systemic: the 2024 episode, described at peak fear as the largest unwind in history, resolved within weeks once 40-60% of speculative positioning cleared, with no cascading breakdown in global equity markets following.
Crude oil above $93 and a record diesel crack spread: why energy and the yen are telling the same story
Here is the connection most coverage misses: the yen surge and the oil surge are not two separate events. They share a single driver, and for Japan specifically, they amplify each other.
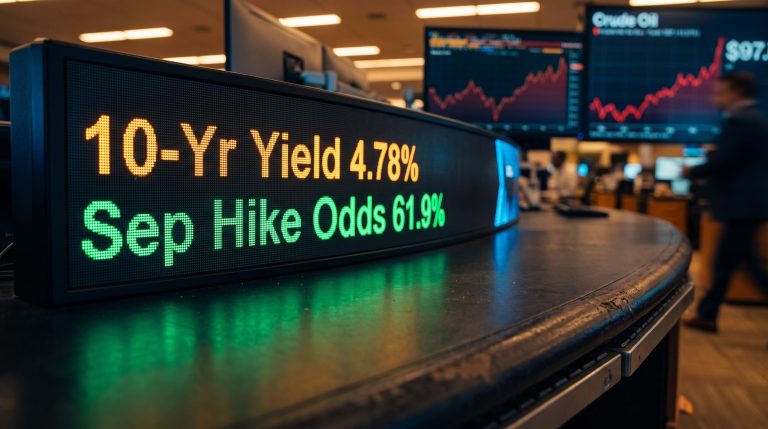
Crude climbed hard into September. WTI pushed above $93.00 per barrel on 8 September 2026, a three-month high, after settling at $91.48 on 4-5 September and trading near $89.48 around 1 September. Brent moved in step, settling at $96.28 on 4-5 September after $93.93 at the start of the month. The catalyst was renewed US-Iran military tensions disrupting Middle East supply routes.
Refining margins went to historic extremes alongside the crude move. The US diesel crack spread, the premium of ultra-low sulphur diesel over crude, hit an intraday record of roughly $102 per barrel on 8 September, within a broader run that had touched an LSEG-record near $106 per barrel around 1 September.
| Date | WTI Price | Brent Price | US Diesel Crack Spread |
|---|---|---|---|
| 1 September 2026 | ~$89.48 | $93.93 | ~$106 (LSEG record) |
| 4-5 September 2026 | $91.48 | $96.28 | Near record |
| 8 September 2026 | Above $93.00 | Elevated | ~$102 (intraday record) |
The Japan connection is direct. Japan imports nearly all of its oil, so rising crude is straightforwardly inflationary for the Japanese economy. That is precisely the pressure pushing the BoJ toward its hawkish stance.
- Oil prices rise on Middle East supply fears.
- Japanese import costs rise, because the country buys almost all its crude from abroad.
- BoJ inflation pressure rises, strengthening the case for rate hikes.
Reuters captured the loop directly, reporting that the BoJ is expected to raise rates “unless a sharp escalation in the Middle East conflict upends markets.” The energy shock and the policy pivot are mutually reinforcing, not independent.
What record crack spreads signal beyond the pump price
The diesel crack spread measures the premium of ultra-low sulphur diesel over crude oil. In plain terms, it is a proxy for refining margins and for cost pressure moving downstream through the economy, from trucks to factories to freight.
The diesel crack spread crossing $100 per barrel for the first time on record represents a structural break rather than a seasonal fluctuation: the reading sits four to six times above the normal $15-$40 range, and three compounding supply shocks, including Ukrainian drone strikes on Russian refining capacity and Middle Eastern shipping lane constraints, drove it there simultaneously.
Record spreads in LSEG data going back to 2001 place this episode in real historical context. This is not a routine commodity wobble. It is a stress signal in the refining system, and historically that kind of stress precedes broader inflationary pass-through.
For you, the takeaway extends past the fuel pump. Record crack spreads signal persistent cost-push inflation seeping through transport and industrial sectors worldwide, which makes central bank decisions more constrained everywhere and makes the BoJ’s pivot far less likely to be a one-off.
What shifts when both forces are in play at once
Put the two threads side by side, and the picture sharpens. Tighter Japanese policy, elevated energy prices, and geopolitical uncertainty are all pushing in the same direction: higher global risk premia and more selective risk-taking. They compound rather than cancel.
That said, the outlook is genuinely uncertain, not one-directional. The BoJ’s path remains explicitly data-dependent and reversible. A sharp Middle East escalation could cut either way: it could delay hikes if growth fears dominate, or accelerate them if inflation fears win out.
The single conditional that captures the binary risk: the BoJ is expected to hike, per Reuters, “unless a sharp escalation in the Middle East conflict upends markets.”
Both Reuters and Bloomberg characterise the interaction of tighter Japanese policy and geopolitical commodity risk as risk-reinforcing rather than risk-neutral, pointing to higher volatility and more selective positioning ahead.
Three variables will determine the next phase:
- The BoJ’s September meeting outcome. The 31 July guidance on upside inflation risks made a September hike a live possibility, and a move to 1% would mark a 31-year high, structurally different from incremental tweaks in a low-rate regime.
- The trajectory of WTI and Brent relative to the $93-$96 range. If crude holds or climbs, the imported-inflation pressure on Japan persists and the hawkish case strengthens.
- Any shift in US-Iran tensions. An easing removes the supply-disruption risk premium; an escalation deepens it and complicates every central bank’s calculus.
The practical orientation for you is this: in the current environment, watch Japan’s rate decisions and Middle East developments as a paired signal, not as separate asset-class stories. They move together now.
Reading the yen and oil signals together in a world still adjusting to higher rates
The most useful way to hold all of this is as a single connected system rather than a set of isolated headlines.
Treat the BoJ pivot as the end of a long-standing structural assumption. For decades, global markets took near-zero yen funding as a permanent feature. A prospective move to 1%, a level not seen since 1995, closes that era. Investors who built strategies around effectively free yen funding face a genuine regime shift, not a passing disruption. The context is stark: the yen had stretched to its weakest since December 1986 at the recent extreme before this reversal began.
Treat the crude and crack spread data as a persistent inflation signal, not a spike. With diesel crack spreads at records in data going back to 2001 and WTI holding above the $89-$93 range, the energy-driven pressure is not resolving quickly. That constrains the policy space of every major central bank, not just the BoJ.
Once you understand how BoJ policy, carry trade dynamics, and energy inflation interact, the next USD/JPY move, the next BoJ statement, and the next crude surge stop reading as separate events. They become instruments in one connected system.
That is the durable value here. The specific figures of September 2026 will age, but the framework for reading them will not. Pick up the next BoJ headline and you can place it immediately within the carry trade and inflation picture laid out above, rather than treating it as standalone FX news.
This article is for informational purposes only and should not be considered financial advice. Investors should conduct their own research and consult with financial professionals before making investment decisions.
Past performance does not guarantee future results. Financial projections are subject to market conditions and various risk factors. Forward-looking statements regarding central bank policy and commodity prices are speculative and subject to change based on market developments.