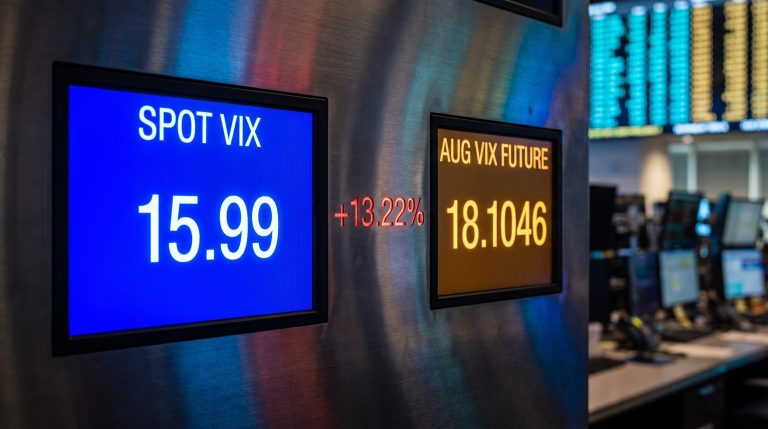
You have a short-volatility thesis on a single tech name that is working. You sold premium into an inflated implied volatility ahead of earnings, the results landed inside the expected range, and the position is decaying nicely in your favour. Then the whole market rolls over, the index sells off hard, and your comfortable short-premium trade becomes a scramble to defend against a move that has nothing to do with your original view.
That friction is exactly where cash-settled index options earn their place. Products like the Nasdaq-100 index option (NDX) are increasingly used not as the macro alternative to single-stock options, but as a deliberate complement to them. The structural features driving this, cash settlement, favourable tax treatment under Section 1256 of the US tax code, and margin efficiency, are less widely understood than the option mechanics themselves.
The timing made the point clear. Across late July and August 2026, major technology earnings triggered sharp implied volatility spikes followed by rapid mean-reversion, putting these dynamics on live display.
After this, you will know which structural features of cash-settled index options make them worth pairing with single-stock positions, how to read the implied-versus-realised relationship to time your entries, how the pairing works as a live trade, and where it can break.
Why cash settlement changes the operational equation for volatility traders
Ask any trader who runs short premium what they actually hate about managing equity or ETF options into expiration, and the same answers come back. Early assignment out of nowhere. Getting exercised into a stock position you never wanted. Scrambling to arrange stock borrow or financing at the worst possible moment. None of these have anything to do with your volatility view, yet all of them can force expensive action right when you are already stretched.
Cash settlement removes that entire category of problem.
NDX and its micro-contract sibling XND are European-style products, which means they cannot be exercised early and settle to cash at expiration rather than delivering shares. There is no assignment risk, no share delivery, no borrow to arrange. The position simply resolves to a cash figure and closes out.
That contrasts sharply with American-style ETF options like the Nasdaq-100 tracking ETF (QQQ). QQQ options can be assigned early, and short deep-in-the-money positions carry a genuine hazard around dividend dates: a real operational trap for anyone running short premium.
Here is how the three core differences stack up:
- Early assignment: NDX cannot be assigned early; QQQ can, including the dividend-date risk on short in-the-money positions.
- Margin treatment: Under portfolio margin, NDX exposure can be netted against correlated futures, ETFs, and single-stock positions, often lowering the requirement versus an equivalent QQQ-based hedge.
- Settlement: NDX resolves to cash with no stock changing hands; QQQ can deliver shares you then have to manage.
Section 1256 tax treatment Under US tax rules, broad-based index options such as NDX, SPX, and RUT are treated as Section 1256 contracts, taxed 60% at long-term rates and 40% at short-term rates. QQQ options receive no such treatment and are taxed entirely as short-term gains if held under a year.
For a high-turnover volatility trader, that split is a durable edge, not a rounding error.
The IRS Form 6781 instructions define Section 1256 contracts, specify the mandatory mark-to-market accounting requirement at year-end, and confirm the 60% long-term and 40% short-term treatment that applies regardless of how long you held the position.
| Feature | NDX / Cash-Settled Index Options | QQQ / ETF Options |
|---|---|---|
| Early assignment risk | None (European-style) | Present, including dividend-date risk |
| Tax treatment | Section 1256: 60% long-term / 40% short-term | Entirely short-term if held under a year |
| Margin netting | Nets against correlated futures, ETFs, stocks | Less efficient recognition of correlation |
| Settlement mechanic | Cash-settled, no share delivery | Physical delivery of shares possible |
The XND micro-contract exists for smaller accounts that need finer hedge sizing, though public liquidity data for it remains thin. And demand is climbing: platform data referenced by Kevin Davitt of Nasdaq shows continued growth in NDX and XND usage among tastytrade participants. For you, the takeaway is simple. In fast markets, these mechanics remove a class of risk that could otherwise force costly management exactly when your thesis is under pressure.
When big ASX news breaks, our subscribers know first
Reading implied versus realised volatility to time your entry
Structural advantages get you nothing if your timing is wrong. So how do you know when the environment actually favours selling volatility rather than buying it?
Start with the relationship between two numbers. Implied volatility is what the options market is pricing in as the expected daily range. Realised volatility is how much the underlying actually moved. When the real movement keeps landing inside the range that options pricing implied, the market has under-delivered relative to what buyers paid for. That is the setup premium sellers want.
Implied volatility is what the options market is pricing in as the expected daily range. If you need a grounding in how that number is extracted from live option prices and why it shifts the value of every Greek on your chain, the concept of implied volatility is covered in full in our explainer built around real options chains and regime filters.
The trap most traders fall into is treating low implied volatility as automatically good for selling. It is not. The spread between implied and realised at that specific moment is the metric that matters, not the level of implied volatility on its own.
Three conditions together characterise an environment tilted toward selling:
- Implied volatility sitting above realised volatility.
- Realised volatility declining after a shock has passed.
- Implied volatility elevated relative to its own history.
Get those three lining up and you have an observable, repeatable signal rather than a directional guess about where the market goes next.
What the late July through August 2026 window showed in practice
The recent Nasdaq-100 earnings cycle put this on display. In late July 2026, the expected daily move columns on NDX options were substantially wider than they were roughly three weeks later, reflecting the premium priced into major technology earnings. Once results were absorbed, that premium collapsed.
In the two weeks leading into the tastytrade discussion, implied volatility fell while realised volatility rose, conditions Kevin Davitt of Nasdaq and Jamal Chandler of tastytrade described as more favourable for selling NDX options than buying them. The August 3-4 market repricing event served as the inflection point, with selling opportunities surfacing in the sessions that followed.
The current backdrop tells you the same story from a different angle.
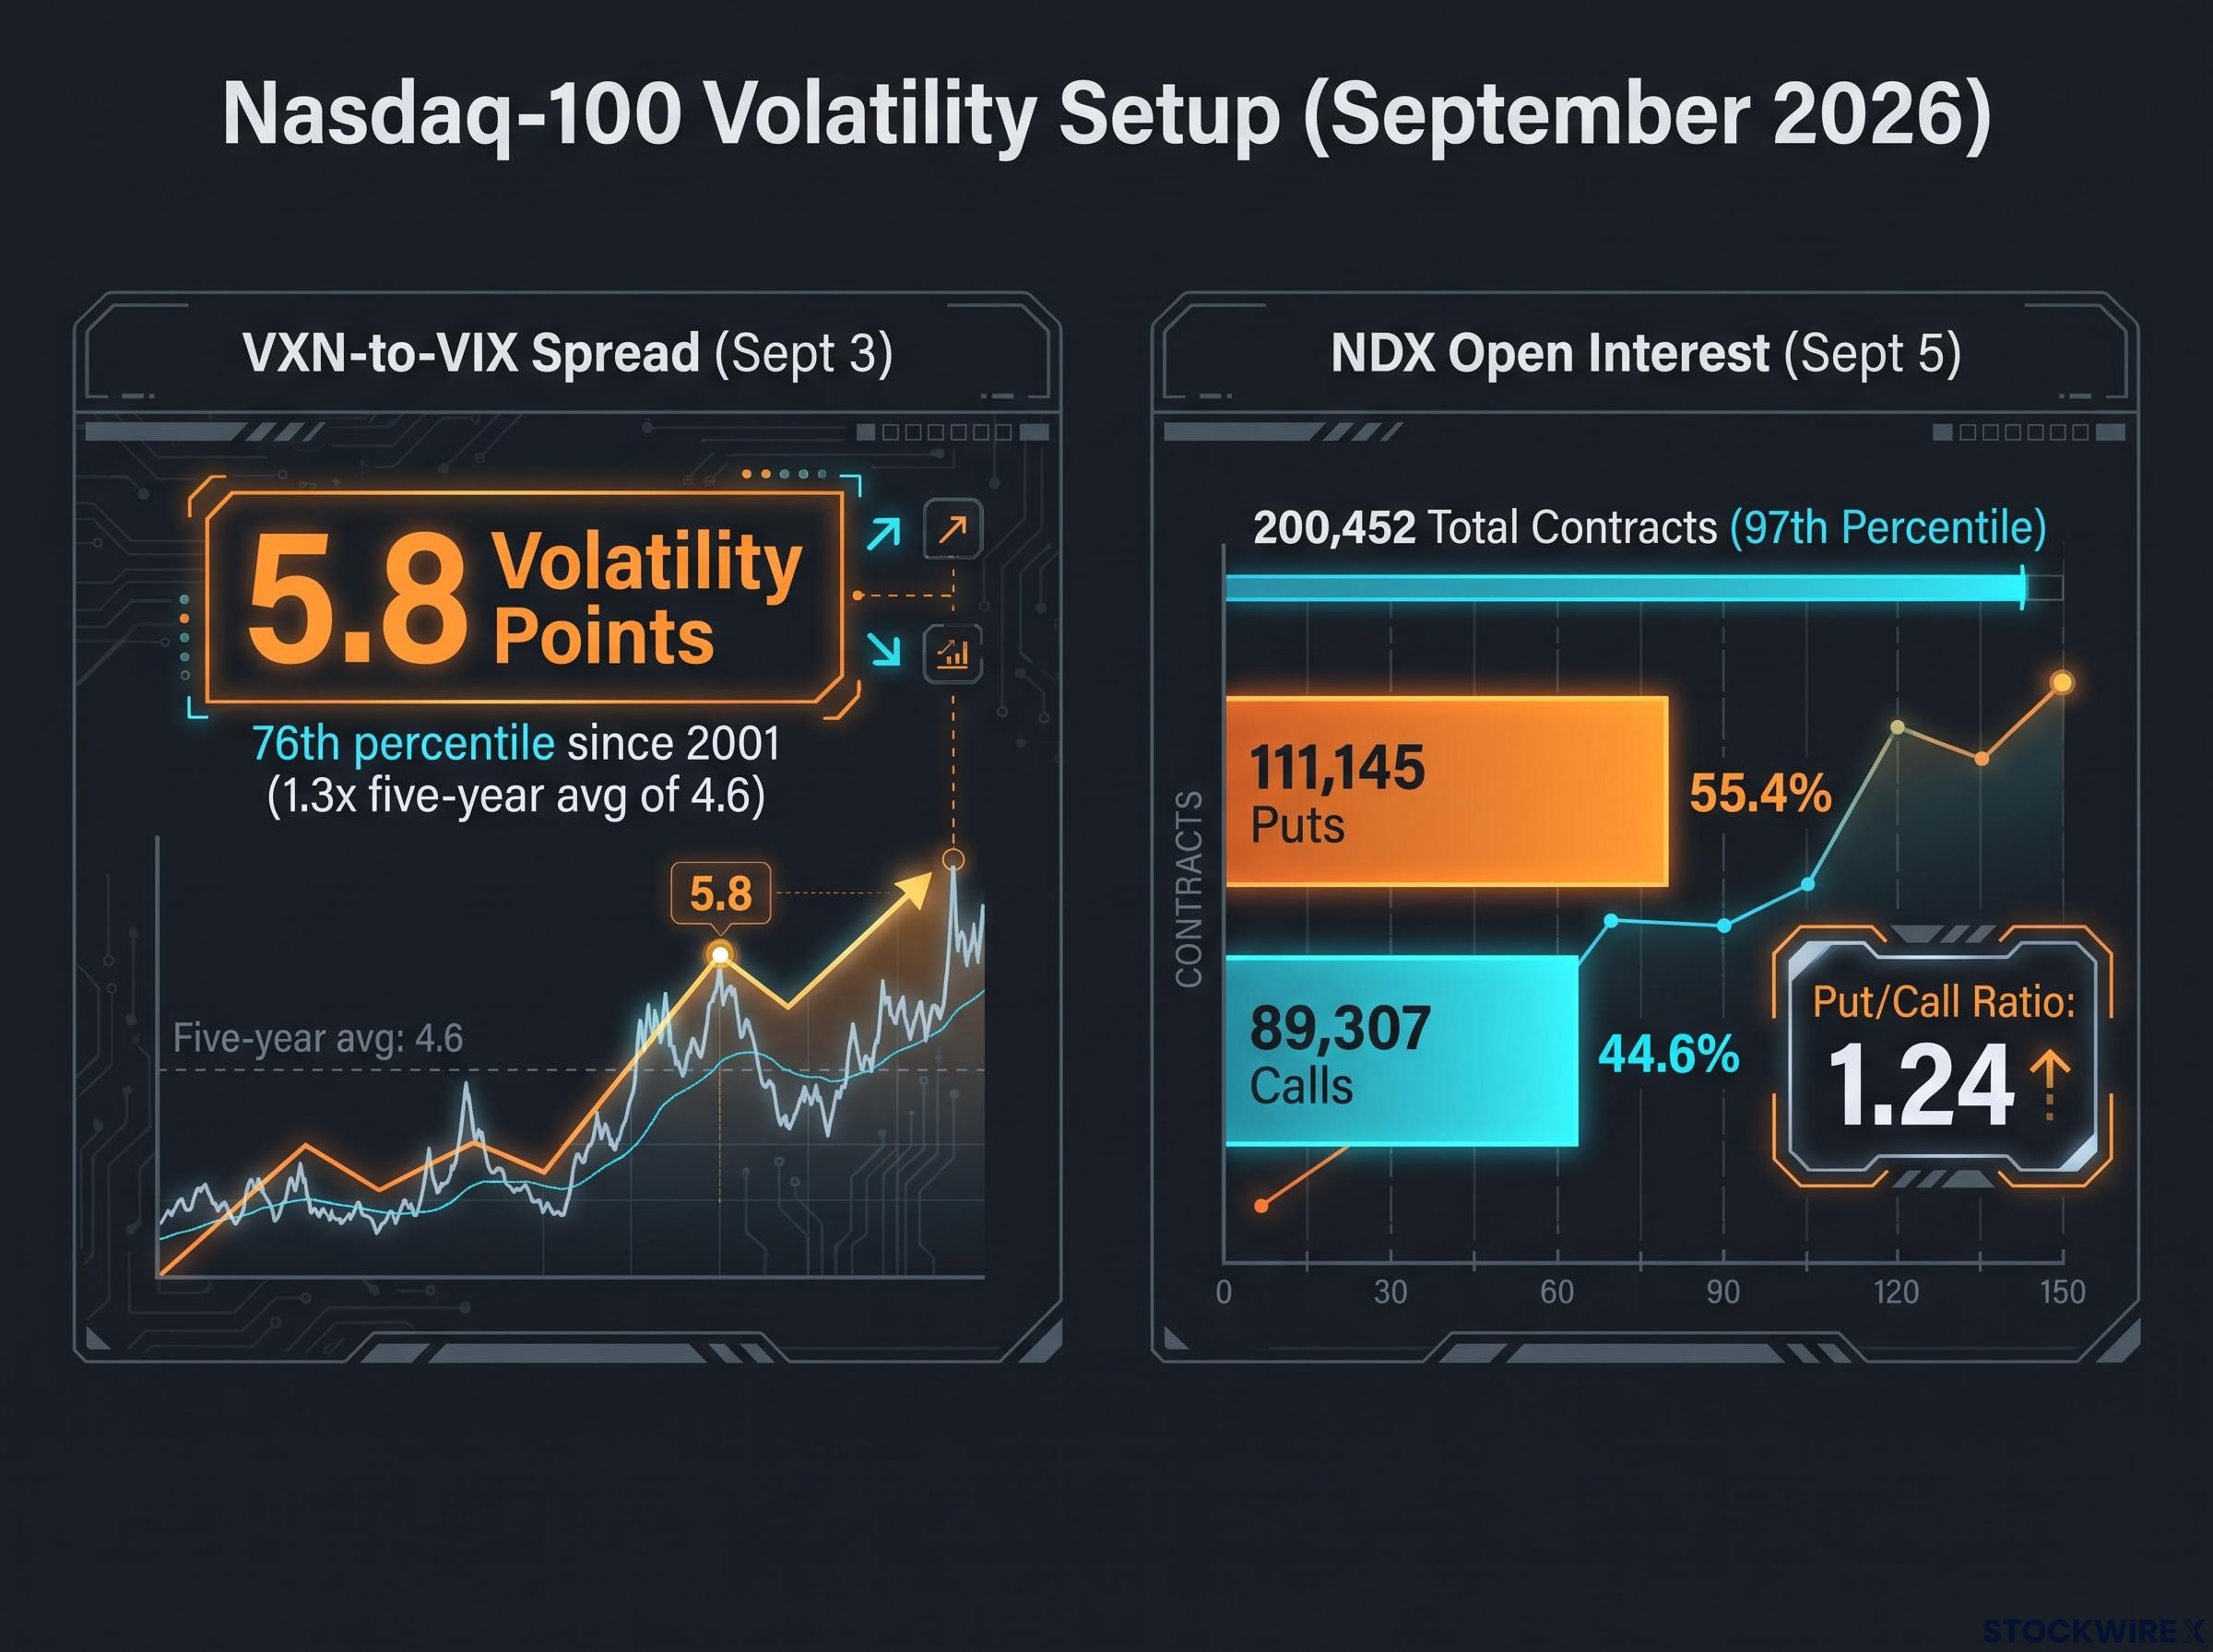
VXN-to-VIX spread As of the 3 September 2026 close, the gap between Nasdaq-100 implied volatility (VXN) and S&P 500 implied volatility (VIX) stood at 5.8 volatility points, in the 76th percentile of observations since 2001 and roughly 1.3 times the five-year average of 4.6 points. Source: TheTrading.tools “Tech Volatility Spread” commentary, using Cboe data via FRED.
That elevated spread, combined with the open interest picture, is the read that matters. As of 5 September 2026, MarketChameleon put total NDX open interest at 200,452 contracts in the 97th percentile of the past year, split 111,145 puts against 89,307 calls. A put-heavy skew like that tells you Nasdaq-100 implied volatility is carrying a relatively rich insurance premium right now, which is precisely the environment where structured premium sellers have historically held an edge.
How traders pair short single-stock volatility with long index options
Framework in hand, here is what the paired trade looks like when it comes together.
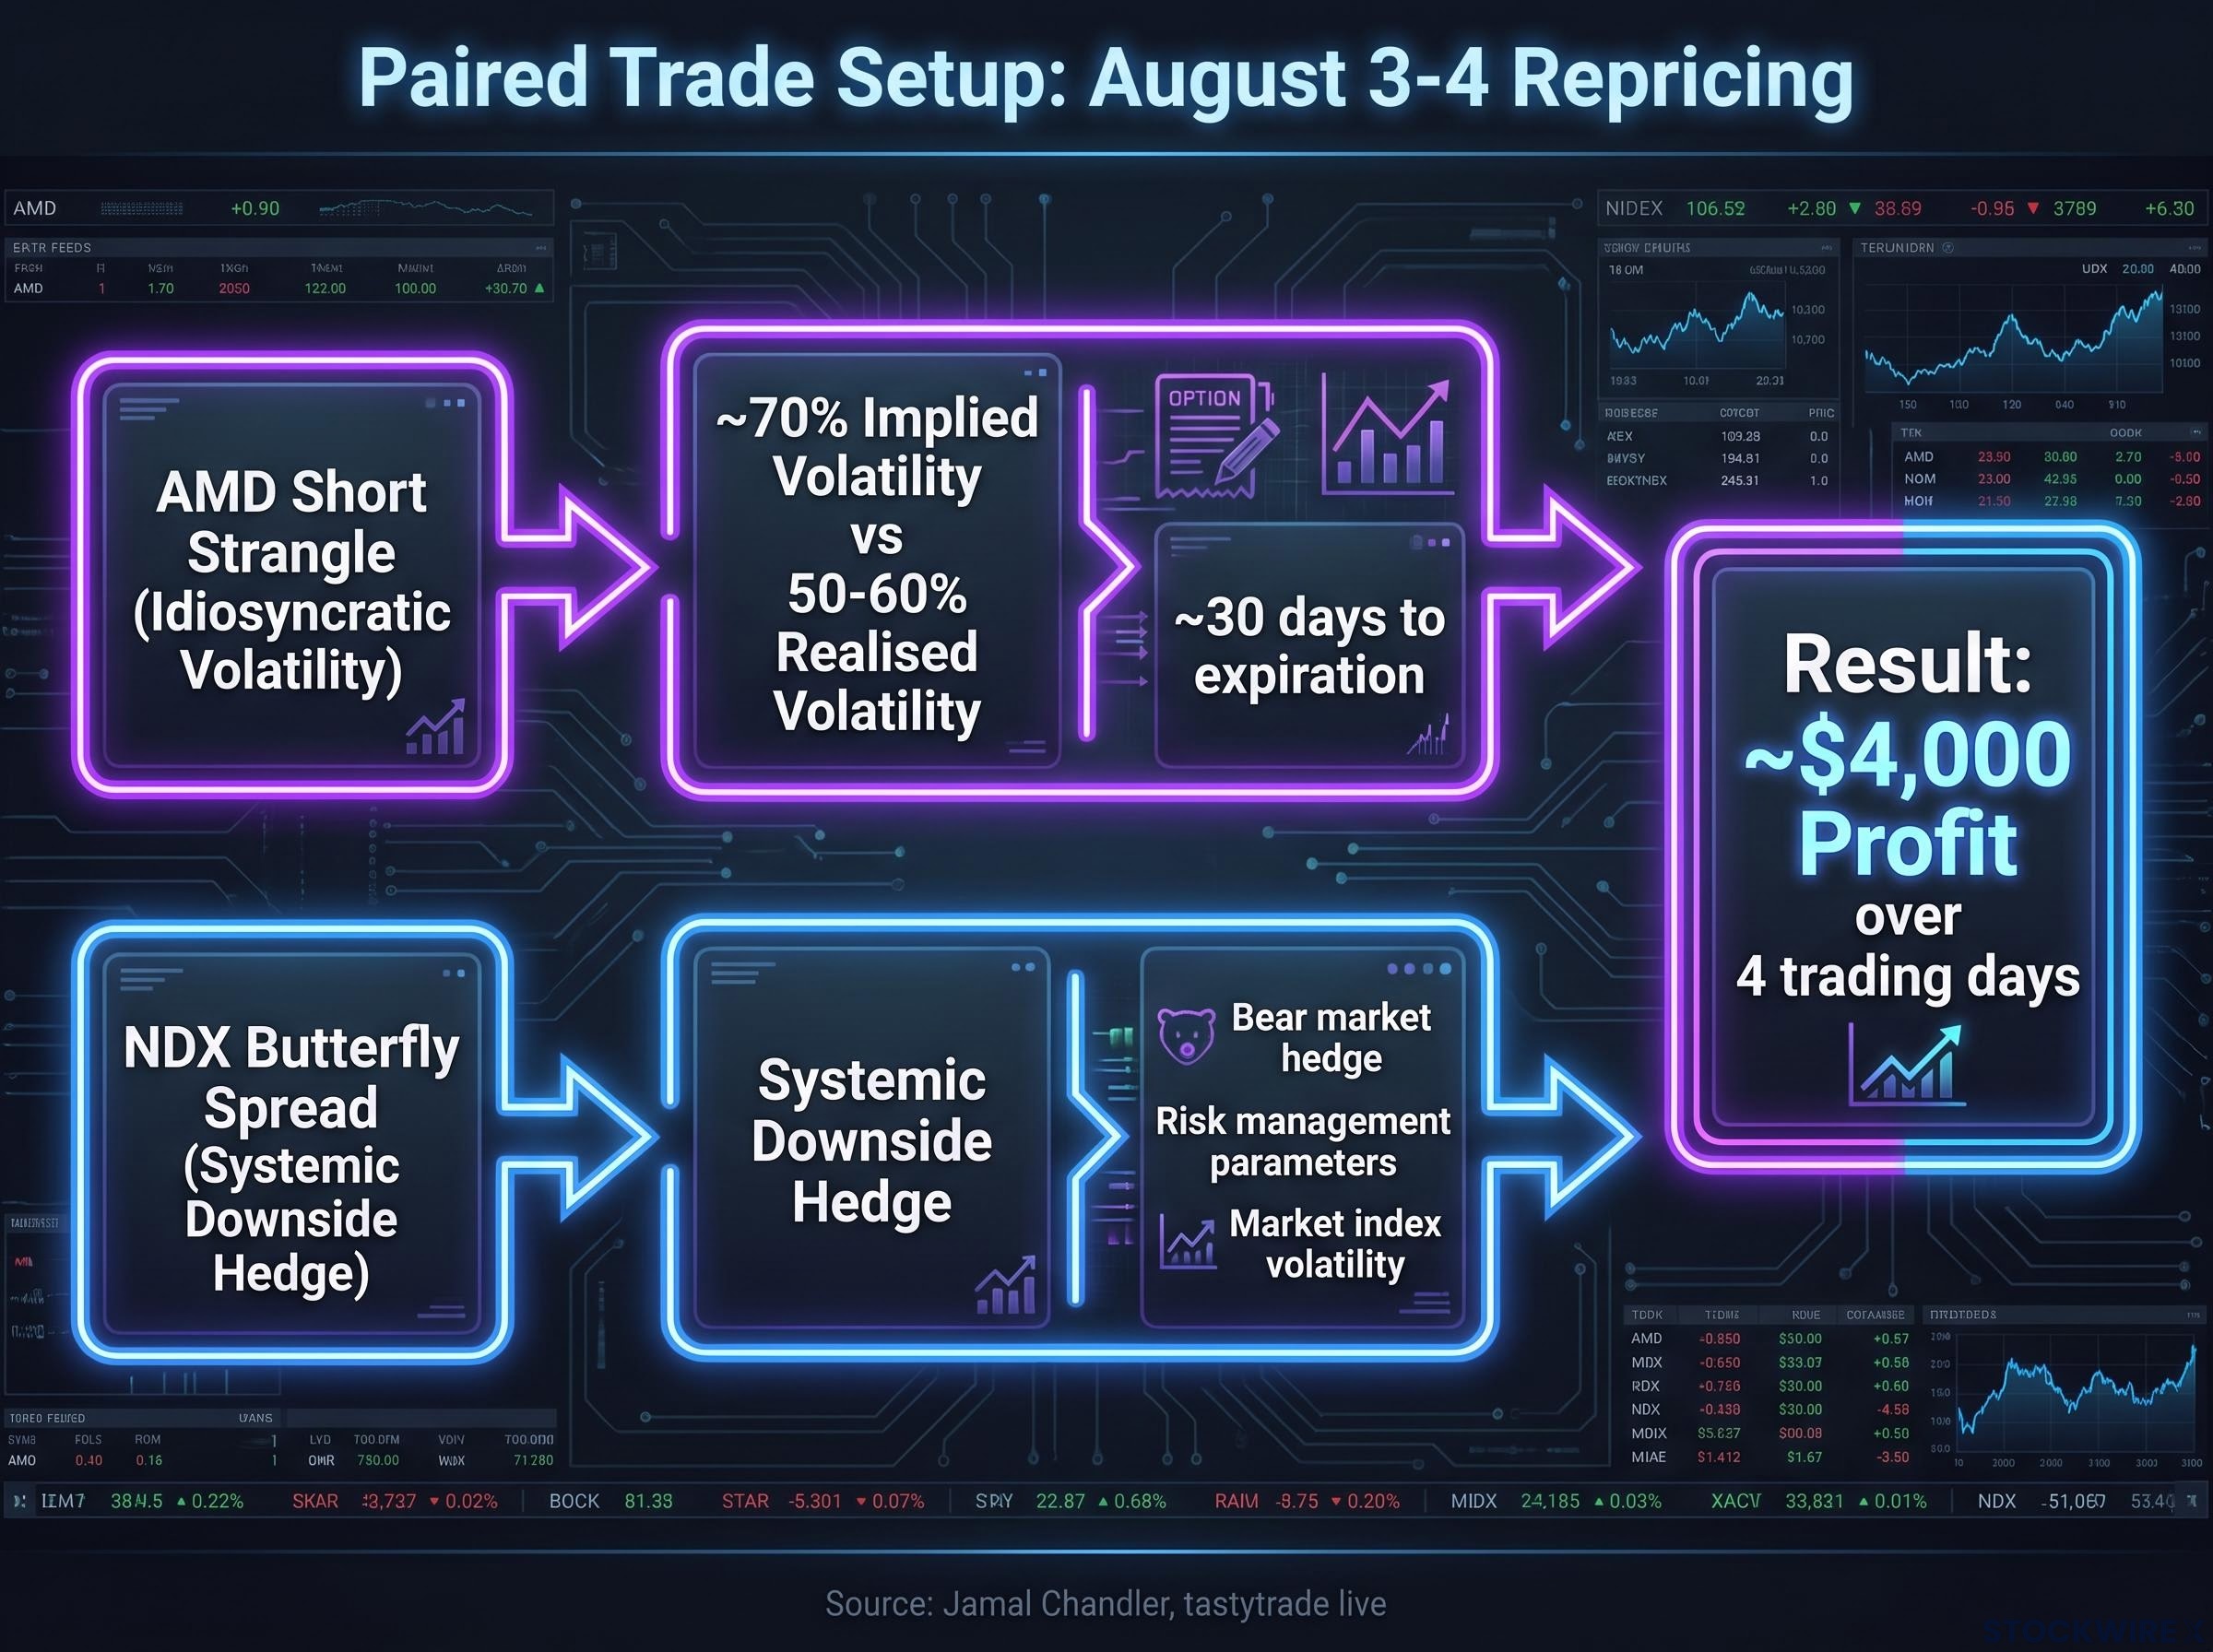
The example from the tastytrade broadcast involved a short strangle on Advanced Micro Devices (AMD) held alongside a downside hedge built as an NDX butterfly spread. Around the August 3-4 repricing, AMD implied volatility in the September options cycle reached roughly 70% with about 30 days to expiration, while prior cycles had realised only 50-60%. That gap, single-stock implied volatility pricing moves 10-20 points above what the stock had actually been delivering, was the dislocation the trade was built to capture.
The AMD volatility gap AMD September options priced approximately 70% implied volatility with around 30 days remaining, against a prior-cycle realised volatility benchmark of 50-60%. Source: Jamal Chandler, tastytrade live.
According to Jamal Chandler, who described the trade from his personal account, the combined position produced approximately $4,000 in profit over four trading days following the earnings period. The short AMD strangle harvested the idiosyncratic volatility premium; the NDX butterfly stood ready to cushion a broad market decline.
The dispersion logic behind the pairing
What makes this rational rather than a bet stacked on a bet is the dispersion framework beneath it. This is structurally different from simply buying index protection on top of a directional stock trade.
Dispersion trading sells idiosyncratic volatility in a single name while holding long index volatility to cover systemic moves. The academic basis, documented in sell-side research from BNP Paribas and Societe Generale and in Cboe educational material, is that an index’s variance reflects both the volatility of its constituents and the correlations between them. Selling single-stock volatility while holding index volatility takes a simultaneous view on both dimensions at once.
Dispersion trading sells idiosyncratic volatility in a single name while holding long index volatility to cover systemic moves, and the academic case for this approach has been reinforced by the extreme dispersion readings of 2026, with April and May ranking as the second and third highest monthly dispersion events in 30 years of MSCI ACWI data.
The index you choose has to fit the stock you are hedging. NDX works for a semiconductor name like AMD because of its heavy weighting toward large-cap technology. Reach for a mismatched index and you introduce basis risk that can leave the hedge doing nothing when you need it.
The construction follows a clear sequence:
- Identify the single-stock implied-versus-realised dislocation.
- Size the short strangle to that specific volatility gap.
- Select the index product that aligns with the stock’s sector exposure.
- Build the index hedge relative to the notional exposure of the short strangle.
The point of all this is that the pairing lets you monetise single-stock volatility premium without carrying unhedged systemic risk. That is the gap a standalone short-premium position on a single name leaves wide open, and it is the gap that turned the opening scenario into a scramble.
Where the structure breaks down: basis risk, tail events, and operational demands
Now the harder question. When does this approach fail, and when does that make it wrong for you?
Basis risk sits at the top of the list. NDX hedges a diversified basket, not your individual stock. A sharp idiosyncratic move, an earnings miss, a regulatory shock, a piece of company-specific news, may produce no corresponding move in the index. That leaves you exposed exactly when you believed you were covered, which is the scenario the hedge was supposed to protect against.
Then there is regime risk. The whole approach assumes volatility mean-reverts quickly. In genuine dislocations such as 2008 and March 2020, implied volatility stayed structurally elevated for extended stretches instead. Short-volatility positions built on the assumption of a fast snap-back have suffered large drawdowns and, in some cases, complete blow-ups in those environments.
The collapse of the short-volatility ETP known as XIV in 2018 is the documented warning. As more participants crowded into the same short-volatility trade, the strategy compressed and then failed catastrophically when liquidity evaporated.
For readers wanting to understand why volatility instruments behave differently from their spot readings before building positions around them, our full explainer on VIX futures structure walks through the contango mechanics, the Special Opening Quotation settlement process, and the roll costs that erode long-volatility ETP returns over time.
The five structural risk categories worth holding in view:
- Basis and composition risk between the index and the single stock.
- Regime-shift tail events where volatility stays elevated for months.
- Correlation breakdown in stress scenarios that undermines the hedge.
- 0DTE concentration and heightened intraday sensitivity.
- Operational complexity and continuous margin monitoring.
That fourth point deserves its own figure.
0DTE concentration In Q4 2024, zero-day-to-expiry SPX options averaged more than 1.5 million contracts per day and accounted for 51% of total SPX options volume, the first quarter in which daily-expiry contracts surpassed all other expirations combined.
For a trader running short-dated hedges, that concentration amplifies intraday sensitivity and makes precise timing far more demanding.
Operational and regulatory requirements before you trade
The operational bar is real. Multi-leg structures that combine single-stock strangles with index hedges require you to monitor delta, vega, correlation, margin, and P&L across different instruments and expirations at the same time. Most retail traders lack the infrastructure to do this robustly.
Regulation adds another layer. Implementing multi-leg structures typically requires higher options approval levels (Level 3 or 4 spreads), and traders face suitability requirements before they can trade complex products at all.
Section 1256 mark-to-market accounting, the same rule that delivers the tax advantage, also demands annual marking that complicates planning. Misreading the difference between index and ETF option tax treatment produces unwelcome surprises at tax time.
Liquidity is the final constraint. NDX front-month, at-the-money strikes are the most liquid; move away from them and bid-ask spreads widen and slippage climbs, which can materially reduce or negate the benefit of the hedge in the first place. For traders without institutional risk-management tools, these failure modes decide whether this approach belongs in your toolkit at all.
Deciding whether this approach fits your current setup
Strip away the mechanics and the decision comes down to three honest questions about your own situation.
- Infrastructure: Do you hold the options approval level and the margin system capability to monitor a multi-leg, multi-instrument position under stress?
- Alignment: Is your single-stock exposure in a name with strong index alignment on sector and weighting, or would the hedge carry meaningful basis risk?
- Pricing: Does the current implied-versus-realised spread actually justify the transaction costs and complexity of the paired structure?
The structural advantages are durable, but they amplify good trade selection rather than replacing it. A well-built hedge in a mispriced volatility environment outperforms the same structure applied indiscriminately.
| Structural Feature | Advantage Offered | Condition Required |
|---|---|---|
| Cash settlement | No early assignment or share delivery | Comfort with European-style resolution |
| Section 1256 tax treatment | 60% long-term / 40% short-term split | Understanding of mark-to-market accounting |
| Portfolio margin netting | Lower requirement via correlation recognition | Portfolio margin approval and infrastructure |
| Index alignment | Effective systemic hedge for the position | Sector and weighting match to the stock |
The conditions that made the late July through August 2026 window instructive, an elevated VXN relative to VIX, post-selloff implied volatility richness, and a technology earnings catalyst, are not unique to that period. As of 5 September 2026, NDX open interest still showed 111,145 puts to 89,307 calls, a ratio near 1.24 and a sign of persistent downside-protection demand that can keep the volatility risk premium wide for sellers. Learn to spot the pattern and you are ready for its next iteration.
The 1.24 put-to-call ratio in NDX open interest reflects the same persistent downside protection demand that December SPX put pricing has been signalling for months, with December contracts trading at a $2,600 premium over equivalent calls as institutional hedgers price an elevated-volatility regime through the September-November window.
This article is for informational purposes only and should not be considered financial advice. Investors should conduct their own research and consult with financial professionals before making investment decisions. Past performance does not guarantee future results, and these strategies carry meaningful risk of large and rapid losses in stress scenarios.