
The Japanese yen is the currency of the world’s fourth-largest economy, yet it spends most of its time behaving as though Japan is secondary to its own story. It strengthens when global markets collapse. It weakens when a central bank on the other side of the Pacific raises rates. It serves as the funding currency for speculative trades that have nothing to do with Japanese companies, Japanese consumers, or Japanese exports. The gap between what the yen represents and what actually moves it is where the confusion starts.
That confusion is understandable. The yen responds to forces well beyond Japan’s borders, it carries a safe-haven label that seems to contradict its decade-long weakness, and its trajectory from 2013 through 2024 was shaped almost entirely by deliberate policy choices in Tokyo that most currency watchers never fully unpacked. If you follow markets regularly, you have encountered yen moves that seemed to come from nowhere, because the model for understanding them was incomplete.
Here is the framework that fills the gap. After reading this, you will have a structured mental model built around four identifiable forces, each operating on a different time horizon, that you can apply every time a yen move surfaces in your market reading. The goal is not to summarise what drives the yen; it is to equip you with an analytical lens you can use in real time.
Why the yen moves the way it does: four forces, three time horizons
Professional foreign exchange desks organise yen analysis around four primary drivers: Bank of Japan (BoJ) monetary policy, yield differentials between Japan and the rest of the world, safe-haven capital flows, and Japan’s domestic fundamentals. These are not four random influences. They form a coherent taxonomy, and each one operates on a distinct time horizon.
Japan’s nominal GDP sits at approximately $4.38 trillion as of 2026, making it the world’s fourth-largest economy behind the United States, China, and Germany. The yen is one of the most actively traded currencies in global FX markets. Yet size alone does not explain why the yen moves the way it does. What matters is which of the four drivers is dominant at any given moment, and recognising that is the practical skill this guide builds toward.
The taxonomy matters because it prevents the most common analytical mistake: attributing every yen move to a single cause. A sharp yen rally during a global equity sell-off is a different animal from gradual yen weakness driven by widening yield spreads. If you are using the same explanation for both, you are misreading at least one of them.
| Driver | Time Horizon | Mechanism | Observable Signal |
|---|---|---|---|
| BoJ monetary policy | Short-term | Rate decisions and forward guidance shift market expectations | BoJ meeting outcomes, policy statements |
| Yield differentials | Medium-term | Gap between US and Japanese bond yields drives capital allocation | US-Japan 10-year yield spread trajectory |
| Safe-haven flows | Short-term | Risk-off episodes trigger capital repatriation and carry-trade unwinds | Equity volatility spikes, credit spread widening |
| Domestic fundamentals | Long-term | Current account position and net creditor status provide structural floor | Japanese Ministry of Finance NIIP data, current account releases |
Matching the driver to the time horizon
The three-tier model works like this. Short-term moves, the ones that show up in a single trading session or week, are typically driven by BoJ meeting outcomes or sudden risk-off episodes that trigger safe-haven flows. Medium-term trends, the ones that play out over quarters, are shaped by the trajectory of yield spreads between Japan and other major economies, particularly the United States. Long-term structural forces, the ones that take years to shift, are anchored in Japan’s current account balance and its status as one of the world’s largest net creditor nations.
Japan’s current account surplus hit a record 17.43 trillion yen in the first half of 2026, yet the yen remained above 159 per US dollar because energy import dependence, the BoJ’s credibility gap on tightening, and foreign equity hedging flows were simultaneously working against the structural support that surplus data would normally imply.
When you see a yen move in the headlines, the first question to ask is: which time horizon is this? That single question tells you which driver to look at, and which ones to ignore.
When big ASX news breaks, our subscribers know first
The Bank of Japan’s decade of ultra-loose policy and what it did to the yen
From 2013 through 2024, the BoJ ran one of the most aggressive monetary policy experiments in modern central banking history. The programme was not accidental. It was a deliberate institutional choice, reflecting the BoJ’s mandate and its ambition to lift Japan out of decades of deflation by hitting a sustained 2% inflation target.
The ultra-loose framework rested on three core tools:
- Negative interest rates: The BoJ pushed its short-term policy rate to -0.1%, meaning banks were effectively charged for holding reserves, a mechanism designed to force capital into lending and investment rather than sitting idle.
- Yield Curve Control (YCC): The BoJ targeted 10-year Japanese Government Bond (JGB) yields at approximately 0%, actively buying government bonds to prevent yields from rising above its implicit ceiling. This kept long-term borrowing costs artificially suppressed across the Japanese economy.
- Asset purchases: The BoJ purchased exchange-traded funds (ETFs) and Japanese real estate investment trusts (J-REITs), directly intervening in equity and property markets to support asset prices and inflation expectations.
The BoJ targeted 10-year JGB yields at approximately 0%, actively buying government bonds to prevent yields from rising above its implicit ceiling.
The consequence for the yen was straightforward. While the BoJ held Japanese yields at or below zero, the US Federal Reserve and other major central banks raised rates. The resulting yield differential, the gap between what investors could earn holding Japanese bonds versus US bonds, widened steadily. Capital flowed toward the higher yields available outside Japan, and the yen weakened almost continuously as a result.
If you held Japanese assets or tracked USD/JPY during this period, BoJ policy was the single most important variable determining the yen’s direction. It explains why the yen behaved so differently from other major currency peers, and it provides the baseline against which the 2024 policy shift becomes genuinely significant.
The safe-haven puzzle: why the yen strengthens when markets fall apart
Here is the part that trips people up. Japan is not immune to global economic downturns. Its own equity market sells off during crises. Its own exporters suffer when global demand contracts. Yet the yen strengthens during precisely those moments when you might expect it to weaken.
The pattern is consistent. During pandemic-related shocks and geopolitical flare-ups, yen strength has coincided with global equity sell-offs. The explanation is not sentiment or reputation. It is structural, and it runs through two concrete mechanical channels.
The first is the carry-trade unwind. Here is how it works:
- An investor borrows in yen at Japan’s ultra-low interest rates, obtaining cheap funding.
- That capital is converted out of yen and invested in higher-yielding assets denominated in other currencies, such as US Treasuries or emerging market bonds.
- Global market stress hits, risk appetite collapses, and the higher-yielding positions start losing value.
- The investor unwinds the position, selling the foreign assets and converting the proceeds back into yen.
- The surge in yen demand from these unwinds pushes the currency higher.
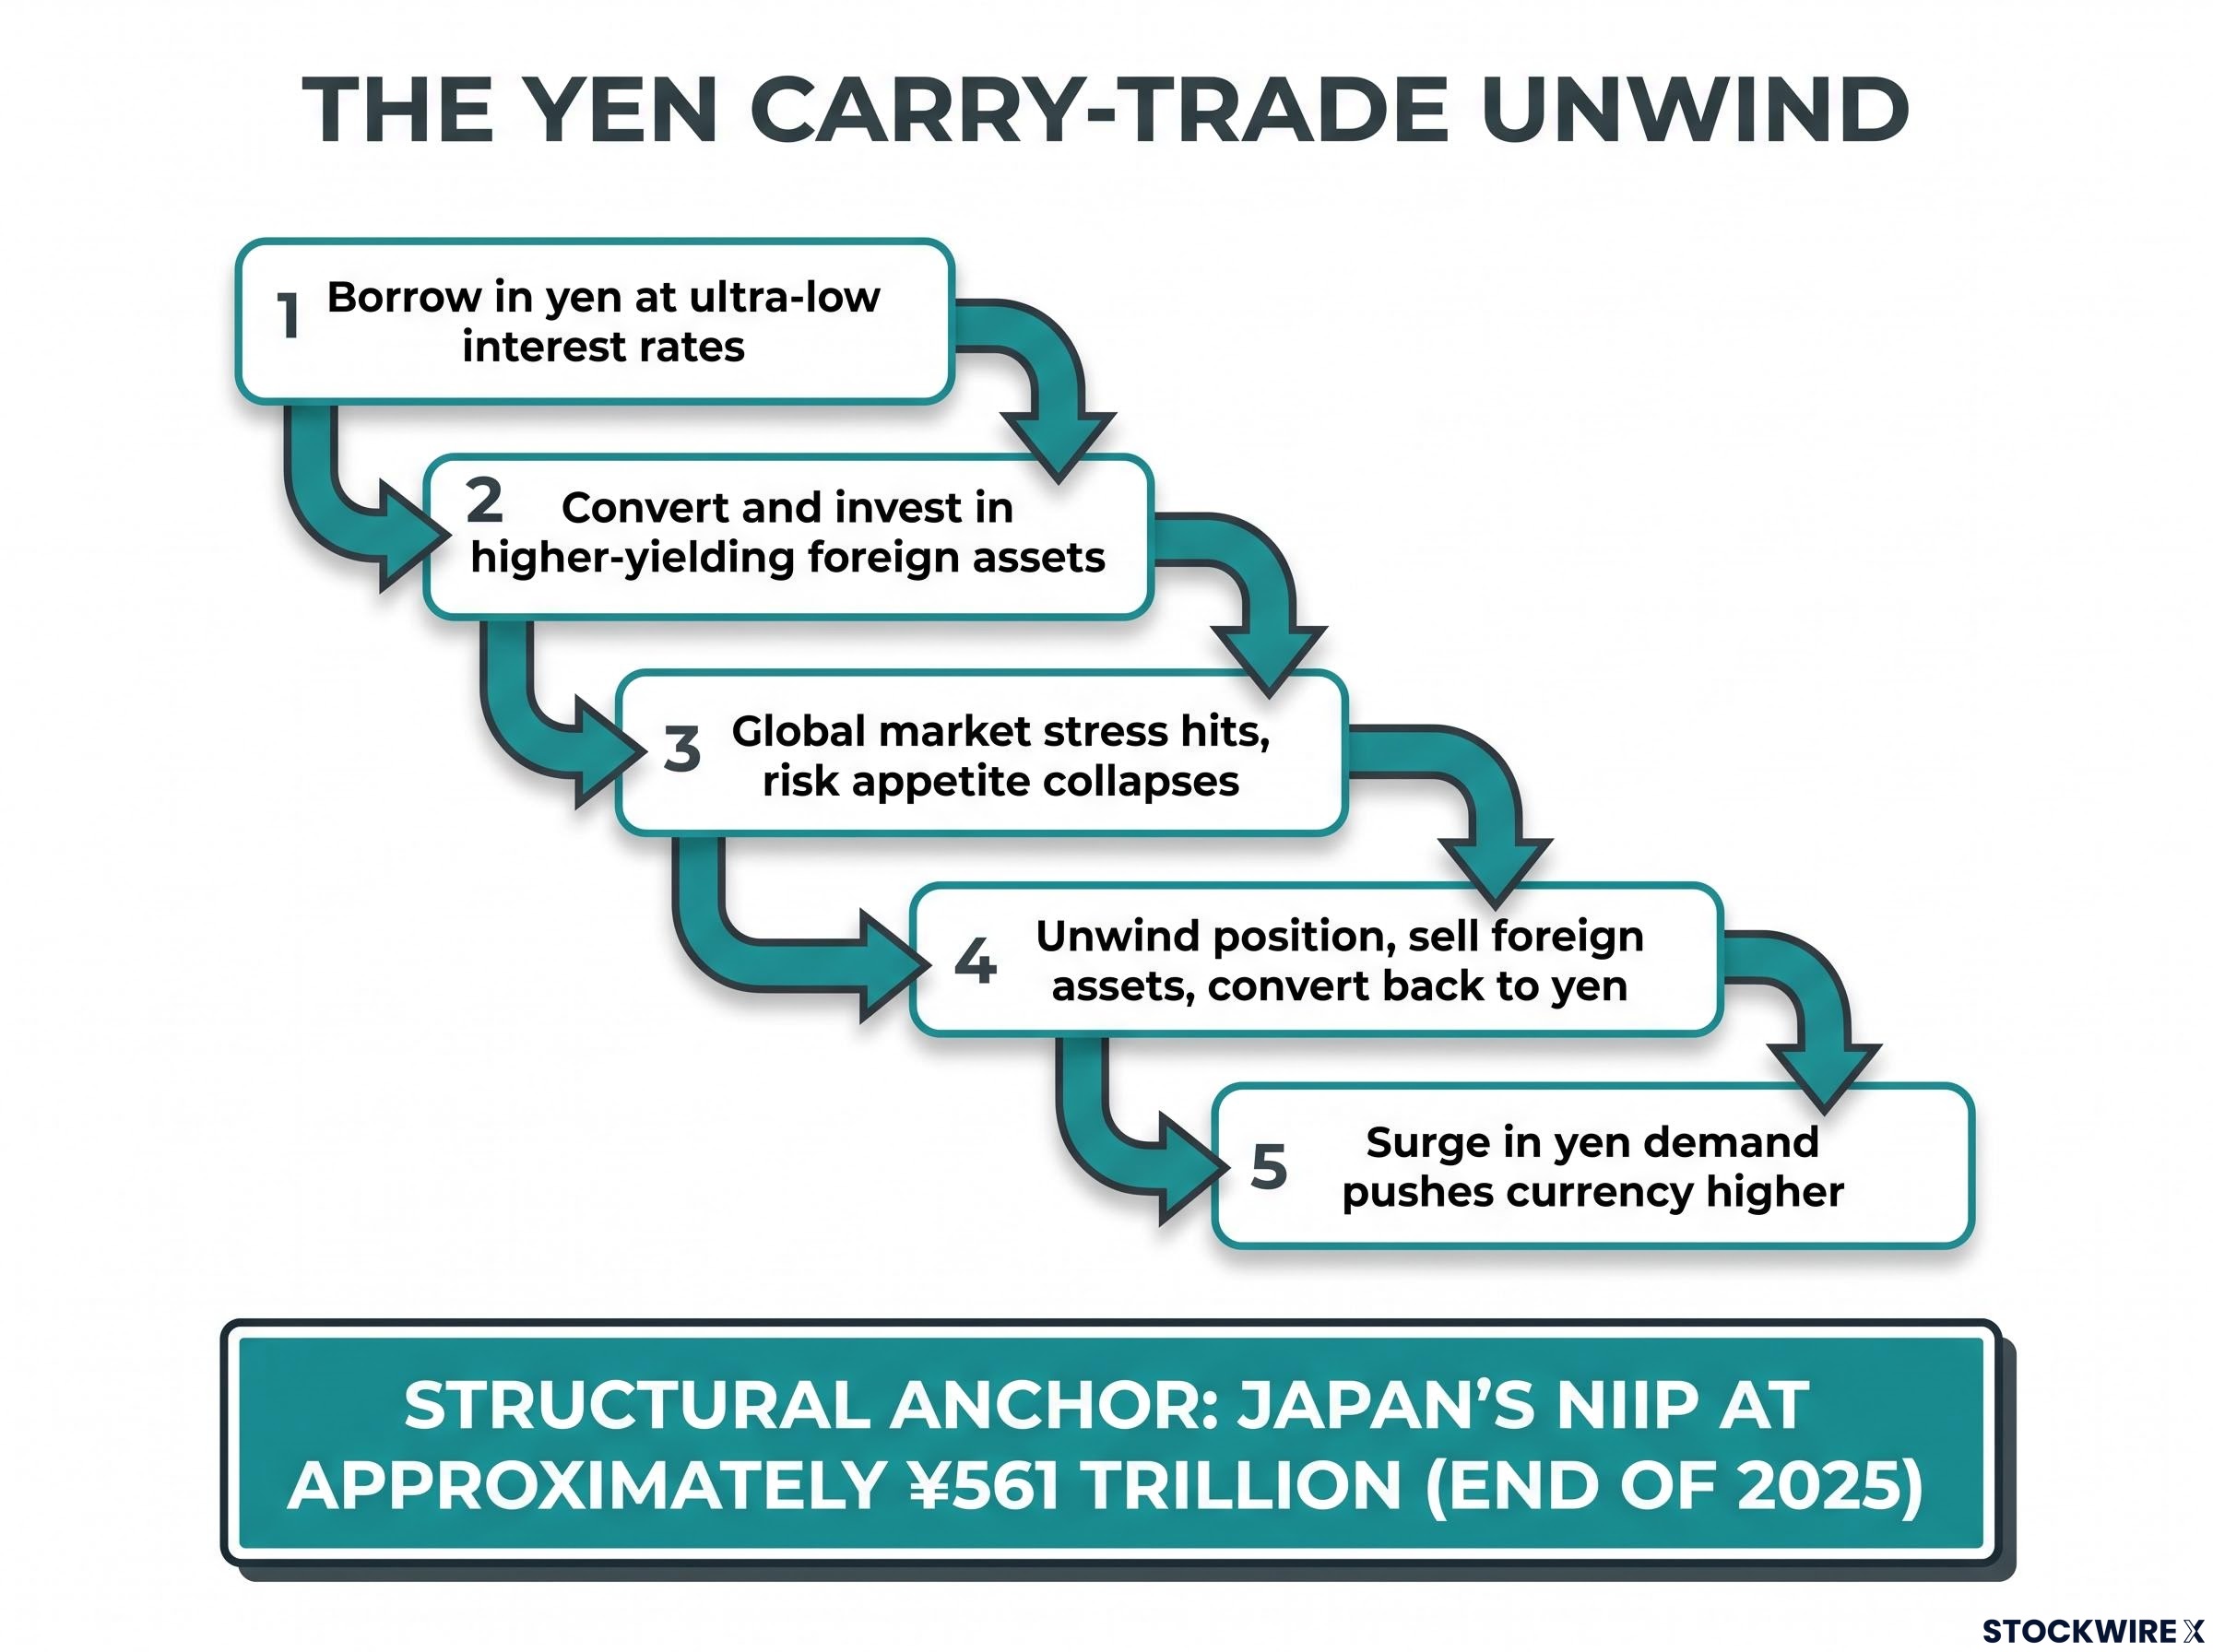
A carry trade is any strategy where you borrow in a low-interest-rate currency and invest in a higher-interest-rate currency to capture the difference. When these trades reverse simultaneously across global markets, the buying pressure on the yen is enormous.
A carry trade is any strategy where you borrow in a low-interest-rate currency and invest in a higher-interest-rate currency to capture the difference, and the yen carry trade persists because even at 1.0%, Japan’s policy rate still sits roughly 250-275 basis points below the Federal Reserve’s target range, leaving the spread wide enough to sustain yen-funded positions across global asset classes.
The second channel is capital repatriation. Japanese institutional investors, including pension funds, insurers, and asset managers, hold substantial overseas portfolios. During stress episodes, a portion of that capital flows home, generating yen demand.
Japan’s net creditor position as the structural anchor
Both channels depend on a structural feature that makes Japan different from most major economies: its net international investment position (NIIP). This is the difference between the value of assets Japanese entities own overseas and the value of foreign-owned assets in Japan.
At the end of 2025, Japan’s NIIP stood at approximately ¥561 trillion, according to Japanese Ministry of Finance data. Japan is one of the world’s largest net creditor nations. That scale matters because it means the pool of overseas assets available to flow home during stress episodes is exceptionally large.
Once you understand this mechanism, sharp yen appreciation during equity sell-offs stops looking irrational. It is the predictable result of specific financial plumbing that activates whenever risk appetite collapses globally. For your portfolio, this means yen exposure can act as a partial natural hedge during drawdown episodes, a dynamic worth factoring into how you think about currency positioning during volatile stretches.
The 2024 pivot and the yield differential that now defines the yen’s trajectory
On 19 March 2024, the BoJ enacted its most consequential policy shift in decades. The decision ended the era described in the previous section, and it changed the analytical equation for anyone tracking the yen’s medium-term direction.
The BoJ raised its short-term policy rate from -0.1% to a range of 0%-0.1%, the first rate hike since 2007 and the end of the world’s last negative interest rate regime.
The full scope of the March 2024 decision went well beyond the rate move:
The BoJ March 2024 Monetary Policy Meeting minutes confirm the formal termination of negative interest rate policy and the abolishment of Yield Curve Control, documenting the exact decision language the market had been anticipating for months before the announcement.
| Policy Tool | Pre-March 2024 Status | Post-March 2024 Status |
|---|---|---|
| Short-term policy rate | -0.1% (negative rates) | 0%-0.1% (first hike since 2007) |
| Yield Curve Control | Active, targeting 10-year JGB yields around 0% | Formally abolished |
| ETF and J-REIT purchases | Active | Ceased |
| JGB purchases | Approximately ¥6 trillion per month | Continued at approximately ¥6 trillion per month, with commitment to increase if yields rise sharply |
The characterisation matters. The BoJ exited its most unconventional tools, but it did not launch an aggressive tightening cycle. Continued JGB purchases at roughly the same monthly pace signal that the overall stance remains accommodative. This is a directional shift, not a sharp reversal.
The implication for the yen sits in the yield differential. The combination of BoJ rate increases and rate reductions at other major central banks, particularly the US Federal Reserve, has begun compressing the spread that drove prolonged yen weakness during the 2013-2024 period. That spread was the primary structural force behind over a decade of yen depreciation. Its narrowing provides gradual support for yen recovery, even if the pace remains constrained by the BoJ’s careful approach.
BoJ normalisation has advanced in stages since the March 2024 pivot: the June 2026 decision lifted the overnight call rate to 1.0%, a 31-year high, while simultaneously announcing a structured JGB tapering schedule that reduces monthly purchases by approximately 200 billion yen per quarter through March 2027.
For anyone tracking USD/JPY, this is the shift that reframes your analytical priorities. The question is no longer whether the yield differential narrows. It is how fast. That makes the relative pace of BoJ normalisation versus other central bank policy paths the most important variable for your medium-term yen positioning.
This article is for informational purposes only and should not be considered financial advice. Investors should conduct their own research and consult with financial professionals before making investment decisions.
These statements are speculative and subject to change based on market developments and company performance. Past performance does not guarantee future results.
Reading yen moves in practice: what to watch and why it matters now
The four-driver framework from the opening section gives you the analytical structure. The question now is: what do you actually monitor, and where do you find it?
The post-2024 environment is transitional. During the 2013-2024 period, BoJ policy was effectively static; there was little reason to watch for shifts that never came. That has changed. BoJ communication now carries more weight for near-term yen moves than at any point in the past decade, precisely because the direction of policy is no longer locked at zero.
Here is your practical monitoring checklist, one signal per driver:
- BoJ meeting outcomes and rate guidance: The highest-priority near-term signal. BoJ policy announcements are published on the Bank of Japan’s website following each Monetary Policy Meeting. Watch the forward guidance language, not just the rate decision.
BoJ forward guidance carries more weight now than at any point in the past decade: the July 2026 hold at 1.0% came with a named dissenter pressing for an immediate hike to 1.25%, a US Treasury rate check already on record, and government energy subsidies mechanically suppressing near-term CPI, all of which shape the market’s read on the next move’s timing.
- US-Japan 10-year yield spread: The core medium-term indicator. Track the differential between US Treasury and JGB 10-year yields through central bank yield curve data or major financial data providers. The direction and pace of compression tells you where structural yen support stands.
- Risk appetite proxies: The VIX (a measure of expected equity market volatility) and credit spreads serve as early-warning signals for the safe-haven channel. When these spike, carry-trade unwinds and repatriation flows are likely in motion, and yen strength typically follows.
- Japan’s NIIP and current account data: The structural floor. Released by the Japanese Ministry of Finance, these figures shift slowly but anchor the long-run picture. A sustained net creditor position underpins the safe-haven dynamic regardless of short-term policy moves.
The yen’s dual identity, as a risk barometer and a carry-trade funding currency, makes it one of the most informationally rich currencies you can track. It reflects multiple global forces simultaneously, and knowing which indicator to watch at which time horizon turns a confusing currency into a reliable signal.
What the yen’s transition means for how you read currency markets going forward
The four-driver framework you now hold is durable. The specific weights assigned to each driver will shift as the macro environment evolves, but the taxonomy itself remains the correct analytical lens. BoJ policy, yield differentials, safe-haven flows, and domestic fundamentals will continue to drive the yen. What changes is which one matters most at any given moment.
Some things have genuinely changed. The BoJ’s exit from negative rates and the formal abolition of YCC represent a structural inflection point. The yield differential that made yen weakness a near-permanent feature of the 2013-2024 era is narrowing, and the direction of travel is clear.
Some things remain structurally constant. Japan’s net creditor position, approximately ¥561 trillion at the end of 2025, underpins the safe-haven role regardless of short-term policy shifts. The carry-trade dynamic persists as long as Japan’s rates remain below those of other major economies, which they do.
The practical implication is this: if you learned to read the yen during the era of extreme policy divergence, you need to recalibrate. The same framework applies, but the weights across its four drivers are shifting in real time. BoJ communication is now the highest-priority signal for medium-term yen watchers, because the pace of normalisation relative to other central banks is where the directional story sits.
The yen’s behaviour in the coming years will be shaped primarily by the relative pace of BoJ normalisation versus other central bank policy paths, making BoJ forward guidance the single most important input for your medium-term yen reading.
The framework equips you to read that story as it unfolds, not after the fact.