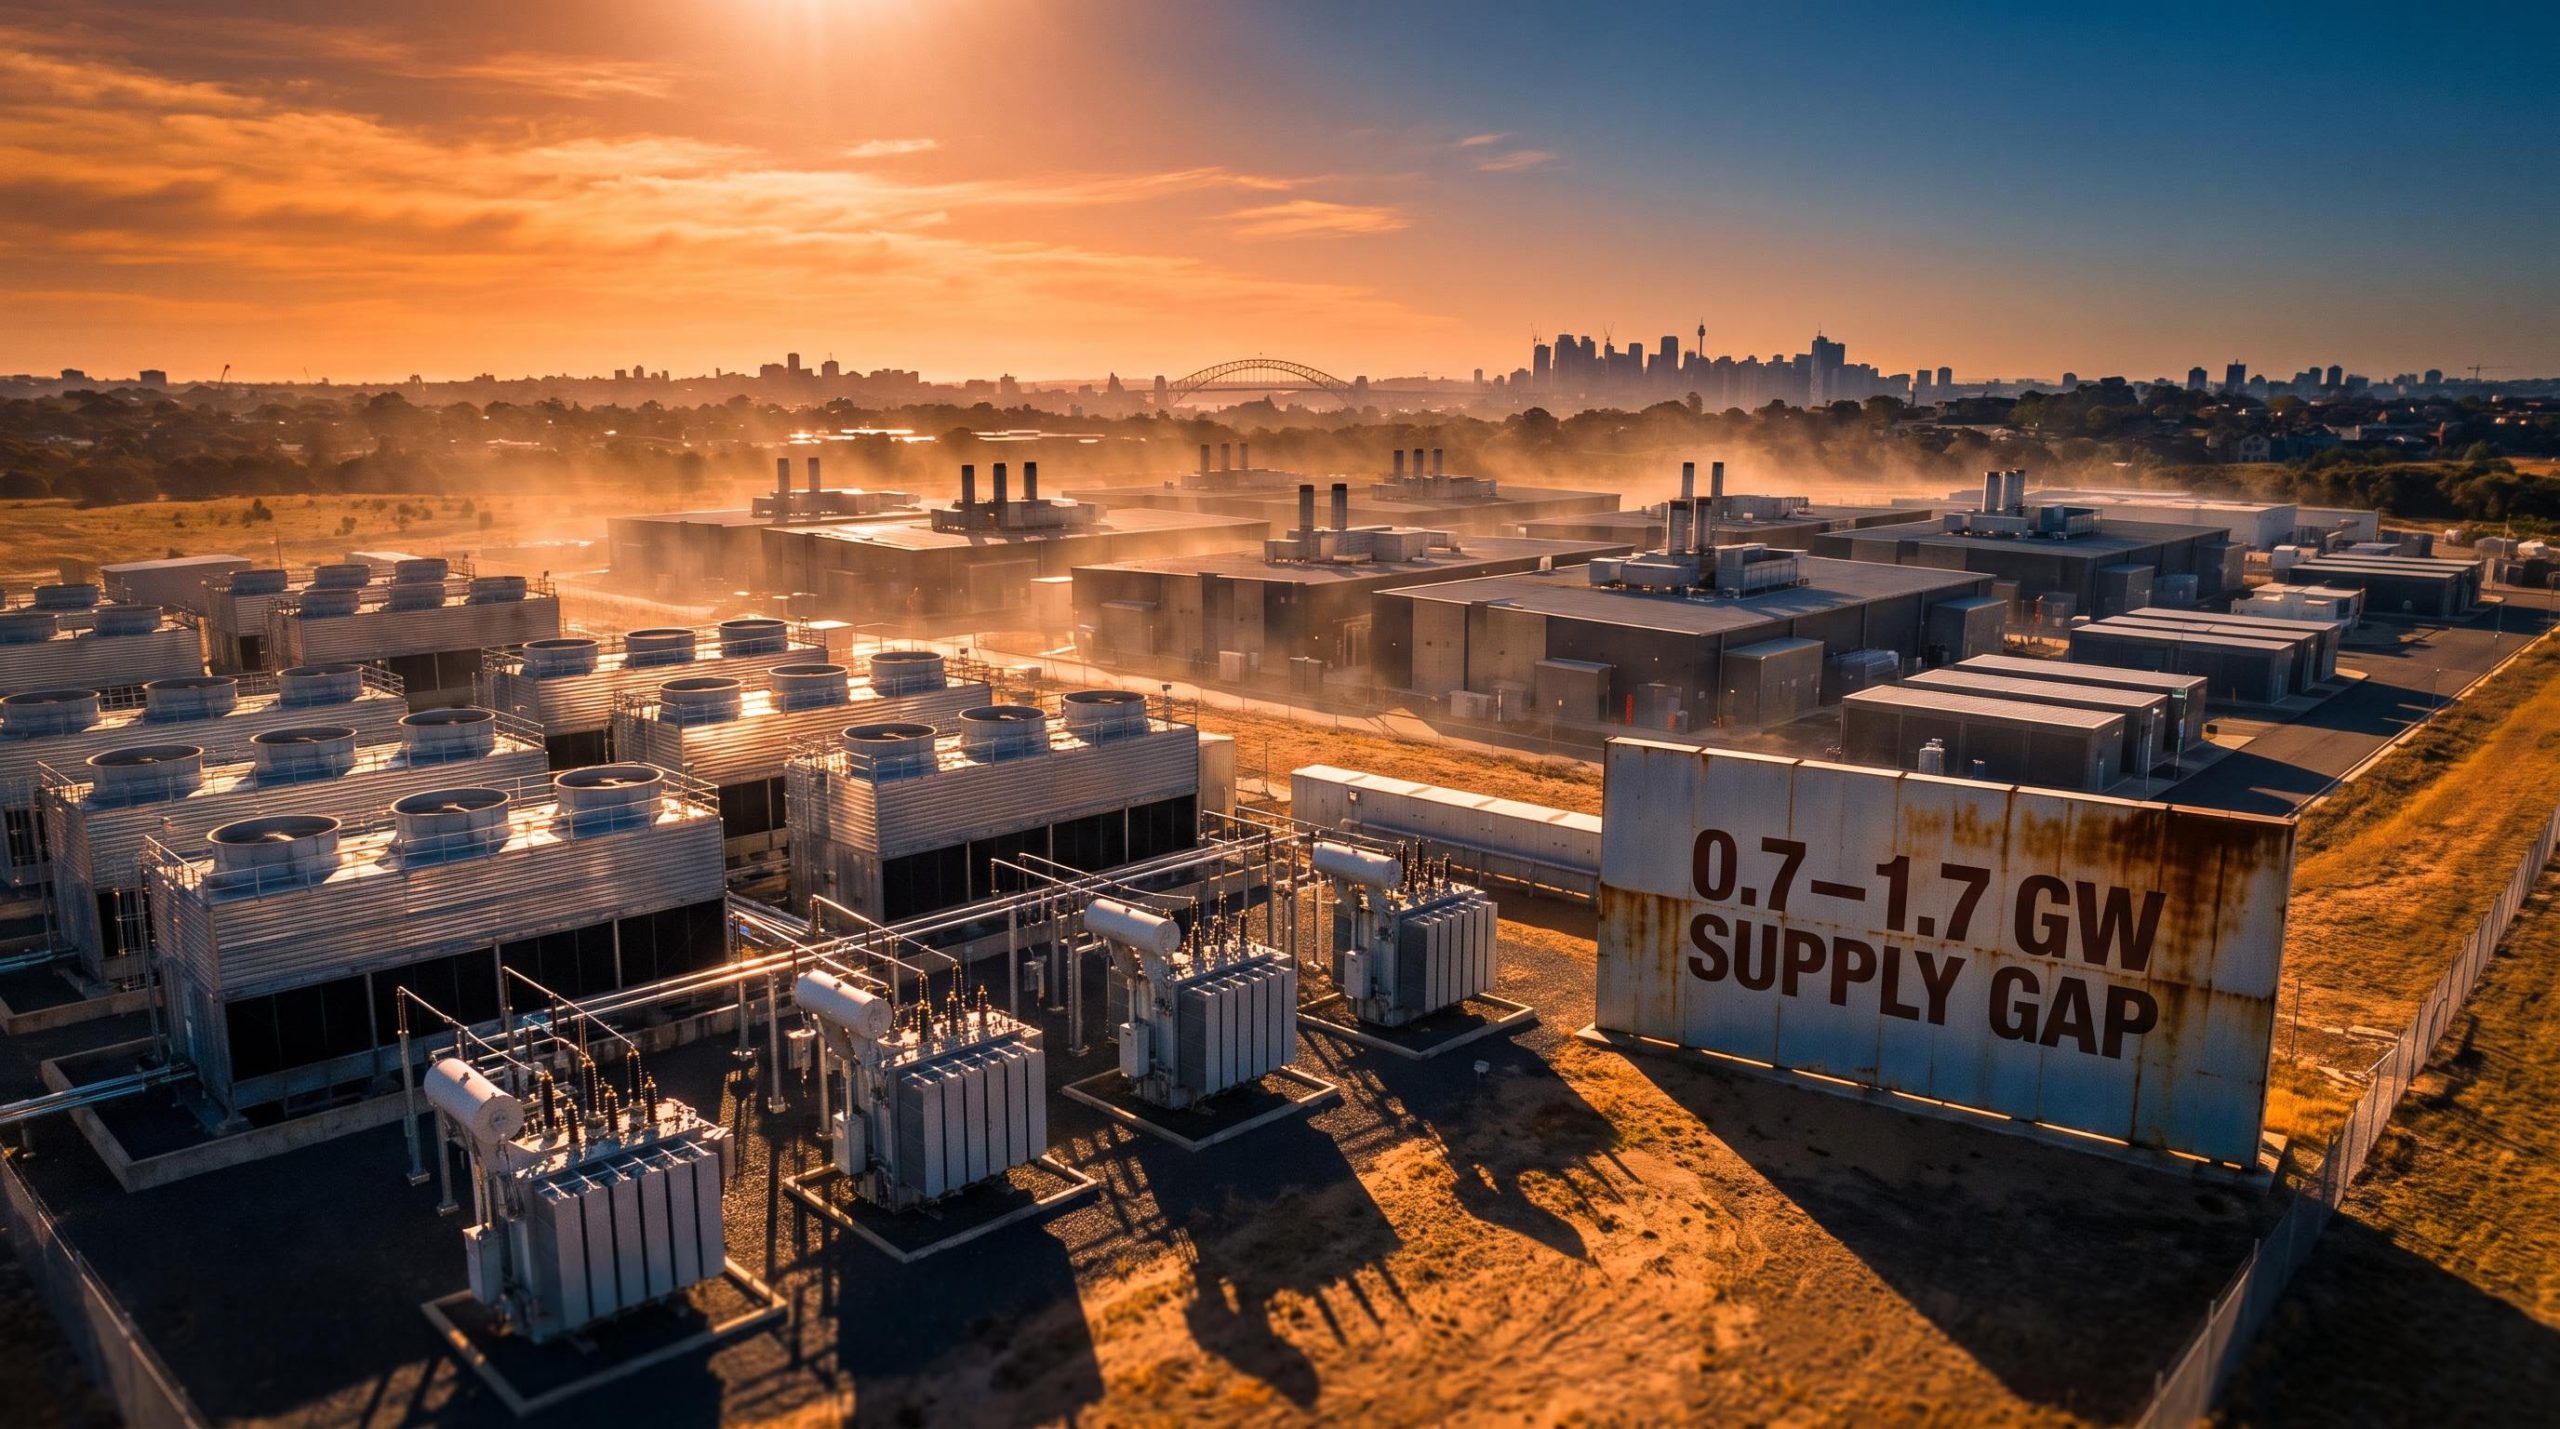
Australia’s data centre operational capacity sits at approximately 1.4 GW today. Forecasters project a supply gap of 0.7-1.7 GW by 2028, even as billions in global capital race to close it. That is not a settled growth story. It is a battleground with asymmetric outcomes.
The convergence is structural: AI compute intensity, hybrid cloud architecture, and data sovereignty policy have combined to make Australian infrastructure genuinely strategic. For investors positioning in this sector, the capital decision is not simply about buying property-like yield. It is a bet on how economic rents will be distributed among hyperscalers, operators, power providers, and regulators over the next decade.
Here is a framework for assessing which parts of the bull case rest on durable structural evidence and which carry execution, technology, or competitive risks that current valuations may not fully discount. The distinction matters because the two categories demand different entry conditions and different monitoring discipline.
What is actually driving demand, and how durable is it?
Not all demand drivers carry the same staying power, and separating the durable from the cyclical is where investment discipline starts.
AI workload demand is intense right now, with the AI-specific segment growing at a compound annual rate of approximately 19-20% through the early 2030s. But AI hardware efficiency is improving rapidly. More efficient chips and training methods could reduce per-unit physical demand even as total data volumes grow. That makes AI workloads the most powerful near-term driver and the most assumption-sensitive over a five-year horizon.
The more durable forces sit beneath the headlines:
- AI workloads: High-intensity demand today, but hardware-efficiency-sensitive. Durability is moderate and cycle-dependent.
- Hybrid and multi-cloud architecture: Enterprise migration is mid-cycle, with years of colocation demand ahead regardless of any single hardware trend. High durability.
- Data sovereignty: Regulatory requirements for onshore hosting in government and regulated industries create genuinely sticky, policy-driven demand. Very high durability.
- IoT and analytics data growth: Persistent aggregate data expansion from connected devices and enterprise analytics. Steady and structural.
Sovereign inference architecture, where AI model training and inference are conducted entirely within Australian jurisdiction to address legal exposure from US CLOUD Act reach over US-controlled infrastructure, represents one of the most durable demand vectors because the compliance requirement is structural and cannot be satisfied by offshore compute regardless of cost or efficiency improvements.
When tenants cross-connect to multiple cloud providers inside a neutral facility, they generate interconnection revenue for the operator. In 2025, that revenue stream accounted for roughly 8.6% of NextDC’s total net recurring revenue, a figure that illustrates how much value multi-cloud connectivity already creates and that grows as more enterprises adopt architectures requiring simultaneous access to several hyperscalers.
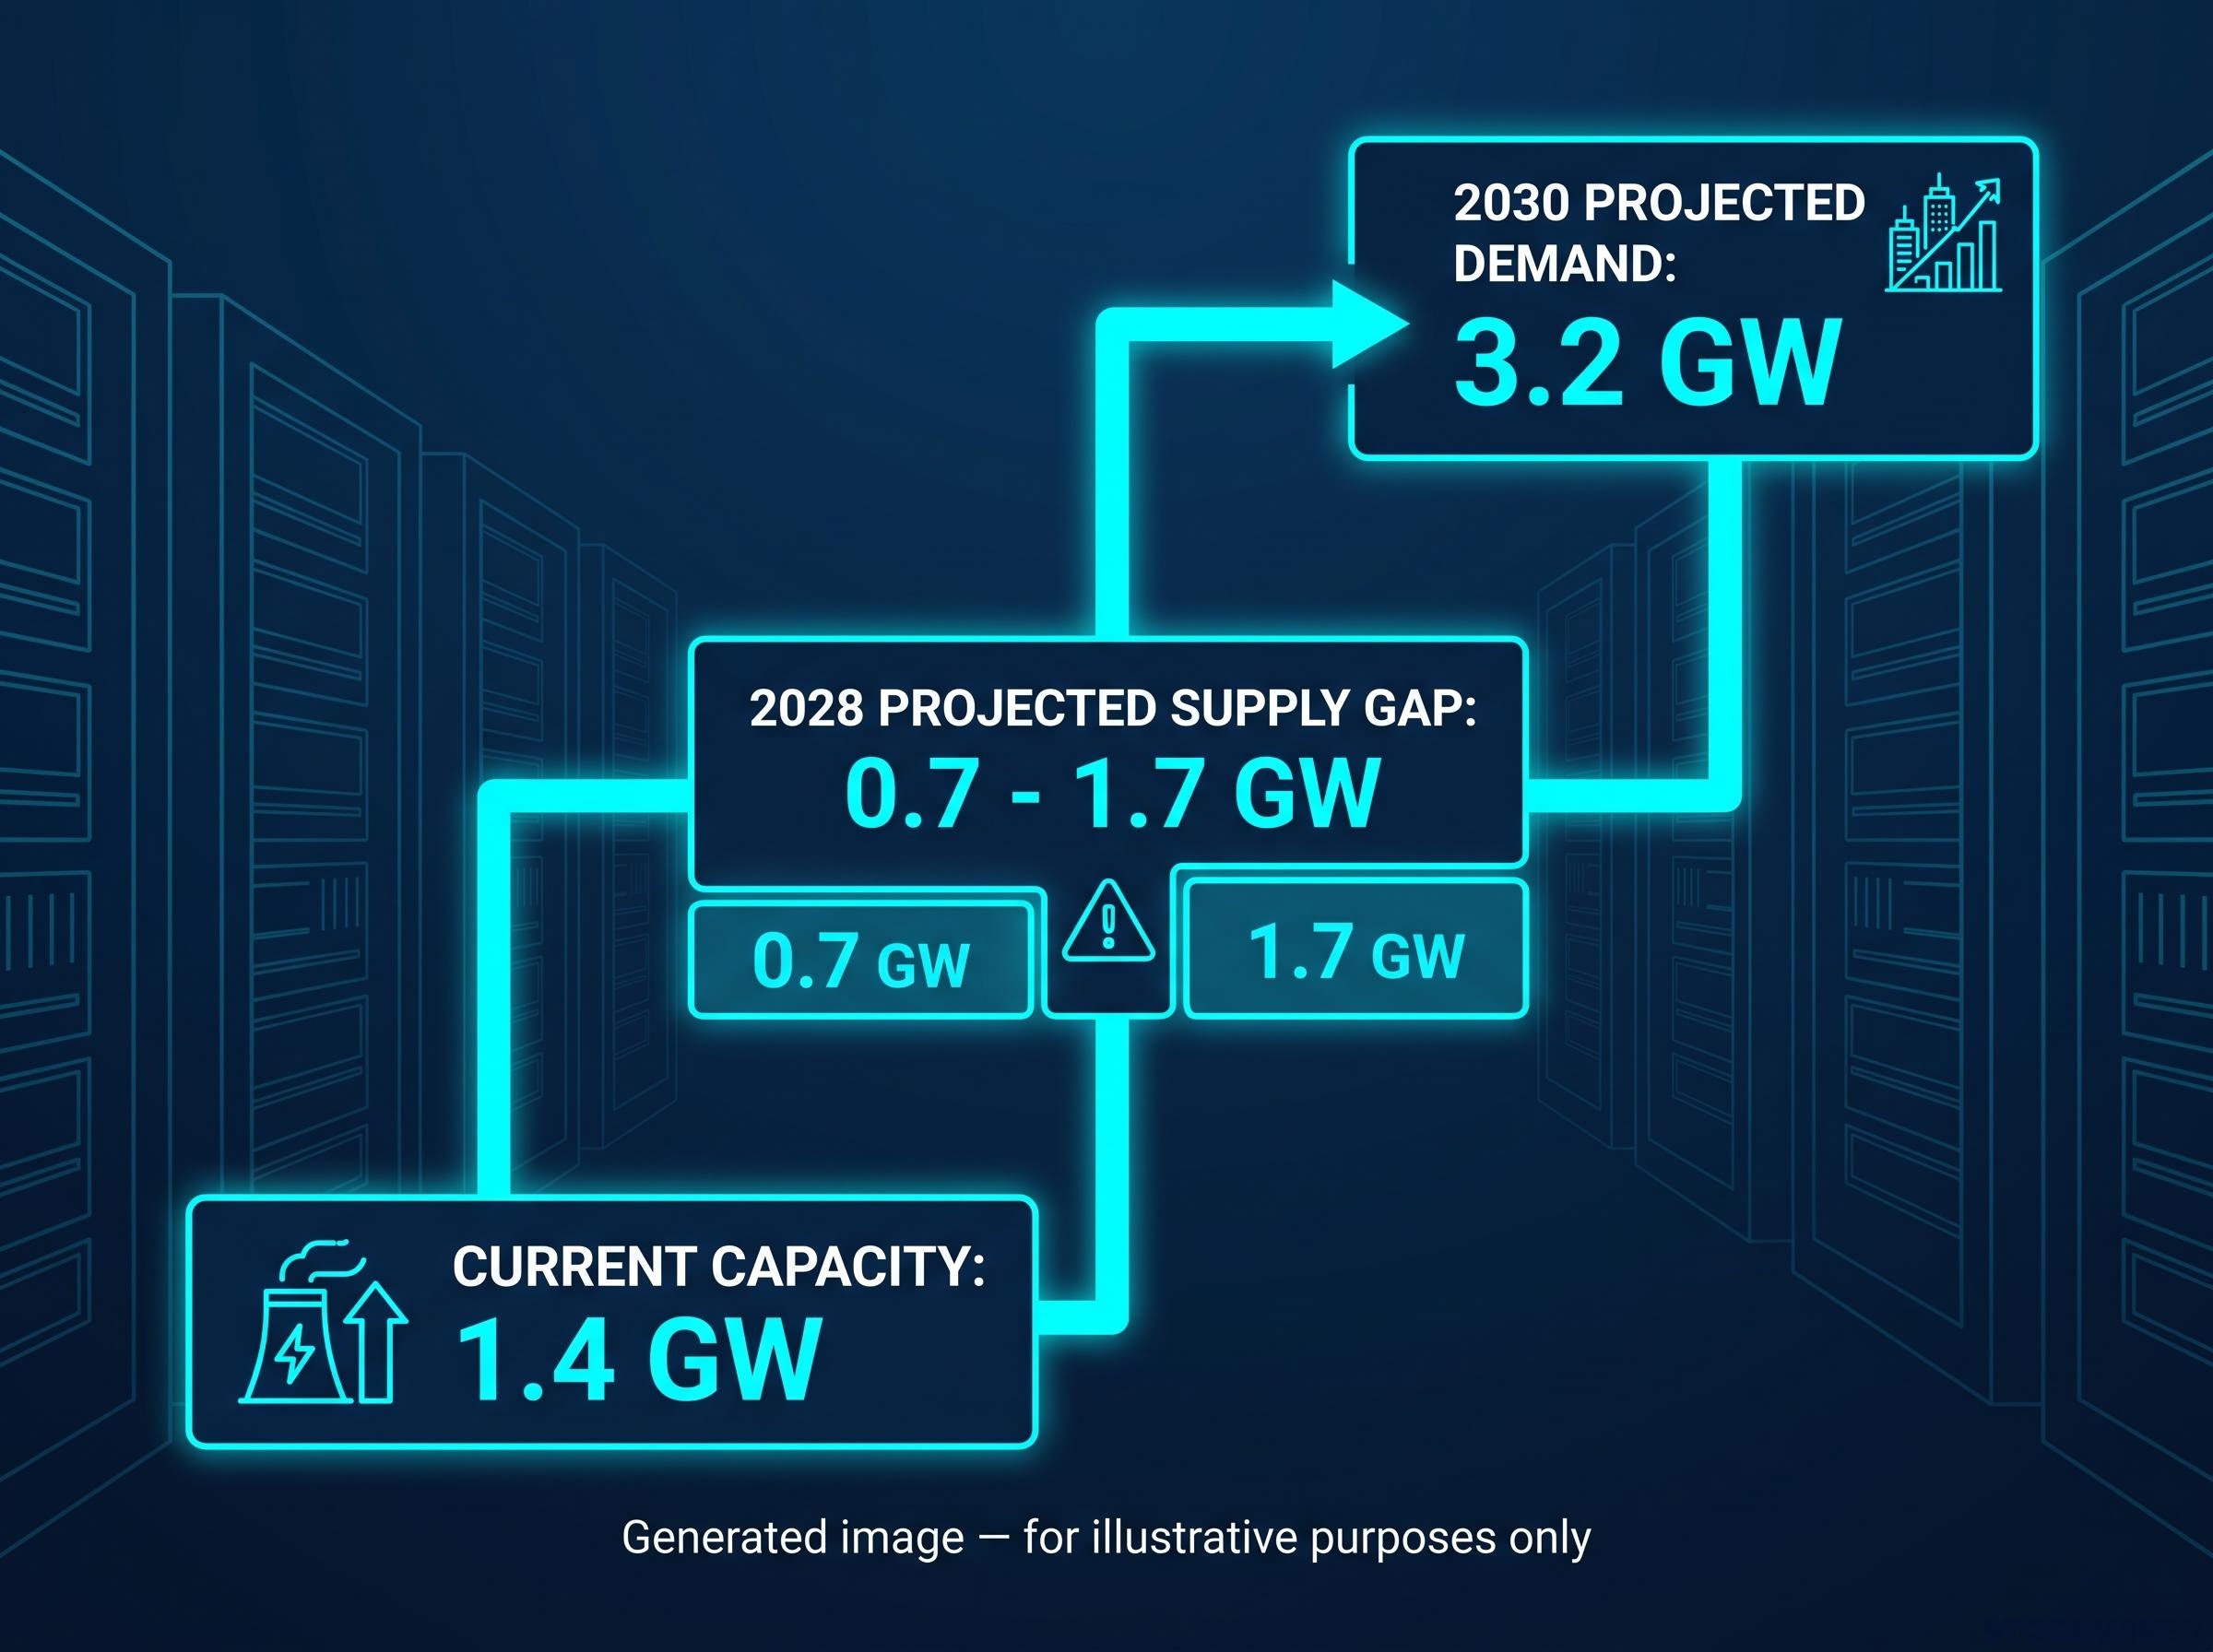
Australia’s forecast supply gap of 0.7-1.7 GW by 2028 captures the tension between current capacity of 1.4 GW and projected demand reaching 3.2 GW by 2030. The gap is real, but closing it depends on electricity generation, grid upgrades, and planning approvals keeping pace.
The investment thesis is substantially stronger if it rests on data sovereignty and hybrid architecture adoption than if it depends primarily on near-term AI hardware demand. Investors who conflate AI hype with structural demand risk mispricing both the upside timeline and the scenario where efficiency gains erode per-unit physical requirements faster than anticipated.
When big ASX news breaks, our subscribers know first
How Australia stacks up as an infrastructure destination
Australia’s structural advantages are genuine. Geopolitical stability, credible legal and financing frameworks, and a market that remained comparatively underpenetrated by large international operators allowed domestic players to establish network effects and scale positions before global incumbents arrived. For government and regulated-industry workloads that require onshore hosting, Australia offers a combination of sovereignty, rule-of-law credibility, and connectivity that few Asia-Pacific alternatives can match.
| Factor | Australia | Singapore | South Korea |
|---|---|---|---|
| Construction permit timeline | ~120 days (ATSE/World Bank, unverified) | ~35 days | ~35 days |
| Market concentration | >60% in Sydney and Melbourne | Concentrated but land-constrained | Distributed across multiple metros |
| Geopolitical/sovereign positioning | Strong Five Eyes alignment, stable legal framework | Neutral hub, capacity constraints emerging | Allied but geographically exposed |
Where Australia competes and where it concedes ground
Australia wins on sovereignty and latency grounds for specific workload categories: government, financial services, and regulated industries that require data to stay onshore. For these customers, the planning timeline is a cost of doing business, not a deal-breaker.
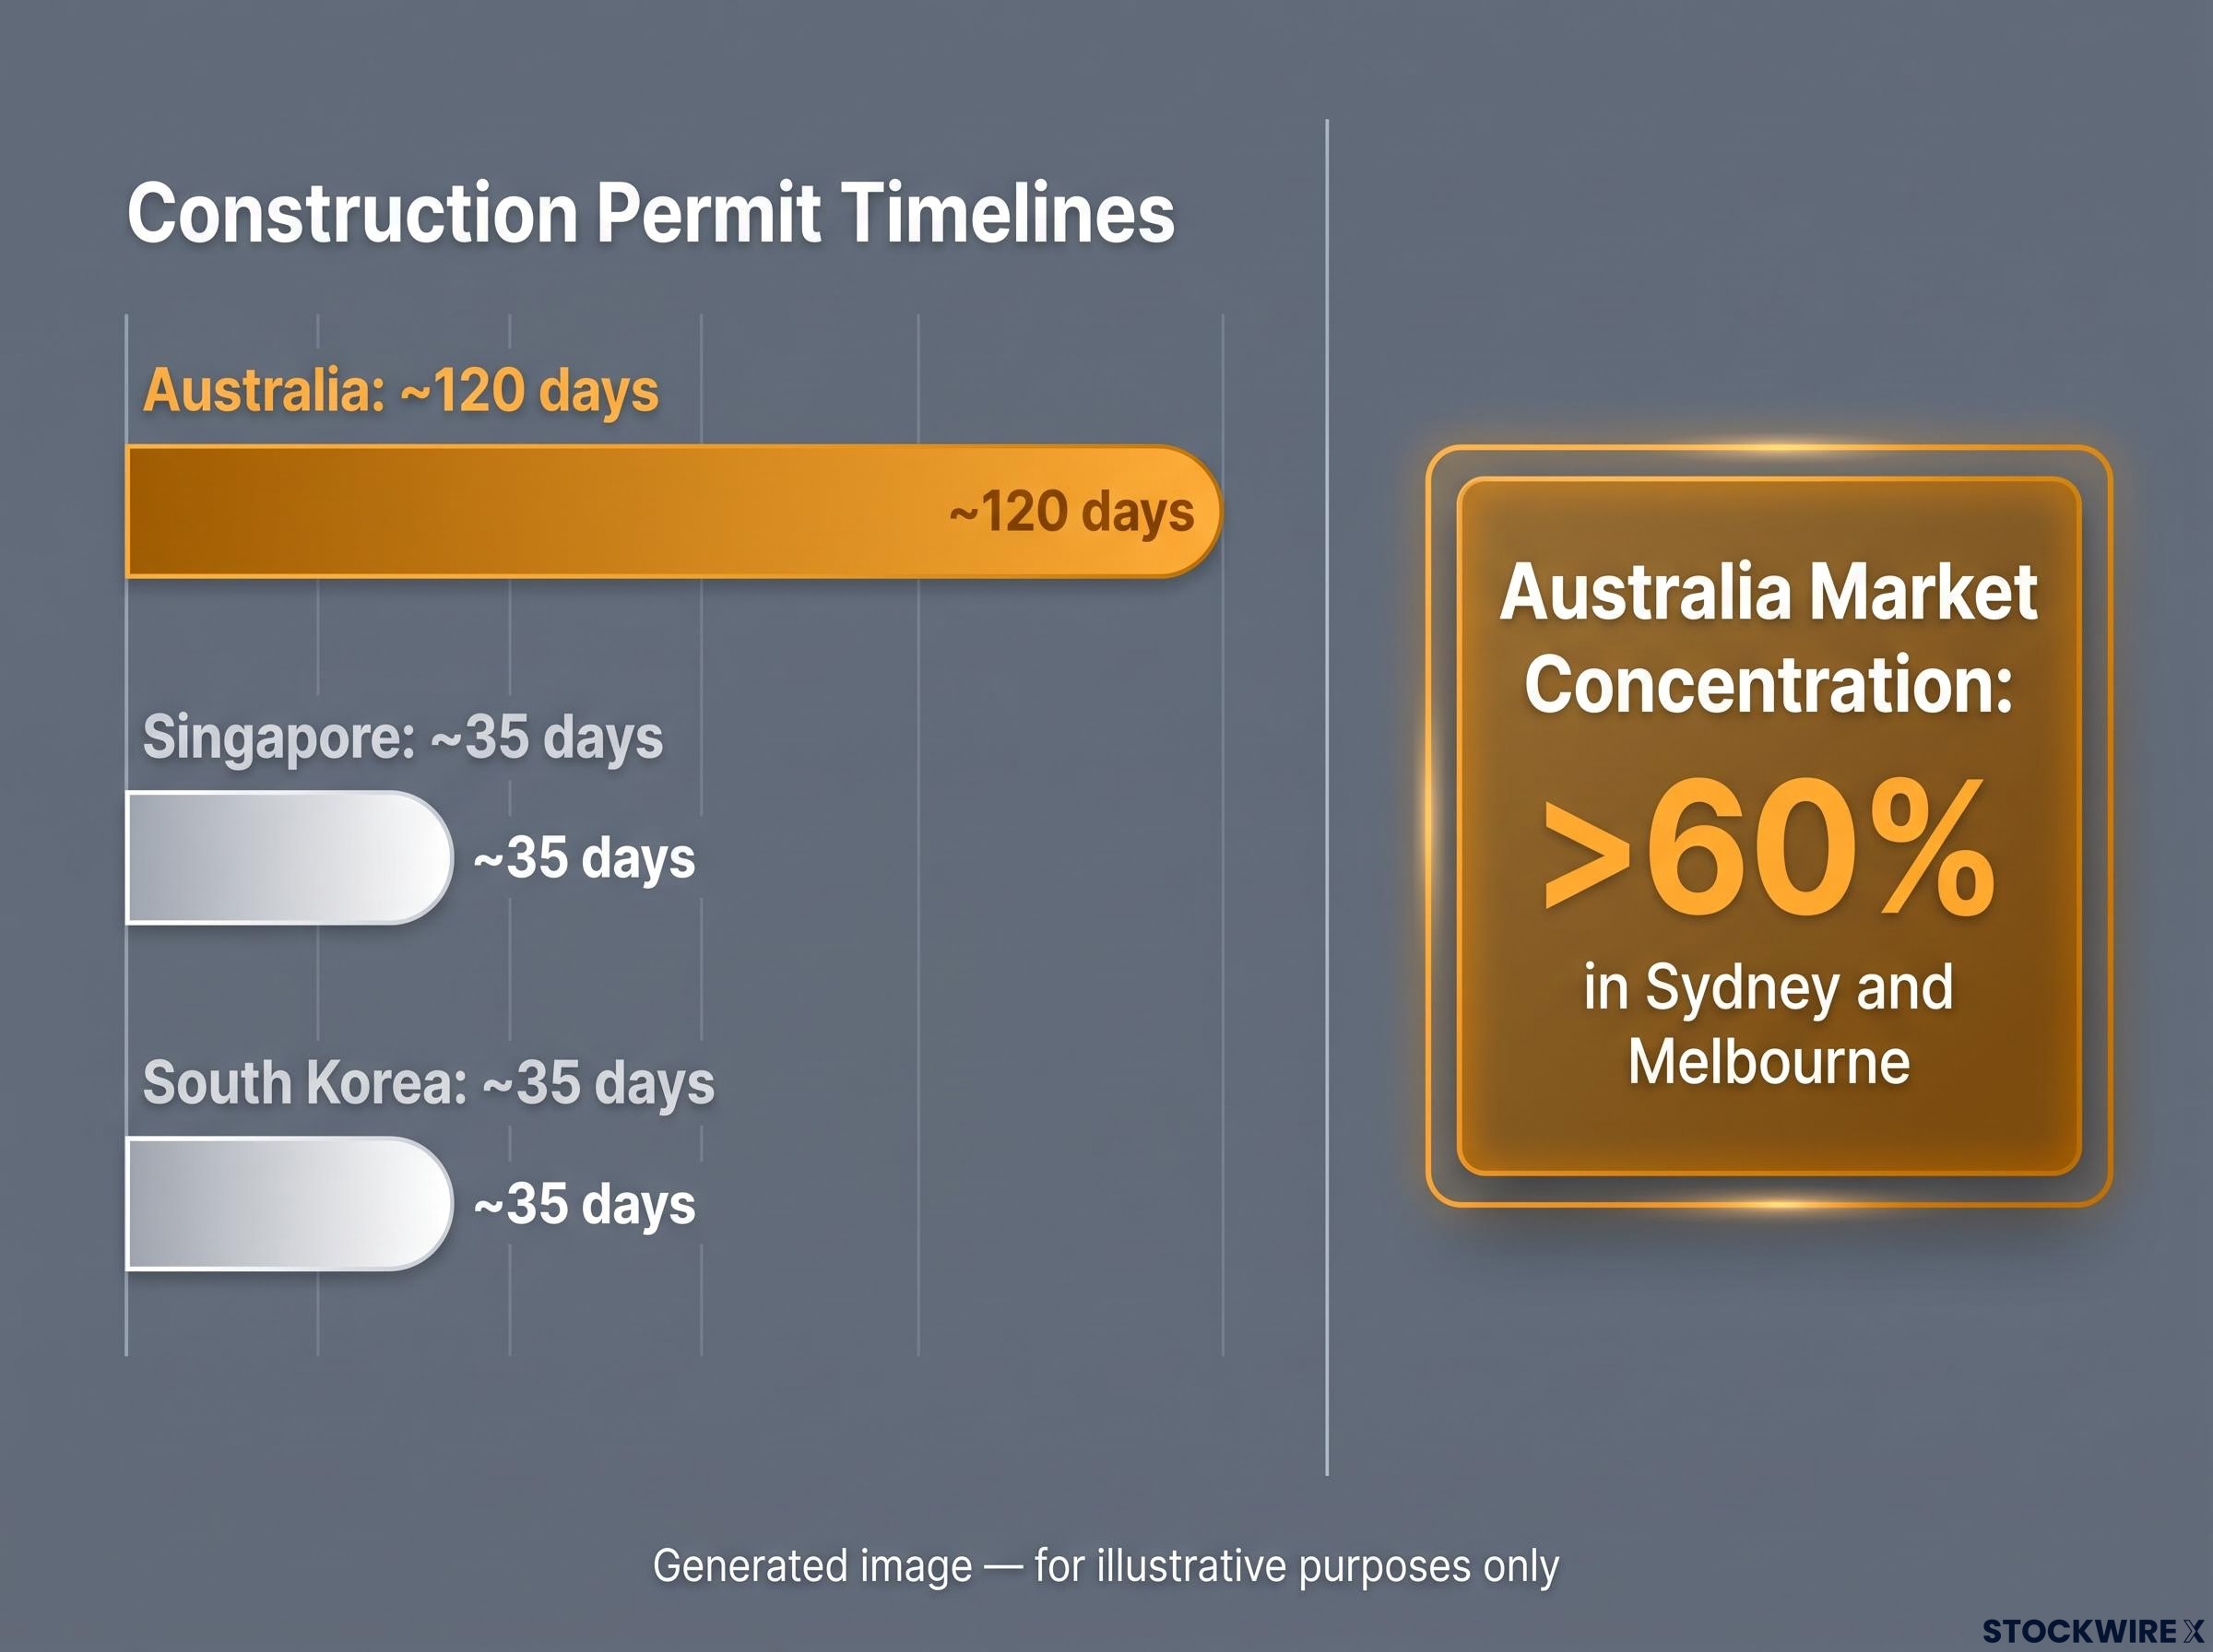
Where Australia concedes ground is speed. Hyperscalers prioritise delivery certainty, and an average construction permit timeline of approximately 120 days versus around 35 days in Singapore and South Korea (citing ATSE and World Bank analysis; independently unverified) creates genuine friction when cloud providers are racing to bring AI clusters online. The concentration of more than 60% of national capacity in Sydney and Melbourne (unverified) compounds this: simultaneous campus expansions in both cities intensify grid and planning bottlenecks at precisely the moment speed matters most.
Australia is not a substitute for Singapore. It is a latency-tolerant, politically stable complement for workloads that cannot sit in more constrained or geopolitically complex jurisdictions. The planning and concentration data tells you that Australia’s structural appeal does not automatically translate into frictionless execution, and that operators able to navigate approvals and diversify beyond the two dominant metros hold a meaningful advantage.
The risks that do not appear in the growth projections
The bull case for Australian data centres rests on a set of assumptions. Each of the following risk categories challenges a specific one, and several are base-case considerations rather than tail scenarios.
- Hyperscaler concentration and bargaining power. The largest cloud providers are simultaneously the most critical revenue sources and the most capable potential competitors. They can build proprietary facilities, draw enterprise workloads into their own environments, and reprice contracts with significant leverage. Assumption challenged: that colocation operators will retain their share of workload hosting. Monitor: hyperscaler proprietary build announcements and enterprise win-rates at neutral facilities.
- Technology and architecture shifts. More efficient AI hardware, improved data compression, and tiered storage strategies could reduce per-unit physical demand. Rapid design evolution means older facilities may require expensive retrofits for high-density AI racks or liquid cooling. Assumption challenged: that physical capacity demand scales linearly with data growth. Monitor: GPU-per-model efficiency trends and retrofit capital expenditure across the sector.
- Power and energy constraints. The 0.7-1.7 GW supply gap exists largely because grid upgrades and generation capacity are not keeping pace. Water availability for cooling adds a second constraint. Assumption challenged: that capacity can be delivered on the timeline demand requires. Monitor: grid-connection approvals and power-purchase agreement pricing in Sydney and Melbourne.
Physical bottlenecks, specifically power availability, energy storage, and grid interconnection timelines, are now formally identified by AEMO’s Draft 2026 Integrated System Plan as structural demand drivers rather than transitional constraints, a framing that shifts the risk calculus for operators holding large development pipelines in Sydney and Melbourne.
- Regulatory and national security headwinds. Tightening critical-infrastructure rules, foreign investment review, and cyber-security obligations raise compliance costs and could constrain ownership structures or approval timelines. Assumption challenged: that the regulatory environment will remain investment-friendly. Monitor: legislative changes to critical-infrastructure and foreign-investment frameworks.
- Capital-cycle dynamics. Infrastructure funds, sovereign wealth funds, and specialist real-estate capital are pouring into Australian data centres. If supply constraints ease faster than expected, a wave of new capacity could compress returns. Assumption challenged: that current supply-demand tightness persists through the late 2020s. Monitor: new entrant announcements and vacancy-rate trends in Sydney and Melbourne.
The risk most likely to be underweighted in consensus analysis is virtual connectivity substitution. As software-defined networking and zero-trust architectures mature, a growing share of workloads may no longer require tenants to be physically co-located with multiple clouds. For those customer segments, the pricing advantage of physical proximity erodes, which puts pressure on interconnection revenue (roughly 8.6% of NextDC’s net recurring revenue in 2025) even in a scenario where base colocation volumes remain intact.
Each of these risks should be modelled explicitly before assuming the current growth trajectory will persist uninterrupted to 2030. Investors who understand which risks directly threaten revenue lines, rather than simply slowing growth, are better positioned to set entry conditions and identify early warning signals.
NextDC’s position in the battleground: scale as both asset and liability
NextDC’s FY26 results, for the year ended 30 June 2026, show a platform operating at genuine scale: 287.9 MW of built capacity, 537 MW under development, more than 130 MW in planning, a record forward order book of 565.1 MW, and contracted utilisation (pro forma) of 740.1 MW. The regional pipeline exceeds 3 GW. International expansion is executing, with the KL1 Kuala Lumpur facility operational with a foundation customer from May 2026.
| Project / Category | Capacity (MW) | Status | Primary risk |
|---|---|---|---|
| Built capacity (total) | 287.9 | Operational | Utilisation and pricing pressure |
| S4 Sydney | 365 (250 in progress) | Under development | Grid connection and planning approvals |
| M5 Melbourne | 1,200 (target) | Site acquired, early stage | Power procurement and demand timing |
| Forward order book | 565.1 | Contracted | Hyperscaler concentration and repricing |
| KL1 Kuala Lumpur | Foundation stage | Operational (May 2026) | International execution and demand ramp |
The interconnection moat: real but not permanent
NextDC’s structural moat is its neutral co-location environment. Customers cross-connect to multiple hyperscalers simultaneously inside these facilities. As multi-cloud adoption deepens, the value of being the physical point where cloud on-ramps converge increases. This network effect is harder to replicate than raw physical capacity because it depends on customer density and cloud-provider presence, both of which compound over time.
The moat’s permanence, however, depends on enterprise architecture choices. If more workloads shift to software-defined connectivity over the next five to ten years, the premium on physical proximity diminishes. For now, the interconnection advantage is real and growing. Whether it endures at current value is a technology question, not a certainty.
The capital-intensity challenge is the other side of scale. Committing to power-secure sites before hyperscalers sign long-term contracts is the core execution risk. Joint ventures manage this exposure but introduce counterparty and governance complexity. The scale of capital committed to S4 Sydney (365 MW planned) and M5 Melbourne (1.2 GW target) means that execution or demand shortfalls in those two projects carry disproportionate consequences for returns. Investors focused on NextDC’s value creation over FY27 to FY30 should concentrate their due diligence on these specific projects rather than treating the entire pipeline as uniformly de-risked.
Capital structure choices at this scale carry direct implications for ordinary shareholders: NextDC’s April 2026 hybrid securities raise was specifically designed to be non-dilutive, a distinction that contributed to a 21.6% share price surge and that investors in large-pipeline infrastructure operators need to assess alongside contracted megawatt figures.
Separating the durable thesis from the assumptions that need watching
The core of the durable bull case is worth stating plainly: structural demand from data sovereignty, hybrid architecture, and mid-cycle cloud migration, combined with genuine barriers to entry from power-secured sites and interconnection density, supports a multi-year growth runway that is not simply AI-cycle-dependent. That foundation is well-evidenced and not dependent on any single technology wave holding its current trajectory.
The durable bull case rests on sovereignty-driven demand, mid-cycle hybrid cloud migration, and physical barriers to entry. These forces are structural and policy-embedded, not speculative. They form the floor of the investment thesis; everything above that floor requires ongoing validation.
The six variables that will determine whether the bull case holds or degrades over the next 24-36 months:
- Power and planning policy in Sydney and Melbourne. Watch for: grid-connection approval timelines and energy-contract pricing. Negative signal: approval backlogs extending beyond current averages or power costs rising faster than tenant pass-through mechanisms allow.
- Hyperscaler contracting and proprietary build-out behaviour. Watch for: the ratio of hyperscaler capacity placed with neutral operators versus proprietary facilities. Negative signal: a major hyperscaler announcing self-built Australian campuses that bypass colocation.
- Regulatory developments around critical infrastructure and foreign investment review. Watch for: legislative amendments to critical-infrastructure or foreign-investment frameworks. Negative signal: new compliance requirements that materially raise operating costs or constrain capital structures.
- AI hardware and storage efficiency trends. Watch for: GPU-per-model efficiency improvements and data-compression adoption rates. Negative signal: a step-change in hardware efficiency that reduces per-unit physical demand by more than 20% within a two-year window.
- Capital supply dynamics and competing capacity. Watch for: new entrant announcements, vacancy rates (currently approximately 12%, unverified), and institutional capital commitments to competing platforms. Negative signal: vacancy rates rising above 15% in either Sydney or Melbourne.
- NextDC execution milestones for S4 Sydney and M5 Melbourne. Watch for: construction progress, power-connection dates, and anchor-tenant announcements. Negative signal: timeline slippage exceeding six months or anchor-tenant delays.
Reports have identified up to A$100 billion in potential AI-infrastructure-linked economic activity (unverified), a figure that explains the scale of global capital interest. The monitoring framework above is the discipline required to distinguish operators positioned to capture that opportunity from those exposed to its risks. Investors who track these variables will have earlier visibility into whether the bull case is confirming or degrading than those who rely solely on quarterly revenue results, because the structural variables move before the financials do.
Whether Australia’s data centre premium is earned or assumed
Australia’s data centre market has genuine structural foundations: sovereignty requirements, hybrid architecture adoption, mid-cycle cloud migration, and a credible demand pipeline. These distinguish it from pure-hype infrastructure plays. But the battleground framing in this analysis is precise rather than rhetorical. Multiple well-capitalised actors, hyperscalers, infrastructure funds, sovereign wealth pools, and competing operators, are contesting economic rents that are not guaranteed to accrue to colocation providers.
The competitive landscape shifted materially in May 2026 when CDC Data Centres signed a 555 MW hyperscaler contract, the largest in Australian history, pushing its total contracted capacity past 1 GW and placing a second well-capitalised platform alongside NextDC in a market where economic rents are not guaranteed to concentrate with any single operator.
NextDC’s forward order book of 565.1 MW and contracted utilisation of 740.1 MW against built capacity of 287.9 MW illustrate the opportunity and the risk in a single comparison. The opportunity is real and signed. Nearly all the value creation sits in the pipeline. That makes execution risk the dominant variable in the investment equation right now.
The market’s headline compound annual growth rate of approximately 28.5% to 2030 (unverified) is the figure current valuations are pricing. Realising that rate requires execution on power, planning, and hyperscaler relationships simultaneously. If any of those three falters in a concentrated metro, the growth rate compresses.
The investment question the entire analysis resolves to: whether current valuations adequately price execution, technology, and competitive risk alongside the structural demand case. The structural case is earned. Whether the premium paid for it is justified depends on the discipline investors bring to monitoring the six variables that will determine how, and to whom, economic rents are distributed.
This article is for informational purposes only and should not be considered financial advice. Investors should conduct their own research and consult with financial professionals before making investment decisions.
Past performance does not guarantee future results. Financial projections referenced in this analysis are subject to market conditions and various risk factors. Forward-looking statements regarding market size, growth rates, and capacity projections are speculative and subject to change based on market developments, regulatory action, and operator performance.
—