
Most investors assume inflation is bad for tech stocks. The logic feels airtight: rising rates increase the discount applied to future cash flows, and technology companies, whose valuations rest heavily on earnings years away, get punished hardest. During the 2022 rate-hiking cycle, that is exactly what happened.
But a specific subset of the software sector did not just survive inflation. It is structurally designed to benefit from it.
The distinction comes down to how cash moves through the business. Software companies with negative working capital, where customers pay upfront before revenue is recognised or costs are incurred, convert inflationary price increases into disproportionately larger free cash flow. In a world of persistent monetary expansion, a U.S. federal IT budget exceeding $100 billion per year, and accelerating government technology modernisation, the conditions that power this mechanic are not hypothetical. They are already in place.
Here is the specific business model logic that separates software companies compounding real cash flows in inflationary environments from those being compressed by them, and how you apply that distinction to your own positioning today.
Why inflation usually punishes tech stocks, and why some software is different
When inflation rises, central banks raise interest rates to cool the economy. Higher rates increase the discount rate, the rate used to calculate what future cash flows are worth today. A dollar of earnings five years from now is worth less in present-value terms when rates are at 5% than when they sit at 1%.
That arithmetic hits long-duration assets hardest. Technology stocks, particularly software companies whose valuations reflect growth years into the future, are among the most sensitive to this compression. The higher the share of a company’s value tied to distant earnings, the steeper the markdown.
A steepening yield curve, where the spread between short and long-dated Treasuries widens, can be misread as a tightening signal when it is actually indicating looser credit conditions, a distinction that directly affects whether the discount-rate pressure on long-duration software valuations is intensifying or beginning to ease.
The 2022 software derating was not an operating breakdown. It was discount-rate compression: future cash flows were worth less at higher rates, even though the underlying business models continued to perform. That distinction is the foundation of the entire inflation-hedge thesis.
The 2022 rate-hiking cycle is the clearest recent illustration. Software stocks were not punished because their subscription revenue collapsed or their customers churned. They were punished because the present value of their future earnings shrank under higher discount rates. Once that pressure eased and earnings caught up, the sector had room to re-rate, consistent with an extended base of underperformance followed by recovery.
Jim Carzan of Kai Wealth had publicly flagged the software opportunity approximately six months ahead of late August 2025, at a point when the sector was displaying early signs of a price floor forming and relative performance charts against the broader market were tracing what appeared to be a cup-and-handle technical setup.
That retrospective matters because it separates two types of investors: those who avoided tech entirely during the rate cycle, and those who understood the business model well enough to recognise when the derating had created a structural entry point. The variable that made the difference was not macro timing. It was understanding the working capital model underneath.
When big ASX news breaks, our subscribers know first
The negative working capital engine: how customer prepayments turn inflation into free cash flow
Negative working capital means a company’s current operating liabilities exceed its current operating assets. In enterprise software, this typically happens because customers are invoiced and pay annually in advance, before the company recognises revenue or incurs most of the costs associated with delivering the service.
That cycle works like this:
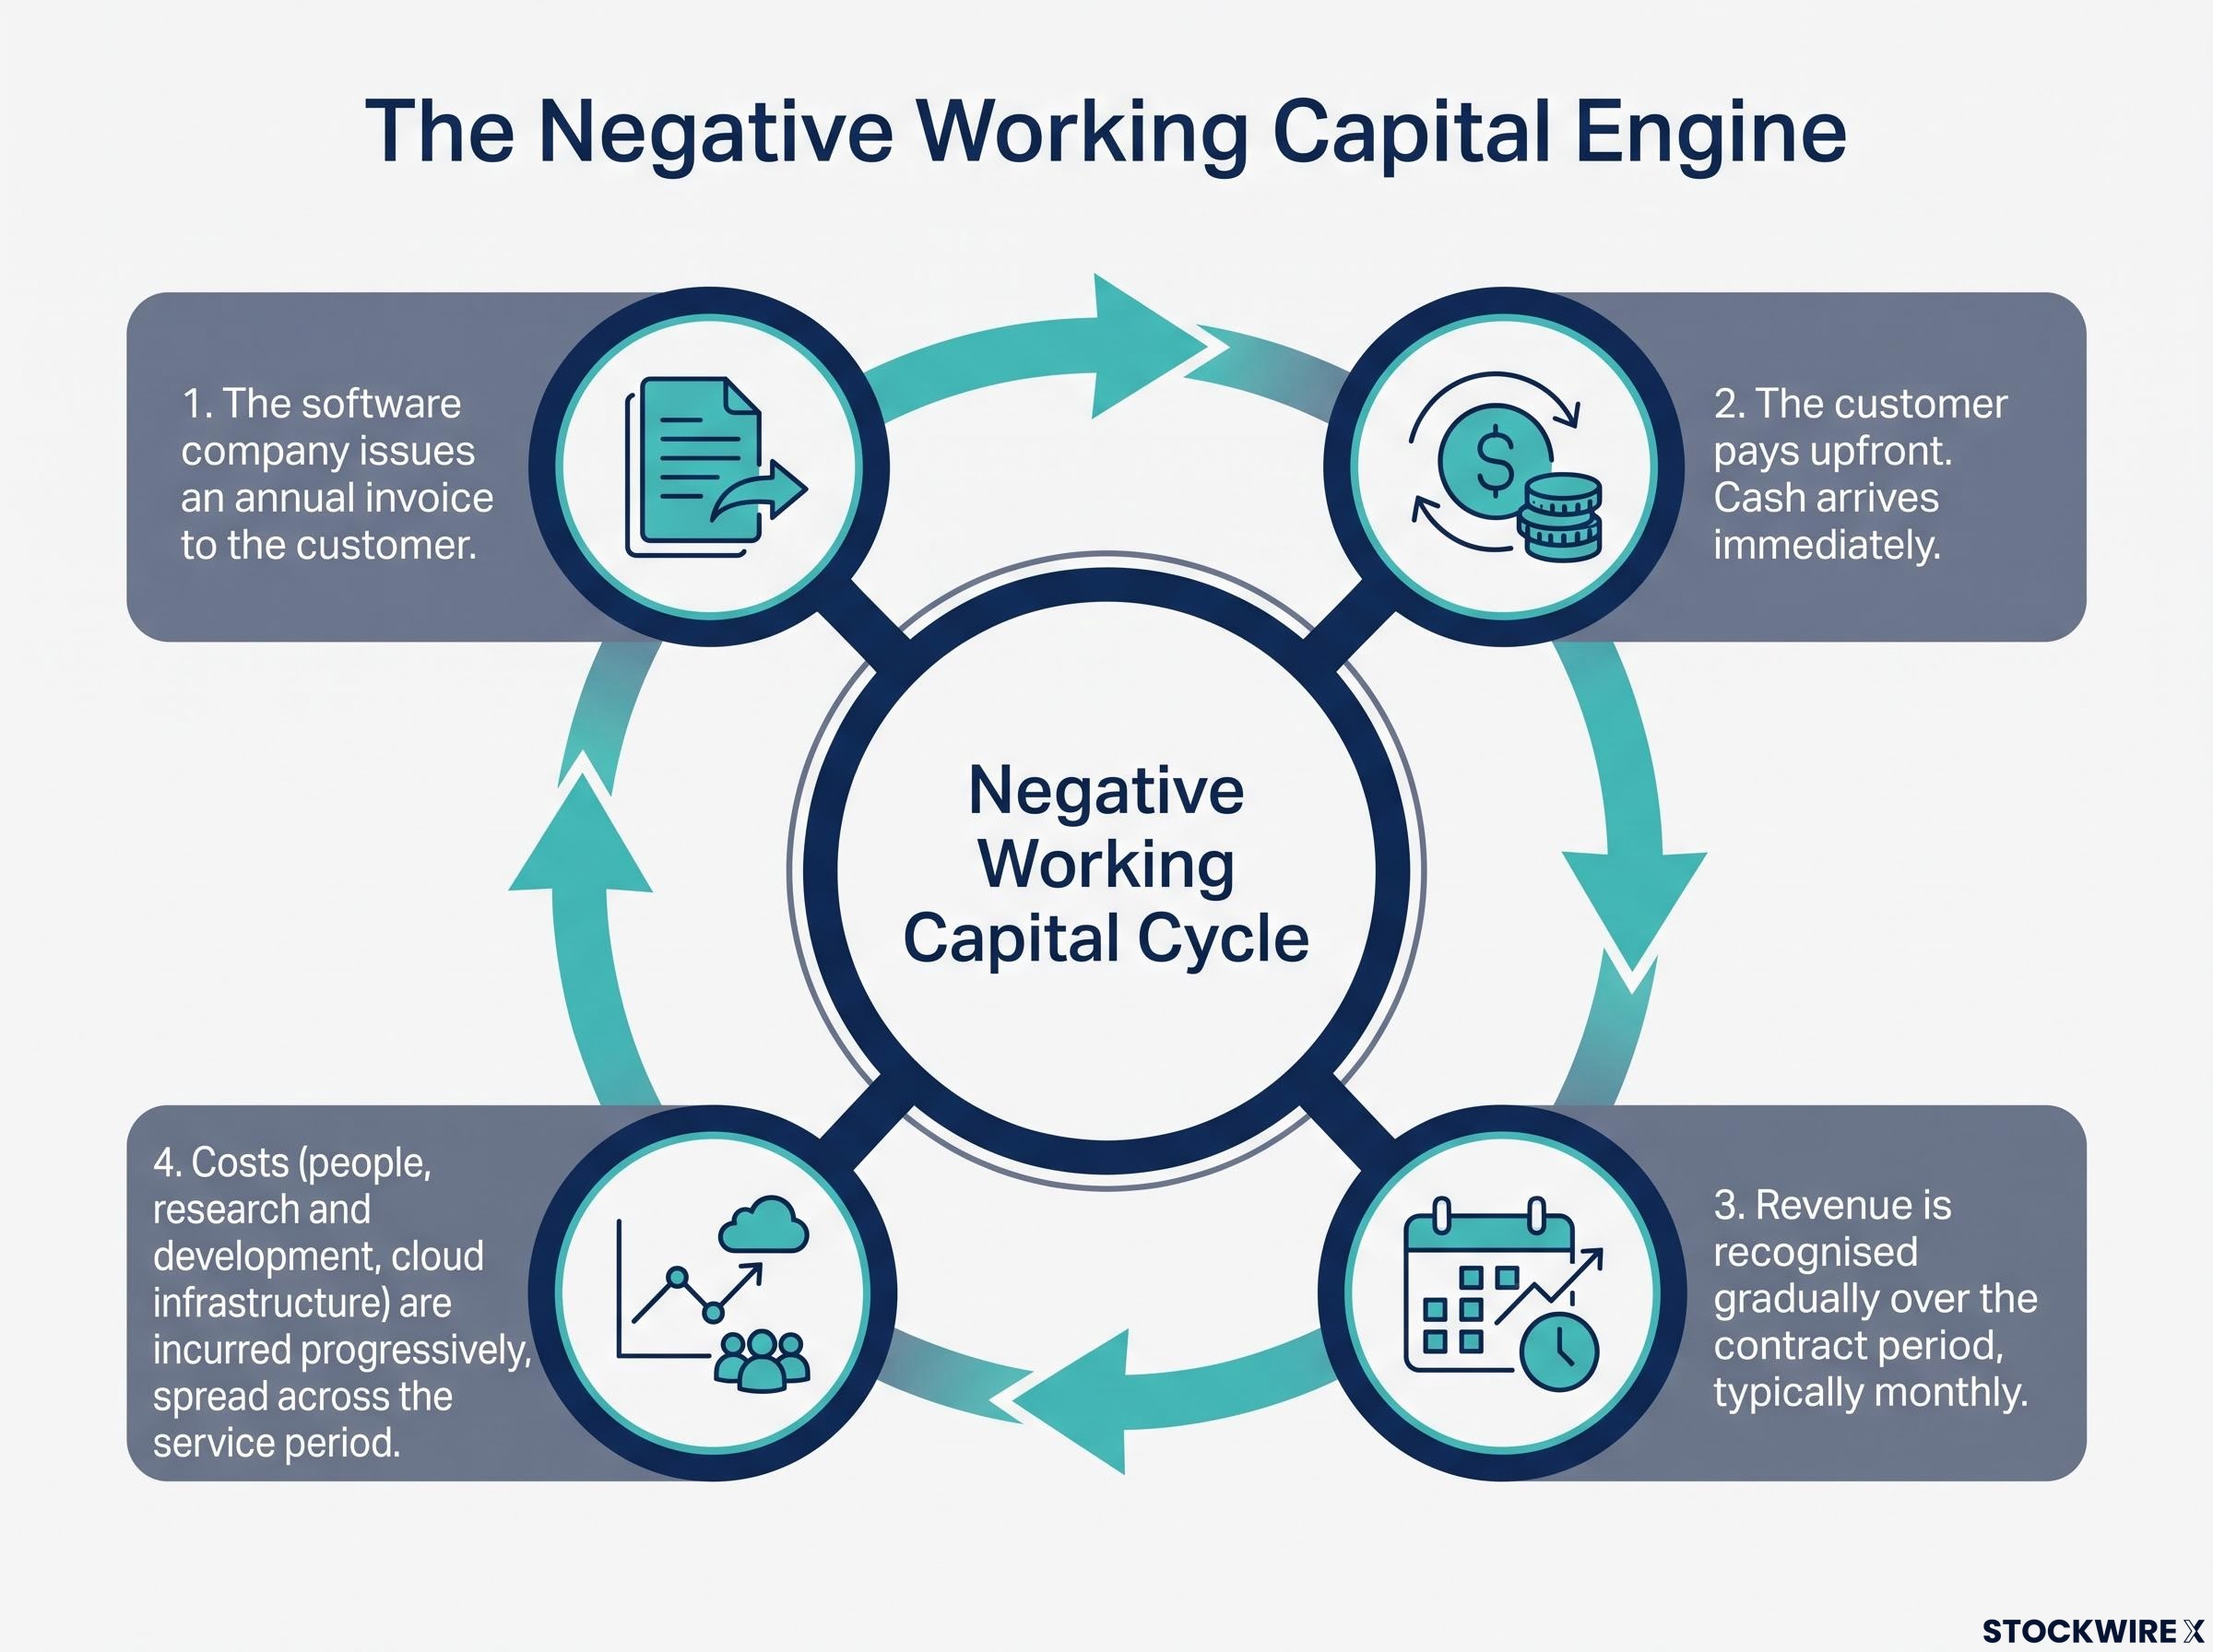
- The software company issues an annual invoice to the customer.
- The customer pays upfront. Cash arrives immediately.
- Revenue is recognised gradually over the contract period, typically monthly.
- Costs (people, research and development, cloud infrastructure) are incurred progressively, spread across the service period.
The result is that the company holds your cash before it has earned it or spent it.
Customer prepayments function as an interest-free loan from the customer to the business. The customer finances operations and growth, and the company never pays interest on that capital.
Now add inflation. When nominal prices rise, software contract renewals and built-in escalators lift revenue. Multi-year contracts with discount normalisation cause effective contract spend to rise over time, even without headcount growth on the customer side. But the cost base, primarily people, R&D, and cloud infrastructure, adjusts more slowly. Free cash flow expands disproportionately.
Salesforce illustrates the scale: net working capital of approximately negative $16.9 billion, with deferred revenue representing roughly one-fifth of total liabilities and equity. That is not a temporary artefact. It is the structural fingerprint of a business funded by its customers.
Not every company labelled “software” works this way. Some technology names are taking on substantial leverage, which weakens their inflation-hedge characteristics and increases sensitivity to rate changes. Identifying which model you own is what determines whether inflation helps or hurts your position.
| Characteristic | Negative working capital software | Debt-heavy tech |
|---|---|---|
| Working capital structure | Customers prepay; liabilities exceed current assets | Funded by external debt; interest obligations |
| Inflation response | Revenue rises via renewals and escalators; costs lag | Debt servicing costs rise with rates |
| Rate sensitivity | Valuation-sensitive but operationally insulated | Both valuation and operating model exposed |
| Cash flow leverage | Free cash flow expands disproportionately with nominal growth | Cash flow diverted to interest payments |
ServiceNow and Salesforce as live case studies: what the thesis looked like in practice
ServiceNow: pricing evolution as a cash flow multiplier
ServiceNow sells workflow and IT service management software that is deeply embedded in enterprise infrastructure. Stickiness is extremely high. Customers do not swap out ServiceNow the way they might swap a marketing tool.
What makes ServiceNow particularly instructive is how its pricing has evolved. The company introduced a Pro Plus tier and an AI token-based consumption model that lifts average selling prices materially, even when seat counts are flat. Revenue now scales with the amount of work automated on the platform, not just the number of human users. That hybrid model, combining traditional seat-based licences with usage charges tied to workflow volume and AI agent execution, gives the platform multiple levers to grow revenue without proportional cost increases.
Annual upfront invoicing powers the working capital engine. As the company grows, new prepayments arrive before costs are incurred, producing a recurring tailwind rather than a cash drain. Free cash flow margins have run in approximately the mid-40% range in recent quarters (approximate; sourced from secondary research), illustrating how a high-growth SaaS business can simultaneously post strong cash economics.
ServiceNow’s AI revenue milestone of more than $1 billion in annual contract value by Q2 2026, with agentic AI deployments expanding ninefold over nine months, provides the most current data point confirming that the hybrid pricing model described here is generating real, measurable contract growth rather than remaining a forward aspiration.
Salesforce: activist discipline meets structural cash flow advantage
Salesforce is the scale case. Activist-driven cost discipline over recent years converted an already-favourable working capital structure into free cash flow generation in the tens of billions. With net working capital at approximately negative $16.9 billion and deferred revenue representing roughly one-fifth of liabilities and equity, the prepayment engine operates at enormous scale.
Salesforce delivered an earnings result that materially exceeded expectations, with the share price moving sharply higher in response, offering the most direct retrospective validation that the structural inflation-hedge thesis, which had been articulated months earlier as the sector was establishing a floor, was unfolding in line with what the working capital mechanics would predict.
Both companies confirmed the retrospective arc. The thesis was identified when these stocks were exhibiting bottoming signals, the cup-and-handle technical pattern suggested a bullish setup, and subsequent earnings and re-rating were consistent with that original call.
For you, these two companies are the test cases. Their actual cash flow performance and stock behaviour over the period is the evidence the thesis either passes or fails on. Understanding how ServiceNow’s pricing evolution and Salesforce’s working capital structure produced these outcomes equips you to evaluate whether future software names meet the same structural criteria, rather than pattern-matching on a sector label alone.
| Company | Working capital profile | Key pricing mechanism | Free cash flow characteristic | Retrospective signal |
|---|---|---|---|---|
| ServiceNow | Negative; annual upfront invoicing | Pro Plus tier + AI token consumption | Approx. mid-40% FCF margin | Bottoming signals confirmed by earnings re-rating |
| Salesforce | Approx. negative $16.9B net working capital | Multi-year contracts with discount normalisation | Tens of billions in annual FCF | Earnings beat with sharp stock price response |
Government technology spending as the demand floor: why this tailwind is not cyclical
The inflation-hedge thesis rests on business model mechanics. But mechanics need revenue to work on, and the durability of that revenue matters. Government technology spending provides the demand floor.
U.S. federal IT spending reached $102.31 billion in FY2025, according to the Federal IT Dashboard. Within that, the federal cloud market is the fastest-growing segment: approximately $17 billion in FY2024, projected to reach $20-21 billion in FY2025, and expected to exceed $30 billion by FY2028, according to the TBR U.S. Federal Cloud Ecosystem Report.
U.S. federal IT spending reached $102.31 billion in FY2025, according to the Federal IT Dashboard, the official government tracking tool that records agency-level technology investment across the full civilian and defence portfolio.
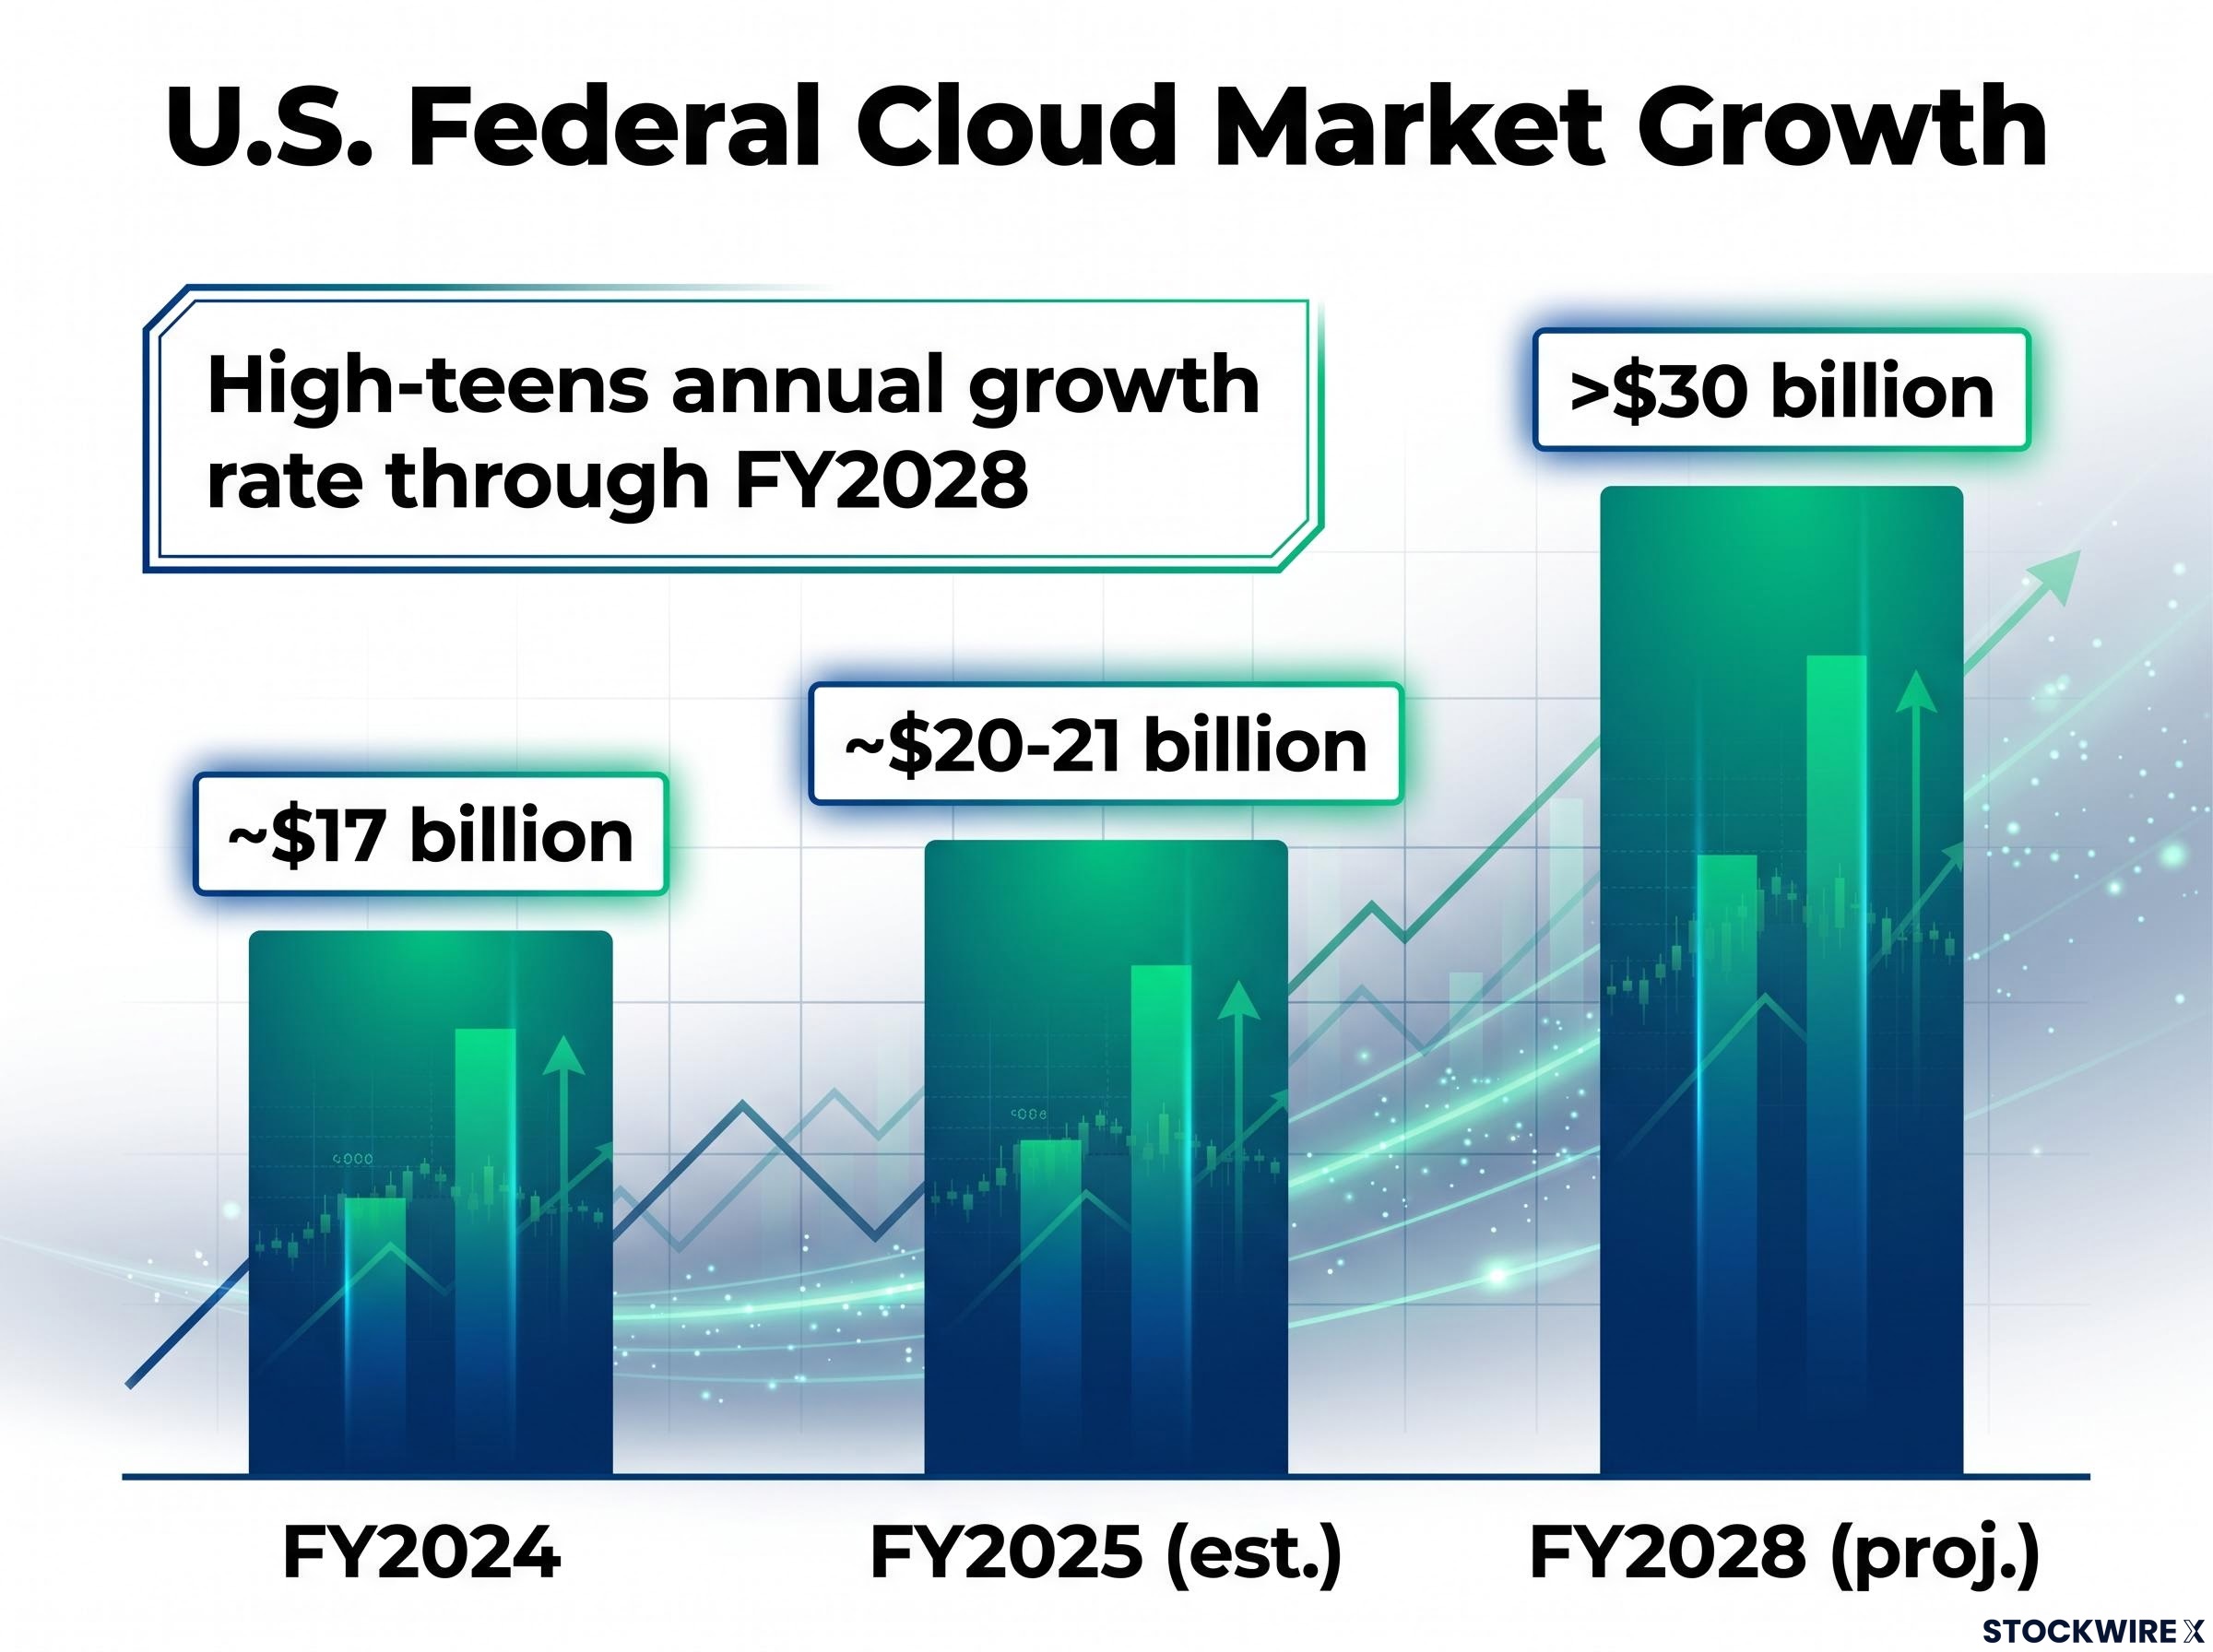
| U.S. federal cloud market | FY2024 | FY2025 (est.) | FY2028 (proj.) |
|---|---|---|---|
| Market size | ~$17 billion | ~$20-21 billion | >$30 billion |
| Implied growth | High-teens annual growth rate through FY2028 | ||
More than half of total U.S. federal IT awards flow to a small group of top vendors. Public-sector procurement is structurally advantageous for incumbents for several reasons:
- Compliance moats: Government contracts require extensive security clearances, data residency compliance, and regulatory certifications that new entrants cannot quickly replicate.
- Incumbent concentration: Once a vendor wins a mission-critical deployment, switching costs are prohibitively high; more than half of federal IT spend stays with established suppliers.
- Mission-critical pricing premiums: Products such as ServiceNow’s government IT service management offerings and Salesforce Government Cloud command sizable premiums over commercial equivalents.
- Long-duration funding: Once programmes are approved and budgeted, they run for years, insulating revenue from short-term economic fluctuations.
State, local, and international: the demand floor extends beyond Washington
State and local governments across the U.S. are actively replacing legacy ERP, asset management, and content systems with modern enterprise platforms. Over $500 billion in federal support is reportedly directed toward state and local digital infrastructure (approximate figure), creating a parallel demand driver that extends well beyond federal agency spending.
Internationally, the UK’s G-Cloud 15 framework is valued at approximately £14 billion over four years (roughly £3 billion annually), explicitly designed to route public-sector workloads into modern cloud and SaaS platforms. The pattern is global, not a U.S. policy-cycle variable.
For you, government exposure is not a nice-to-have when screening software names for inflation-hedge characteristics. It is the demand-floor variable that makes revenue resilience credible across economic cycles, and the concentration of federal spend among incumbent vendors means it doubles as a defensible moat.
What the thesis requires now: selectivity over the basket
The software inflation-hedge mechanism is durable. The government demand floor is funded and growing. The retrospective arc, from bottoming signals through cup-and-handle formation through earnings confirmations, broadly validated the original call.
But the valuation landscape has changed. The sector was inexpensive relative to the broader market when the thesis was first identified. Many quality software names have since re-rated toward historical multiples. The shift is from “buy the basket” to “buy the right names at the right price.”
Sector-wide software selloffs, like the more than 23% average decline in software application stocks through mid-2026, tend to compress multiples indiscriminately, which is precisely when the working capital screen separates structural compounders from names that carry the software label without the underlying mechanics.
Four criteria identify the strongest structural profiles, in priority order:
- Pronounced negative working capital: Large, growing deferred revenue balances; strong prepaid and annual billing; high net retention rates that sustain the working capital tailwind.
- Clear and growing government exposure: Federal, state, local, and international public-sector contracts; presence on procurement frameworks; demonstrated ability to command public-sector pricing premiums.
- Free cash flow operating leverage: Cash generation that meaningfully expands as nominal contract values rise, not just revenue growth that gets consumed by proportional cost increases.
- AI and automation-driven incremental value: Features that drive incremental contract value through new workflow categories, not purely marketing-driven additions. ServiceNow’s hybrid pricing, combining licences with charges tied to workflow volume and AI agent execution, is the leading example.
Enterprise software with negative working capital is inflation-leveraged equity: it participates in nominal growth and compounds real cash flows. Gold and Bitcoin are stores of value and debasement-protection assets. These are complementary portfolio roles, not competing ones.
The macro backdrop remains supportive. Persistent monetary and fiscal expansion continues. Jim Carzan of Kai Wealth and Jamal Chand of Tasty Live have estimated yield curve control could arrive in early to mid-2026, a development that would further support long-duration cash flow compounders by capping the discount-rate headwind that remains the primary risk to valuations.
Yield curve control mechanics matter directly for long-duration cash flow compounders: the gap between informal Treasury buyback operations and a binding rate ceiling determines how much discount-rate relief software valuations can actually bank on in the 2026-2027 window, rather than treating it as a guaranteed tailwind.
But the warning stands: some technology names are taking on substantial leverage, which reduces their inflation-hedge characteristics and introduces the rate sensitivity the negative working capital model is specifically designed to avoid. If a name you hold does not pass the four criteria above, it may carry the software label without the structural advantage.
Whether the thesis still holds depends on which software you own
The negative working capital mechanic is real and durable. Customer prepayments fund operations, inflation lifts nominal contract values faster than costs, and free cash flow compounds disproportionately. That logic does not expire when valuations change.
The government demand floor is measurable and funded. U.S. federal cloud spending is projected to exceed $30 billion by FY2028. State, local, and international modernisation programmes extend the runway further. This is not a cyclical tailwind.
The retrospective arc, from bottoming signals through the cup-and-handle setup through Salesforce’s earnings beat and the subsequent re-rating, broadly confirmed the original thesis. ServiceNow and Salesforce remain the prototypes against which to screen future candidates.
But the margin of safety is thinner now than it was six months before August 2025. That means the quality bar for stock selection is higher and patience on entry matters more. Three variables tell you whether the thesis continues to compound or warrants reassessment:
- New bookings and renewal rates: These sustain or erode the working capital tailwind. Falling bookings shrink deferred revenue and can reverse the prepayment advantage entirely.
- Federal and state IT budget direction: Particularly federal cloud allocations and state and local modernisation funding. The demand floor is only a floor while the budgets remain funded.
- Discount-rate and yield curve control developments: Any movement toward yield curve control (estimated for early to mid-2026) would remove the primary remaining headwind for long-duration cash flow compounders.
Enterprise software with negative working capital is a different asset from the debt-heavy, speculative end of the technology sector. Treating them as the same label is the error that causes investors to either avoid the entire sector out of macro fear or allocate indiscriminately and wonder why half their “software” positions respond to inflation differently from the other half.
The mechanism is sound. The demand floor is funded. The selectivity required is higher. Your job is to own the right ones.
This article is for informational purposes only and should not be considered financial advice. Investors should conduct their own research and consult with financial professionals before making investment decisions. Past performance does not guarantee future results. Financial projections referenced are subject to market conditions and various risk factors.