
A stock trading at its lowest price-to-earnings multiple in five years can look like exactly the opportunity you have been waiting for. The valuation screens flag it, the dividend yield spikes, and every instinct says the market has overreacted. Then the next earnings report lands, estimates get slashed, and the stock you bought at “cheap” gaps lower again.
That pattern has a name, and right now it has specific addresses. Bank of America’s latest sector analysis, dated 31 August 2026, identifies media and IT services as sectors where prices are falling faster than earnings estimates are being cut, the precise signature that historically precedes a sharp credit-driven deterioration. At the same time, BofA sees genuine value in energy, materials, and financials, which means the discipline of telling the two apart has real portfolio stakes today.
Here is a practical framework for reading the signals BofA is using, built so you can apply the same logic to any beaten-up stock before you commit capital. You will leave with a six-question checklist, a clear picture of the credit cycle mechanics that make value traps invisible until it is too late, and the specific sector characteristics that separate a genuine bargain from a falling knife.
What makes a stock look cheap but actually be dangerous
A value trap is not just a stock that keeps falling. It is a stock whose apparent cheapness comes from earnings and balance-sheet deterioration that analysts have not fully recognised yet, rather than from a temporary sentiment dislocation that will reverse.
The value investing metrics most commonly used in screeners, including P/E, price-to-book, and free cash flow yield, are calibrated against historical earnings that may no longer represent the business’s earning power when structural damage is already underway.
The core diagnostic BofA uses right now is the gap between how far a stock’s price has fallen and how much consensus earnings-per-share (EPS) estimates have actually been revised down. EPS is the portion of a company’s profit allocated to each outstanding share, and it is the number that drives most valuation metrics. When prices drop sharply while consensus EPS is only modestly revised down, the market is pricing in more bad news than the analyst community has yet acknowledged.
That asymmetry is where the trap closes. If you see a stock down 30% but EPS estimates cut only 8%, the market is telling you the revisions have not caught up to reality. Buying in front of that catch-up is precisely how value traps cause damage.
BofA’s post-2025 work shows this pattern playing out clearly across sectors:
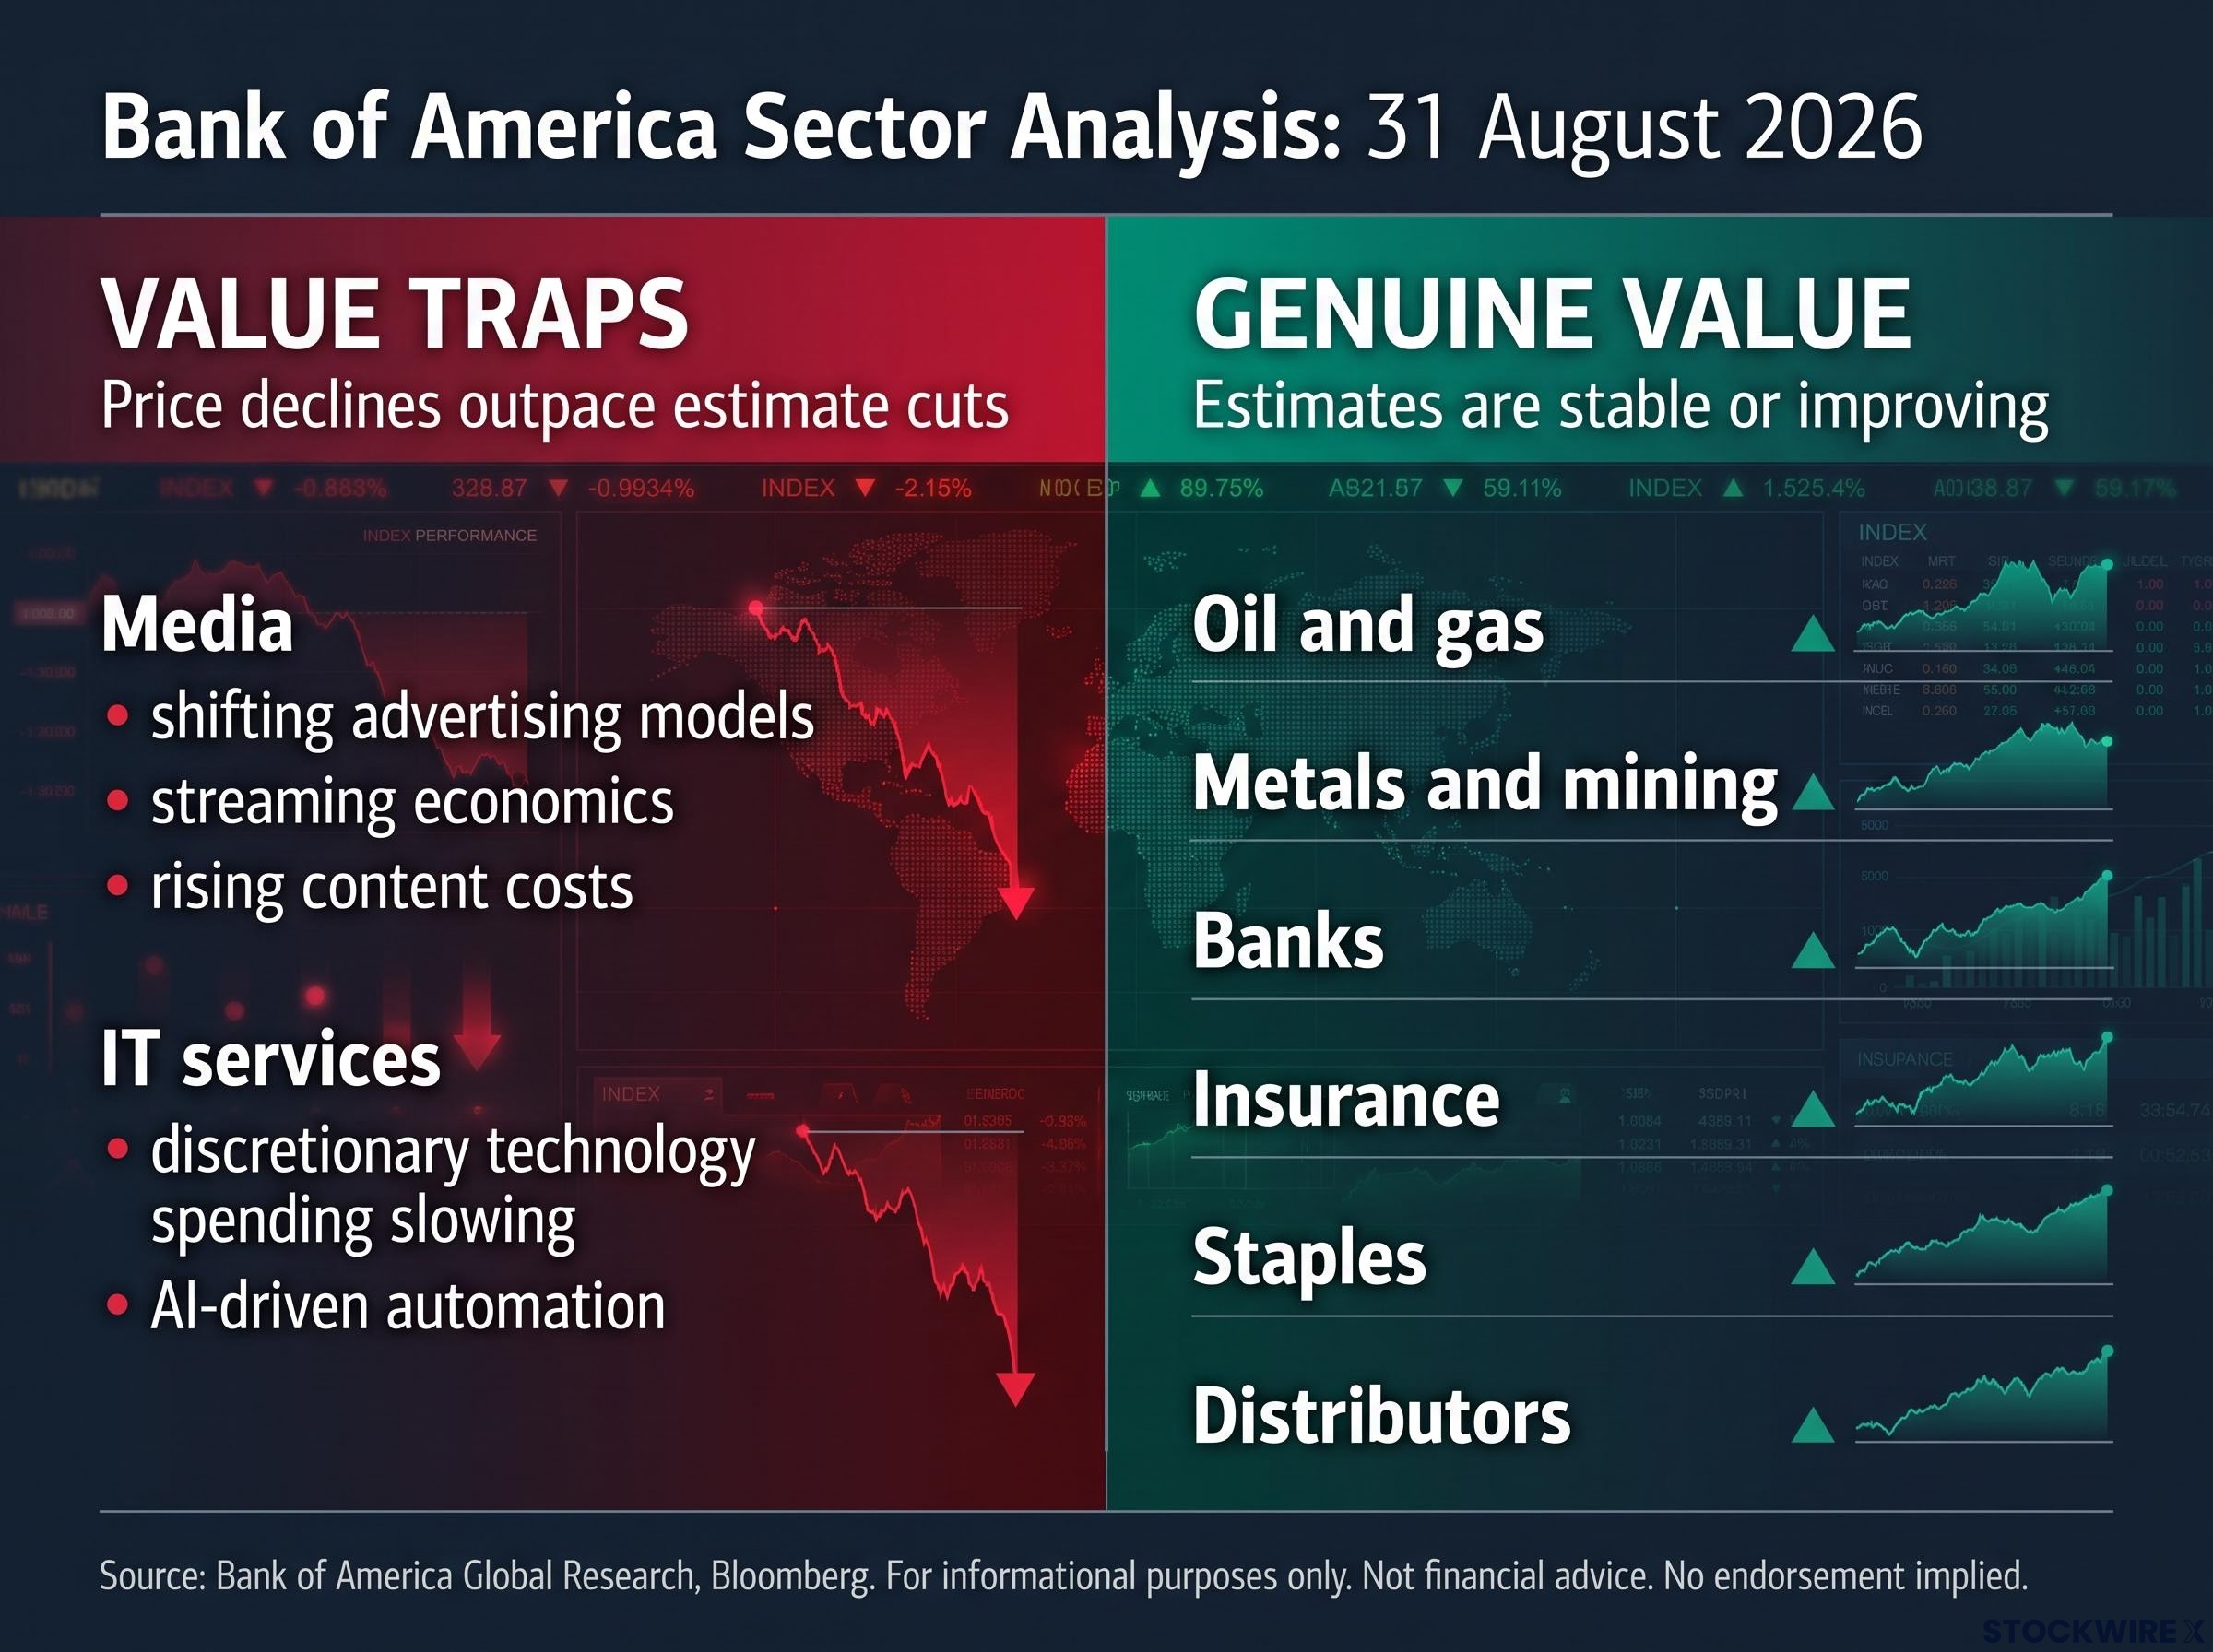
- Where price declines outpace estimate cuts (value-trap territory): Media and IT services, where the rate at which share prices are declining has not been matched by corresponding reductions in earnings forecasts, suggesting analysts have yet to recognise the full scale of the deterioration ahead.
- Where estimates are stable or improving (genuine value territory): Energy, materials, and financials, where the earnings trajectory supports the lower price or where estimates are actually being revised upward.
BofA’s core framing: Cheap equity with deteriorating earnings estimates often signals the market is anticipating more bad news than analysts have recognised. The price-versus-estimate gap is the first and most accessible screen for distinguishing genuine value from a value trap.
The practical power of this diagnostic is that you can check it yourself. Any free financial data platform shows you both price history and consensus estimate revisions. Once you understand what the gap between them means, every screener result reads differently.
When big ASX news breaks, our subscribers know first
Why credit cycles turn value traps invisible until it is too late
Credit cycles have a timing problem that works against value investors. The damage does not arrive on a schedule you can plan around. It arrives in two phases, and the first phase is specifically designed to feel manageable.
BofA’s broader credit research reveals a pattern that has repeated across every significant credit stress episode since the 1990s:
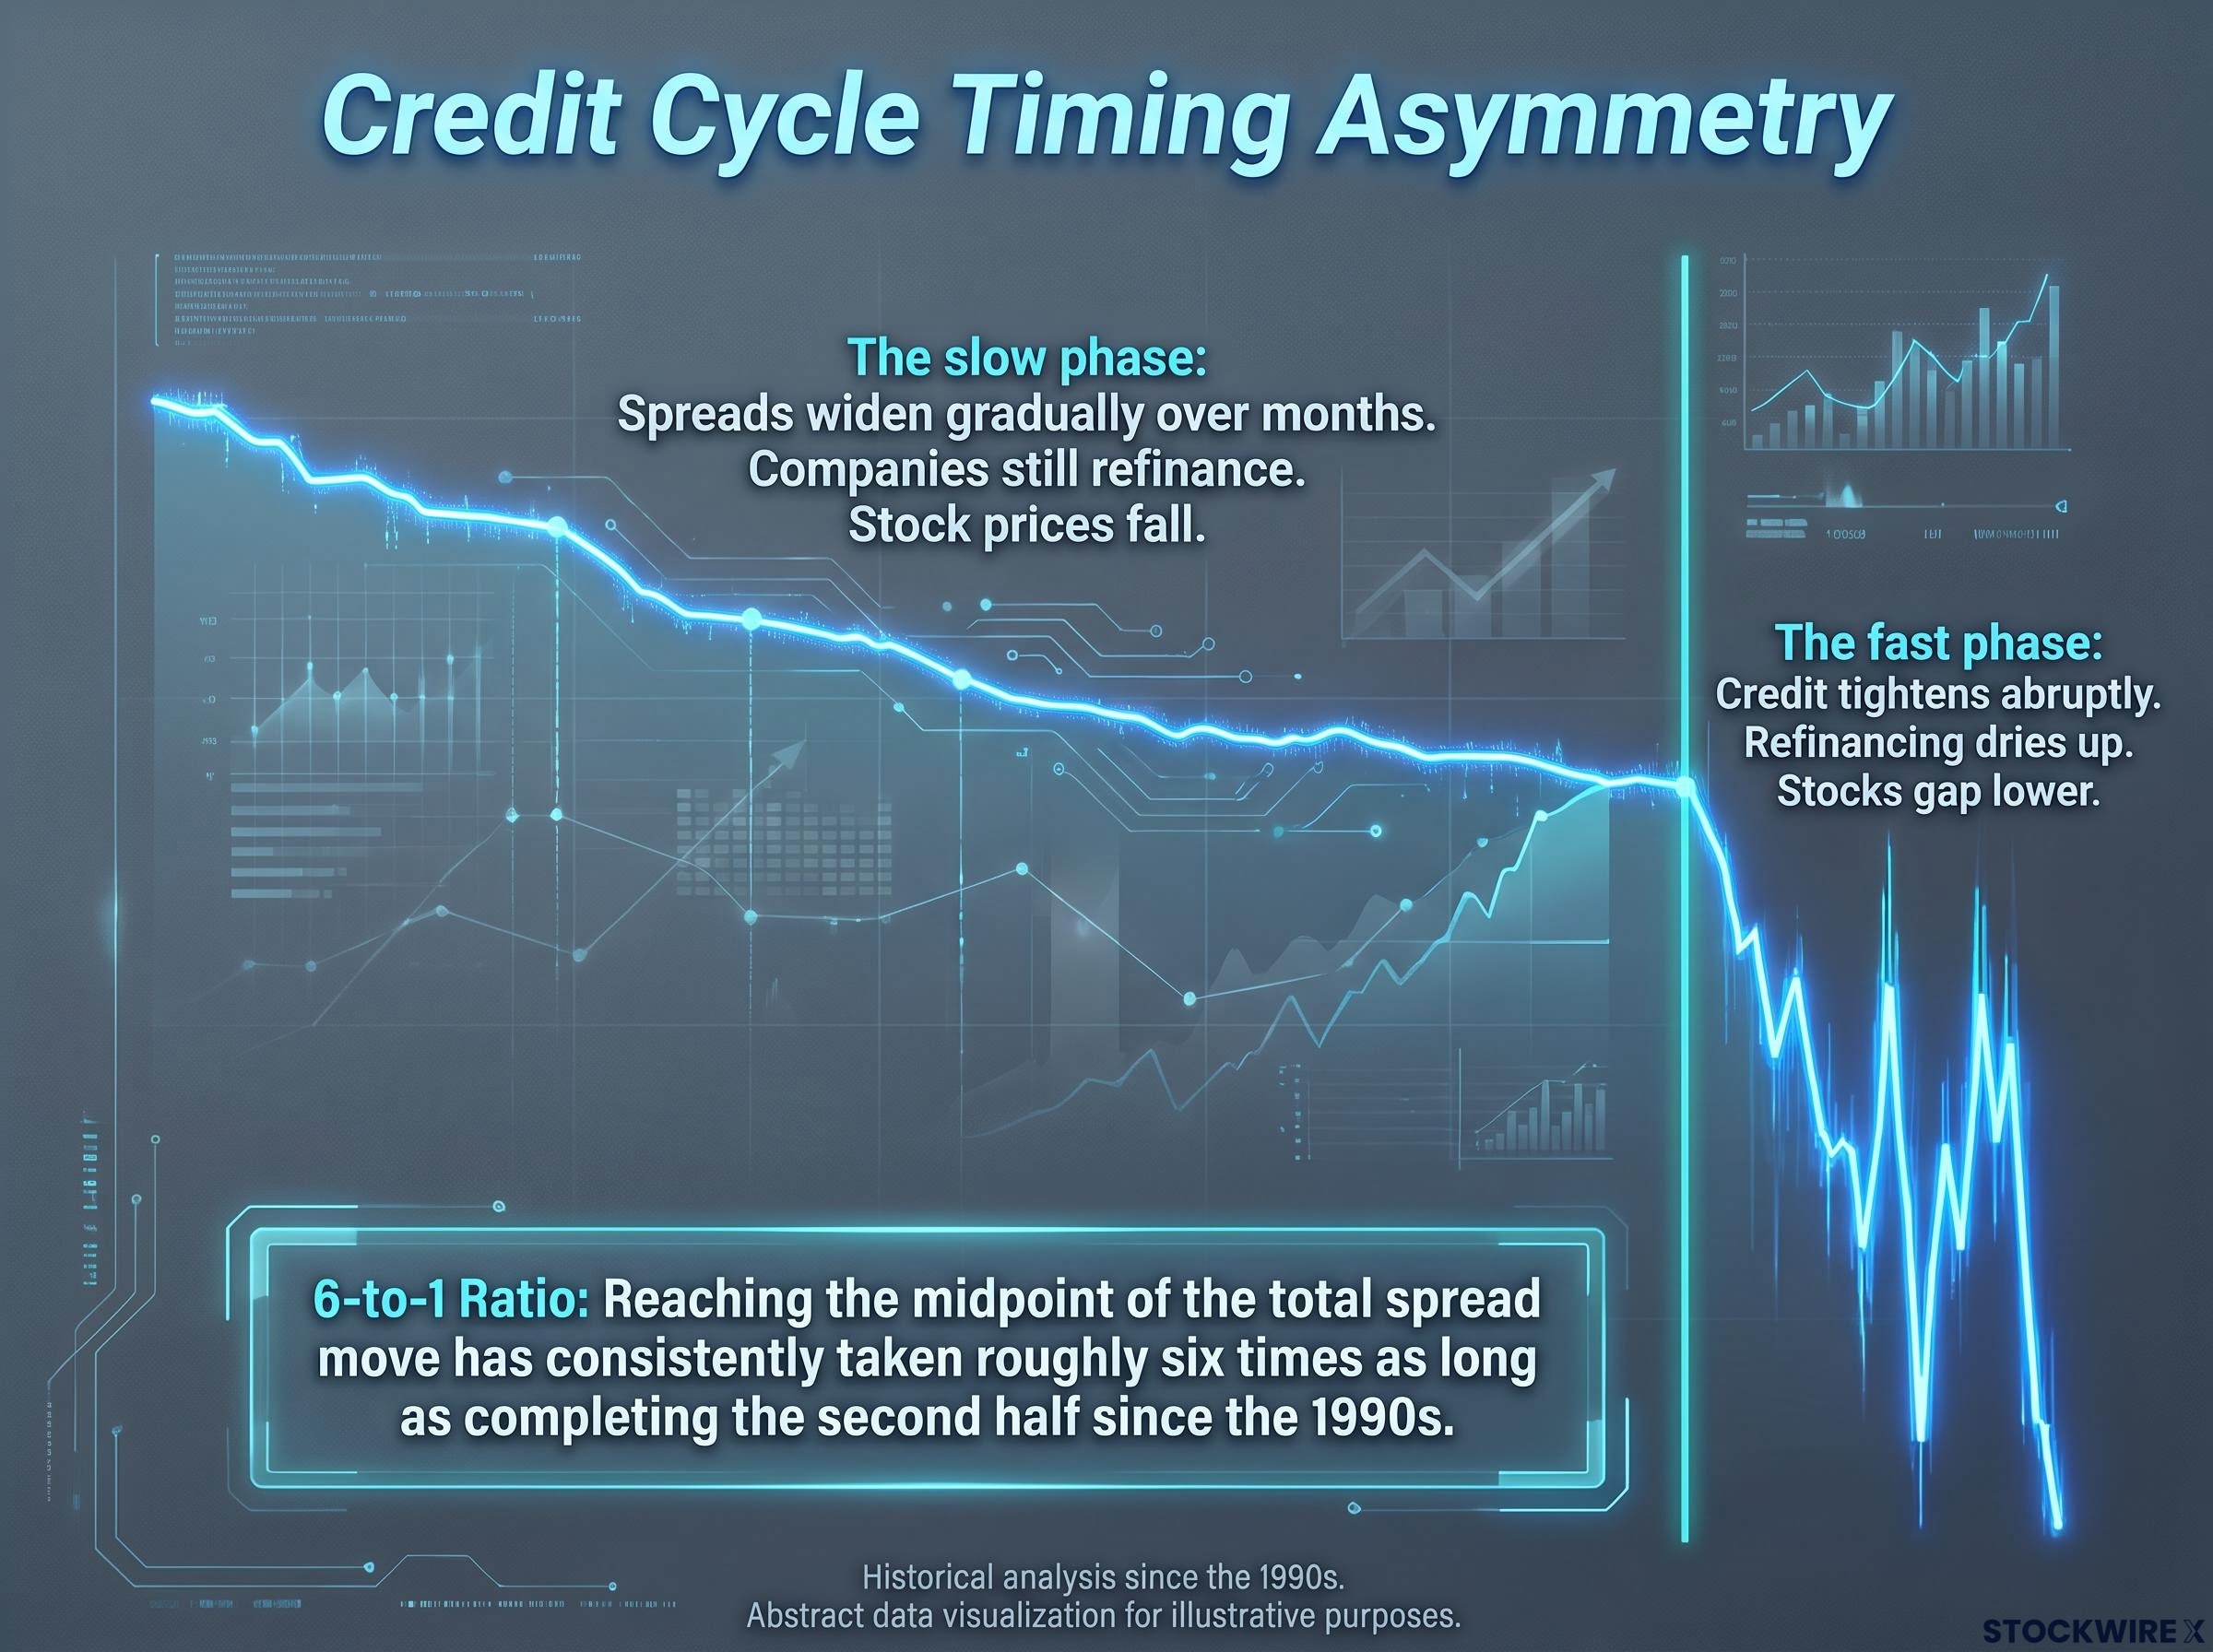
- The slow phase: Credit spreads (the premium lenders charge risky borrowers above safe government bonds) widen gradually over months. Companies still refinance. Earnings estimates drift lower but do not collapse. Stock prices fall, and to a value investor, the decline looks like an opportunity.
- The fast phase: Credit tightens abruptly. Refinancing dries up. Estimates are slashed in quick succession. The stocks that looked cheap in the slow phase gap lower again, and the value trap is fully revealed.
The timing asymmetry: BofA’s analysis of major credit stress episodes going back to the 1990s reveals that reaching the midpoint of the total spread move has consistently taken roughly six times as long as completing the second half. Most of the damage arrives in a compressed window at the end of the cycle.
Current credit deterioration is not evenly distributed across sectors; leveraged loan default rates reached 2.73% in Q1 2026 and Fitch projects 4.5-5.0% for the full year, a trajectory that maps directly onto the slow-phase widening BofA describes as the deceptive on-ramp before sharper stress arrives.
That six-to-one ratio is what makes the slow phase so dangerous. If credit spreads in a sector have been widening for several months and nothing has broken yet, your instinct says the worst may be over. BofA’s data says you are likely still in the deceptive first phase, not past the danger.
How this pattern plays out in media and IT services today
The sectors BofA flagged in its 31 August 2026 update fit this two-phase template precisely.
Media companies carry meaningful leverage, and they face structural pressure from shifting advertising models, streaming economics, and rising content costs. These are not cyclical headwinds that reverse when GDP recovers. They are business-model pressures that deepen the earnings trough and extend it beyond what cyclical value screens anticipate. When credit tightens in the fast phase, media companies face spiking refinancing costs at the same moment their earnings are still deteriorating.
IT services firms face a different but equally corrosive combination. Discretionary technology spending is slowing, and AI-driven automation is compressing margins and reducing billable work. Near-term earnings can still look acceptable, which is exactly what makes the structural trajectory so easy to miss on a standard screen. The revenue line holds while the margin structure quietly erodes underneath it.
Both sectors sit at the intersection of cyclical and structural pressure simultaneously, and that combination is what makes them especially dangerous. The earnings floor is lower than it appears on current screens, and the credit cycle’s fast phase has not yet arrived to reveal it.
The six-question checklist for separating genuine value from a falling knife
The diagnostic principles above translate into a concrete set of checks you can run on any screener result this week. These six questions are drawn from BofA’s analytical framework, and each one points to specific, publicly available data rather than requiring proprietary research access.
- Has the price fallen further than EPS estimates have been cut? If the stock is down significantly more than consensus estimates, the market is pricing in revisions that analysts have not yet made. That asymmetry is BofA’s primary value-trap signal.
- What does the balance sheet look like? Check debt-to-EBITDA (a company’s total debt relative to its earnings before interest, taxes, depreciation, and amortisation), interest coverage, and near-term debt maturities. Cheap equity with weakening coverage often means creditors are already nervous, and equity screens alone will not show you that.
- Is this a cyclical problem or a structural one? A macro slowdown can reverse. Technology disruption, regulatory change, or a broken business model usually does not. Structural problems mean the earnings trough is deeper and longer than any near-term screen assumes.
- Where are credit spreads in their cycle? Track high-yield spreads and bank lending standards, both publicly available. Slow, steady widening is not harmless; it is often the long on-ramp before the sharp deterioration phase where value traps reveal themselves.
- Is the sector under-owned or crowded? BofA finds that value factors and sectors like financials, energy, and materials remain under-owned despite decent performance. Under-owned sectors with stable fundamentals represent a different risk profile than crowded sectors with deteriorating ones.
- What does the revision trend and management guidance history show? Multiple quarters of negative revisions combined with repeatedly missed guidance is a strong value-trap signal, particularly in leveraged or structurally challenged industries.
The Federal Reserve Senior Loan Officer Survey publishes quarterly data on bank lending standards and credit availability, giving you a publicly accessible benchmark for tracking whether tightening conditions are entering the slow phase or accelerating toward the sharp deterioration window the credit cycle framework describes.
Running all six checks, rather than stopping at the first two, is what separates a disciplined value screen from a rationalisation. Cheap stocks almost always pass one or two of these tests. Genuine value tends to pass most of them.
| Check | What you are testing | Warning signal | Clean answer |
|---|---|---|---|
| Price vs. estimate gap | Whether the market knows something analysts have not yet priced in | Price down 30%, estimates cut only 8% | Estimates have fallen in line with or more than price |
| Balance sheet health | Whether creditors are already under stress | Rising debt/EBITDA, shrinking interest coverage, near-term maturities | Stable or improving coverage ratios, manageable maturity schedule |
| Cyclical vs. structural | Whether the problem reverses with the macro cycle | Technology disruption, broken business model, regulatory change | Macro-driven slowdown with intact competitive position |
| Credit spread position | Where the sector sits in the credit deterioration timeline | Spreads widening slowly for months with no resolution | Spreads stable or tightening, lending conditions easing |
| Sector positioning | Whether capital is crowded or light in the sector | Heavy institutional ownership in a deteriorating sector | Under-owned sector with stable or improving fundamentals |
| Revision and guidance trend | Whether management is consistently missing its own targets | Multiple quarters of negative revisions plus missed guidance | Estimates stable or rising, guidance being met or exceeded |
Where BofA actually finds genuine value right now, and what these sectors share
The checklist is not just a tool for avoiding mistakes. It also tells you where to look when the answers come back clean. BofA’s explicitly preferred sectors for 2026 pass the framework on multiple dimensions simultaneously, and understanding why they pass is as useful as understanding why media and IT services fail.
| BofA preferred sector | Why fundamentals are holding | What makes it different from a value trap |
|---|---|---|
| Oil and gas | Capital discipline, supportive commodity pricing, investor rotation from gold to energy | Estimates stable or improving; balance sheets strengthened by years of discipline |
| Metals and mining | Manufacturing demand, infrastructure spending, multi-year commodity cycle | Structural demand tailwind, not reliant on cheap capital or speculative growth |
| Banks | Higher-for-longer rates supporting net interest margins | Earnings trajectory matches macro regime; estimates being revised up, not down |
| Insurance | Higher investment yields, disciplined underwriting cycles | Fundamentals improve in the current rate environment rather than deteriorating |
| Staples | Defensive earnings, pricing power, portfolio stability in volatile markets | Low cyclical exposure; earnings do not depend on credit conditions easing |
| Distributors | Volume-driven earnings linked to real economic activity | Business model benefits from manufacturing and infrastructure investment cycles |
The common thread across all six sectors is that their fundamentals match the current macro regime: higher rates, sustained commodity demand, and manufacturing investment. None of them rely on cheap capital or speculative growth to justify their valuations.
Savita Subramanian, BofA’s Head of U.S. Equity and Quantitative Strategy, has framed the thesis bluntly: “If you build stuff you need the widgets.” Industrials, energy, and materials are areas that can perform well for several years, not just the next quarter.
What makes the opportunity particularly interesting is that these sectors remain under-owned despite decent performance. That means the value is not just in the earnings trajectory but also in the positioning catch-up that has not yet happened. When institutional capital eventually rotates back toward these areas, the combination of solid fundamentals and light positioning creates a more durable setup than a simple low-multiple screen would suggest.
Sector rotation signals from institutional capital flows often precede official economic data confirmation by weeks or months, which means the under-owned positioning BofA identifies in energy, materials, and financials can be tracked in real time through Relative Rotation Graphs and fund flow data before it shows up in consensus revisions.
What distinguishes cyclical from structural problems, and why it changes everything
Of all six checklist items, the cyclical-versus-structural classification is the one where most investors get the answer wrong. It is also the one that determines everything else: the depth of the earnings trough, how long the trough lasts, and whether the stock you are buying will actually recover.
Cyclical problems are driven by the broader economy: recessions, inventory cycles, temporary demand slowdowns. They are mean-reverting. When GDP recovers, the company’s earnings typically recover with it, and a low multiple during the trough can represent genuine value.
Structural problems are different in kind, not just degree. They arise from technology disruption, regulatory change, or a permanently broken business model. They do not reverse when the macro cycle turns. The earnings trough is deeper, lasts longer, and may not have a recovery at all in the traditional sense.
The danger is that structural damage is specifically designed to look cyclical while it is still early. Revenue declines feel temporary. Management frames the problem as macro-driven. Near-term screens still show earnings that look acceptable. By the time the structural nature of the problem becomes obvious, the stock has fallen well past the point where a value investor bought in.
Cyclical versus defensive allocation decisions are made harder by the fact that structural damage routinely masquerades as cyclical weakness during the slow credit phase, causing investors to apply a recovery-oriented portfolio tilt to businesses whose earnings will not revert when the macro cycle turns.
Cyclical problem characteristics:
- Driven by macro conditions (GDP, interest rates, inventory cycles)
- Typical duration: one to three years
- Screens handle them well because earnings revert to prior levels
Structural problem characteristics:
- Driven by technology disruption, regulatory shifts, or business model erosion
- Duration: indefinite, often permanent margin compression
- Screens misread them because they project historical earnings forward into a market that no longer supports those levels
Applying the distinction to media and IT services
In media, the pressures are structural across multiple fronts. Advertising model disruption is not cyclical; the shift from linear to digital advertising is permanent. Streaming economics are structural; the cost of content acquisition and production does not decline when GDP recovers. Rising content costs compound both pressures. None of these reverse on their own when the macro cycle turns.
In IT services, AI-driven automation is reducing the volume of billable work, and that margin compression is structural. The firms most exposed are not facing a temporary spending pause from clients; they are facing a permanent reduction in the human labour hours required to deliver the same output. Near-term earnings can still look acceptable while this trajectory erodes the business underneath.
If you cannot confidently answer whether a company’s problems will still exist when the macro cycle turns, you do not yet have enough information to treat its low multiple as a margin of safety. And when a stock fails the structural test, the next check should immediately be the balance sheet: structural problems combined with leverage is the most reliable recipe for a value trap.
Making the call: applying this framework before the next screener result tempts you
The full framework distils into a decision sequence you can run before committing capital to any beaten-up stock or sector:
- Check the price-versus-estimate gap first. If the price has fallen far more than estimates, the analyst community has not caught up. You are buying in front of revisions, not after them.
- Run the balance sheet before the income statement. Debt-to-EBITDA, interest coverage, and near-term maturities tell you whether creditors are already nervous. Equity screens alone will not surface this.
- Classify the problem as cyclical or structural. If the headwinds are driven by technology disruption or business model erosion rather than macro conditions, the earnings trough will be deeper and longer than any near-term screen assumes.
- Check where credit spreads are in their cycle. If spreads have been widening slowly and nothing has broken yet, BofA’s data says you are likely in the deceptive slow phase, not past the danger.
BofA’s current sector preferences, energy, materials, and financials, pass this framework. Media and IT services fail it on multiple dimensions simultaneously. That contrast is not a coincidence; it is the framework working.
The discipline here is not about eliminating risk. It is about distinguishing between stocks that are cheap for a reason that can reverse and stocks that are cheap because the bad news has not finished arriving yet. The difference often comes down to whether you checked the balance sheet and the estimate revision trend before you checked the price-to-earnings ratio, not after.
BofA’s core message: Not every low multiple is a bargain. The price-versus-estimate gap is the first and most accessible screen for any investor who wants to tell the difference.
This article is for informational purposes only and should not be considered financial advice. Investors should conduct their own research and consult with financial professionals before making investment decisions.
The discipline that protects you in the next credit cycle, not just this one
The framework above is grounded in BofA’s August 2026 analysis, but the principles behind it are not specific to this moment. The six-to-one timing asymmetry in credit deterioration will recur in future cycles. The pattern of structural damage disguised as cyclical weakness will recur. The temptation to buy a stock that screens cheap on trailing metrics will recur.
The investors who get hurt by value traps are not the careless ones. They are the ones who applied one or two of these checks but not all of them, and the credit cycle punished the gap. A stock can pass the price screen, look reasonable on near-term earnings, and still be a value trap because the balance sheet and the structural classification told a different story that nobody checked.
Genuine value does not require you to sit on the sidelines. It requires you to know which cheap stocks are cheap for the right reasons. Right now, BofA’s preferred sectors, energy, materials, financials, staples, and distributors, offer exactly that: stable or improving earnings trajectories, manageable balance sheets, and business models that benefit from current conditions rather than fighting against them.
A positioning signal worth watching: BofA notes that value factors and sectors like financials, energy, and materials remain under-owned despite decent performance. For disciplined investors, that gap between fundamentals and positioning is where the genuine opportunity sits.
The framework combines price-versus-estimate analysis, balance-sheet review, structural problem classification, and credit cycle awareness into a single integrated screen. Apply it once and it clarifies a single stock decision. Apply it consistently and it becomes the discipline that protects your portfolio across credit cycles, not just the one we are in now.
Past performance does not guarantee future results. Financial projections are subject to market conditions and various risk factors.