
Dividend investing is often framed as a concession, something you settle for when growth stocks stop cooperating. The long-run data tells a different story. Over the 35-year backtested period since late 1989, the S&P 500 Dividend Aristocrats outperformed the broader index by approximately 1.6 percentage points per year, according to S&P Global research. In any single calendar year, that gap barely registers. Over three decades, it reshapes outcomes.
The tension is real, though. Index investing has an overwhelming body of evidence behind it: low fees, broad diversification, and the difficulty most active strategies face in sustaining an edge after costs. Yet a quality-filtered subset of the S&P 500, one that simply requires 25 consecutive years of annual dividend increases, has quietly matched or beaten the index across multiple decades, multiple crises, and multiple market regimes. The question is not whether dividend growth investing feels outdated. It is whether the mechanics underneath it justify a deliberate allocation choice.
Here is an honest reckoning with that data: where the strategy earns its edge, where it falls short, what drives the compounding advantage, and what it all means if you are weighing an Aristocrat allocation against a total-market index fund.
What three decades of data actually show about dividend aristocrat returns
The performance case for Dividend Aristocrats does not rest on a single blockbuster period. It rests on small edges that repeat across different market environments, and the consistency is what makes the record worth examining closely.
Start with the broadest window. S&P Global’s research covering the full 35-year backtested history (from December 1989 through to present) shows the Aristocrats outperforming the S&P 500 by roughly 1.6 percentage points per year on average. That period includes the dot-com bust, the 2008 financial crisis, and the post-pandemic recovery, so the result is not anchored to any single favourable decade.
Key finding: Over the 35-year S&P Global study period, Dividend Aristocrats outperformed the S&P 500 by approximately 1.6 percentage points per year, a margin that compounds to a materially different portfolio outcome over long horizons.
Narrow the window and the edge persists, though it compresses. From 2003 to 2021, Aristocrats returned 12.4% annualised versus 11.5% for the S&P 500, a gap of roughly 0.9 percentage points per year. Over the 20-year live period since the index launched on 2 May 2005, Aristocrats delivered 10.23% annualised with volatility of 14.34% and a dividend yield of 2.54%, compared to 1.89% for the broader index.
The data also pushes back in places. One 10-year analysis (flagged as single-source and unverified) reports Aristocrats at 13.68% versus the S&P 500 at 13.88%, essentially a dead heat with a slight lag. That matters, because it confirms the edge is real but not universal across all time windows.
| Period | Aristocrats Annualised | S&P 500 Annualised | Key Observation |
|---|---|---|---|
| 35-year backtested (since 1989) | ~1.6%/yr outperformance | Baseline | Covers dot-com bust and 2008 crisis |
| 2003-2021 | 12.4% | 11.5% | ~0.9%/yr excess, modest but persistent |
| 20-year live (since 2005) | 10.23% | Closely aligned | Lower volatility, higher yield |
| One 10-year window (unverified) | 13.68% | 13.88% | Essentially equal returns |
What this tells you is that the Aristocrat edge is not about dramatic outperformance in any given year. A 0.9-to-1.6 percentage point annual margin does not make headlines. But it is the kind of persistent, repeatable gap that, compounded over 20 to 35 years, produces meaningfully different portfolio outcomes. The comparison to index investing is less about which number is bigger in a single period and more about whether the edge is reliable enough to justify the allocation.
When big ASX news breaks, our subscribers know first
Why bear markets are where the strategy earns its reputation
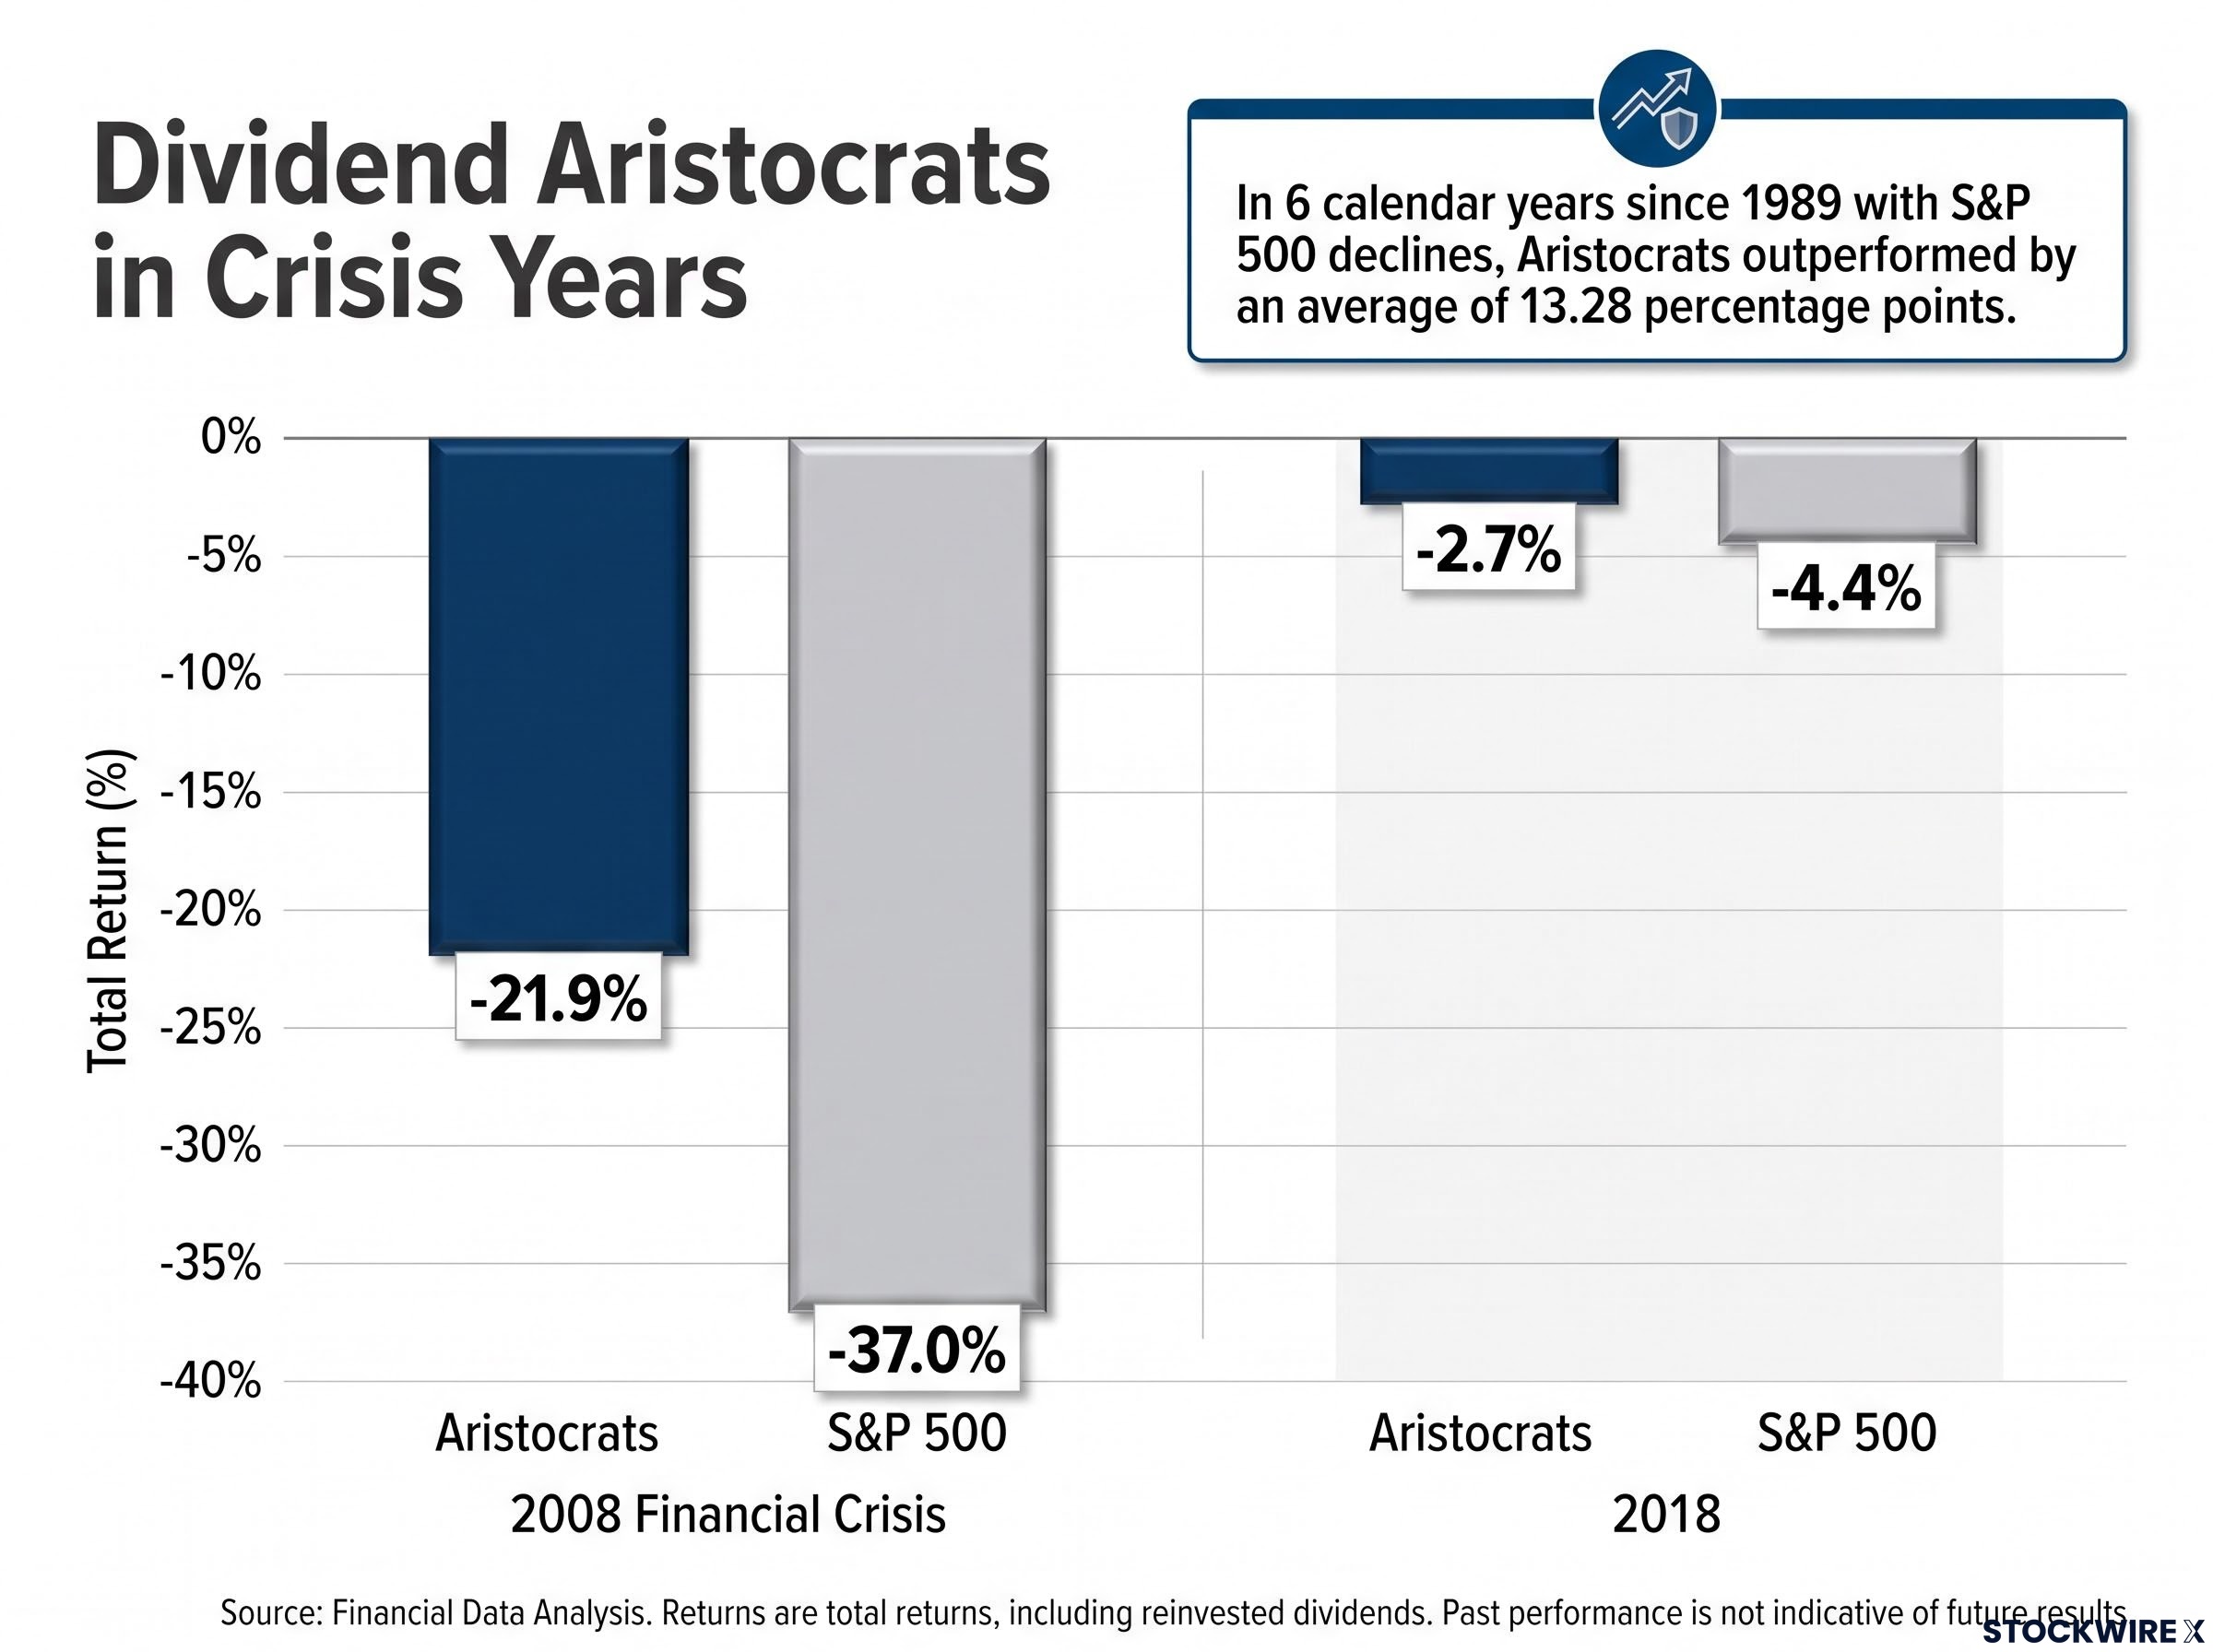
In all six calendar years since 1989 when the S&P 500 posted negative total returns, the Dividend Aristocrats outperformed. Not in five of six, or four of six. All six. The average margin was 13.28 percentage points, and in three of those years, Aristocrats delivered positive total returns while the broad market fell.
Standout figure: In the six calendar years when the S&P 500 declined, Dividend Aristocrats outperformed by an average of 13.28 percentage points, returning positive in three of those years.
The monthly data reinforces the pattern and reveals an asymmetry worth noting. Across all months since 1989, Aristocrats beat the S&P 500 in 53% of them, by an average margin of 0.16%. Not exactly commanding. But filter for down months only, and the hit rate jumps above 70%, with an average outperformance of 1.13%. In months where the S&P 500 fell 5% or more, Aristocrats’ average excess return was 2.46%, with an 81% hit rate.
The crisis-level data puts a finer point on it:
- 2008 financial crisis: Aristocrats returned -21.9% versus the S&P 500’s -37.0%
- 2018: Aristocrats returned -2.7% versus the S&P 500’s -4.4%
Why earnings durability drives the downside edge
The 25-consecutive-year dividend increase requirement functions as a quality screen, whether investors think of it that way or not. A company that has raised its dividend every year for a quarter-century, through recessions, credit crunches, and sector upheavals, has earnings and cash flows that are demonstrably more resilient than the average S&P 500 constituent.
The Dividend Kings threshold, which requires 50 consecutive years of unbroken payout growth with no index-membership constraint, represents a structurally different order of corporate endurance than the Aristocrat qualification, and companies meeting it have by definition survived two full generations of economic cycles.
That quality filter is the structural source of the downside protection documented in the data. It is not a coincidence that these companies fall less in bear markets; it is a direct consequence of the business characteristics required to sustain unbroken dividend growth. The 2008 comparison is not a historical curiosity. A portfolio that fell 21.9% rather than 37.0% required a far shorter recovery period, and that gap in recovery time had a direct compounding effect on returns over the following decade.
Bear market recovery timelines across U.S. history have ranged from under six months to roughly 25 years depending on the cause, which is why a portfolio that fell 21.9% in 2008 rather than 37.0% did not simply experience less pain but compounded into a materially different position over the following decade.
How compounding and rebalancing quietly amplify long-term outcomes
The long-run performance numbers are the output. The compounding and rebalancing mechanics are what produce them. Most discussion of dividend growth strategies focuses on yield and stock selection. The less visible forces are equally important.
Warren Buffett has credited compound interest as the foundation of his wealth, and he has used the image of a snowball gathering mass as it rolls downhill to illustrate how reinvestment builds on itself over time. A Dividend Aristocrat portfolio captures that same logic, but with three distinct layers of accumulation working simultaneously.
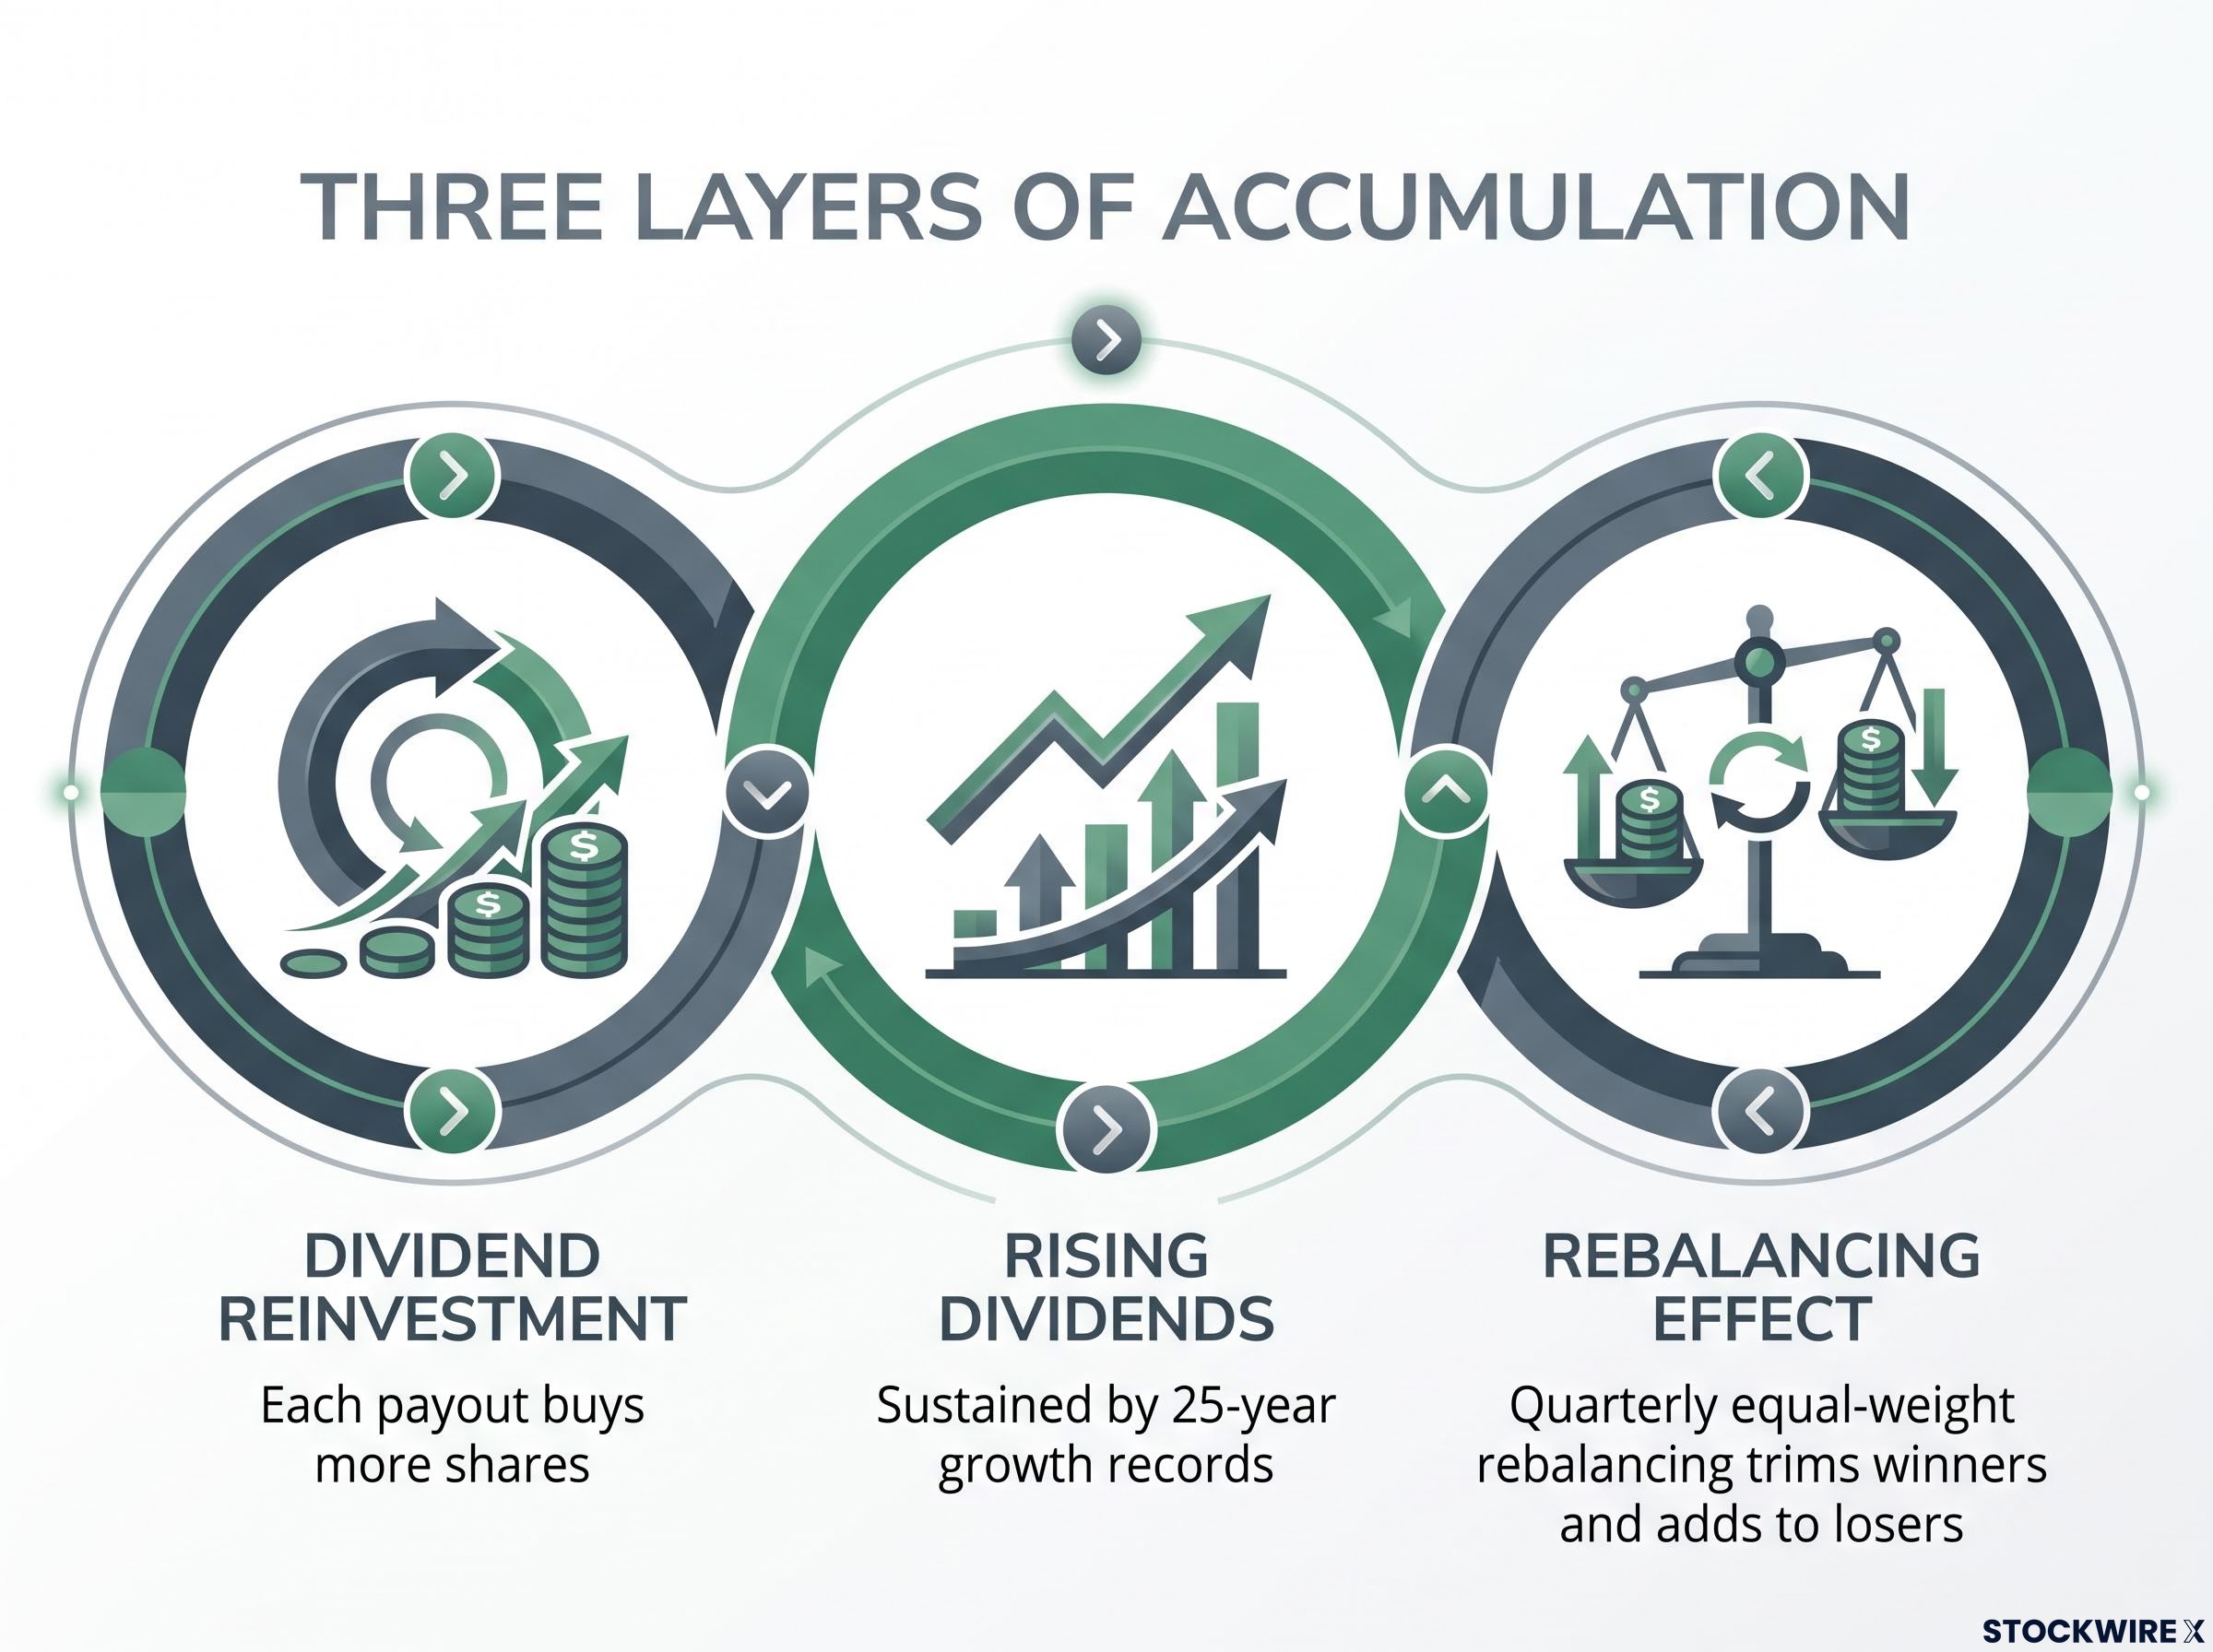
A Dividend Aristocrat portfolio with reinvestment and rebalancing benefits from three reinforcing mechanisms:
- Dividend reinvestment: Each payout buys more shares, expanding the base on which future dividends are paid
- Rising dividends per share: Companies with 25-year (or longer) growth records tend to keep increasing payouts, so the income on each share grows over time
- Rebalancing effect: The index’s quarterly equal-weight rebalancing systematically trims positions that have risen and adds to positions that have fallen, enforcing a buy-low discipline that most individual investors struggle to maintain on their own
Research from Research Affiliates shows that in value portfolios emphasising high dividend yields, periodic rebalancing into higher-yield positions boosts dividend income growth relative to a static buy-and-hold approach. A separate body of commissioned research covering a 23-year observation period found that applying a continuous rebalancing discipline to a dividend-oriented portfolio produced materially stronger outcomes than leaving the portfolio static.
The S&P 500 Dividend Aristocrats index is equal-weighted and rebalanced quarterly, which means investors using an ETF implementation get this discipline automatically. That is not just a methodological detail. It is the mechanism that systematically forces the portfolio to buy more of what has become cheaper and trim what has become expensive, and it is one of the reasons the long-run compounding numbers look the way they do.
The time dimension matters here. Compounding is gradual early and accelerates late, which is why the 35-year backtested window produces more compelling results than any 10-year snapshot. For investors with 20 or more years of runway, the interaction of these three forces is where the strategy’s value proposition lives.
The 2.54% yield that Aristocrats delivered over the 20-year live period looks straightforward, but dividend yield mechanics are more nuanced than they appear: ex-dividend price adjustments mean distributions transfer value rather than create it, which is why the compounding advantage comes from reinvestment rather than the payout itself.
Where the strategy underperforms and what that tells investors about regime risk
The same characteristics that protect during downturns create a structural weakness during growth-led bull markets. This is not a flaw in the strategy. It is the other side of the same coin.
Dividend Aristocrats tend to lag when high-multiple technology stocks dominate returns. The reason is straightforward: few technology companies have 25-year dividend increase histories, so the Aristocrat index systematically underweights the sector that drives returns in speculative bull markets. The quality and income filter that protects in downturns makes the portfolio structurally less exposed to the highest near-term price momentum during expansions.
The conditions under which Aristocrats typically lag:
- Speculative bull markets led by high-growth, low-yield companies
- Technology-driven expansions where earnings multiples expand rapidly
- Low-volatility environments where defensive quality is not rewarded
The 10-year window showing near-parity (13.68% versus 13.88%, flagged as single-source and unverified) illustrates the point. The strategy is not a consistent outperformer in every regime. If most of the documented long-run outperformance is concentrated in crisis years and down markets, then an investor entering during a prolonged technology-driven bull market needs to hold a realistic expectation of relative lag during that cycle before the structural advantages re-emerge.
Keeping the edge intact: costs, vehicles, and time horizon
The documented edge is incremental, 0.9 to 1.6 percentage points per year in most windows, and that makes it fee-sensitive. A high-cost implementation erodes the margin meaningfully. ETF vehicles such as NOBL, a widely used Dividend Aristocrats fund, keep fees low enough to preserve the edge, and the quarterly equal-weight rebalancing is built into the structure.
The time horizon requirement is equally important. The strongest evidence comes from 20-to-35-year windows. Investors with shorter horizons may encounter the strategy in an unfavourable regime and not have enough time for the structural advantages to reassert. The clearest risk to an Aristocrat allocation is not a permanent structural failure but a decade-long growth cycle where the defensive tilt becomes a performance drag. Investors who anticipate that possibility are better positioned to hold through it rather than capitulating at exactly the wrong moment.
What the long-run record actually says for investors comparing income and index strategies
Four threads run through the evidence, and they point in the same direction:
- Return profile: Small but persistent long-run excess returns of 0.9 to 1.6 percentage points per year in most multi-decade windows
- Downside resilience: Average outperformance of 13.28 percentage points in the six calendar-year declines, with positive returns in half of them
- Compounding mechanics: Dividend reinvestment, rising payouts per share, and quarterly equal-weight rebalancing interact to amplify the edge over long horizons
- Regime limitations: Structural underweight to high-growth, low-yield sectors creates predictable lag during technology-led bull markets
The comparison to index investing is best framed as a risk-adjusted question rather than a raw return question. Over the 20-year live period, Aristocrats delivered a risk-adjusted return (Sharpe-style ratio) of 0.73 with volatility of 14.34%, lower than the S&P 500. Similar or slightly higher returns with lower volatility is a trade-off many investors would take, even if the headline numbers alone do not look dramatically different.
The strategy’s genuine value proposition is not market-crushing performance. It is a historically smoother path to comparable long-run wealth accumulation, paired with an income stream that grows over time. That combination has a practical behavioural advantage: rising income from a dividend growth portfolio provides a reason to stay invested during price drawdowns, and staying invested during drawdowns has more influence on actual outcomes than the raw return differential between two strategies.
For an investor deciding between a total-market index fund and a Dividend Aristocrat allocation, the data suggests the question is less “which returns more?” and more “which do I stay invested in during a 30% decline?” The behavioural answer to that question may matter more than the numbers on any comparison table.
Investors who want to examine the counterargument in full before committing to an allocation decision will find our full explainer on dividend investing vs total return, which includes a decade of backtested performance data and a tax-efficiency comparison across account types.
This article is for informational purposes only and should not be considered financial advice. Investors should conduct their own research and consult with financial professionals before making investment decisions. Past performance does not guarantee future results. Financial projections are subject to market conditions and various risk factors.