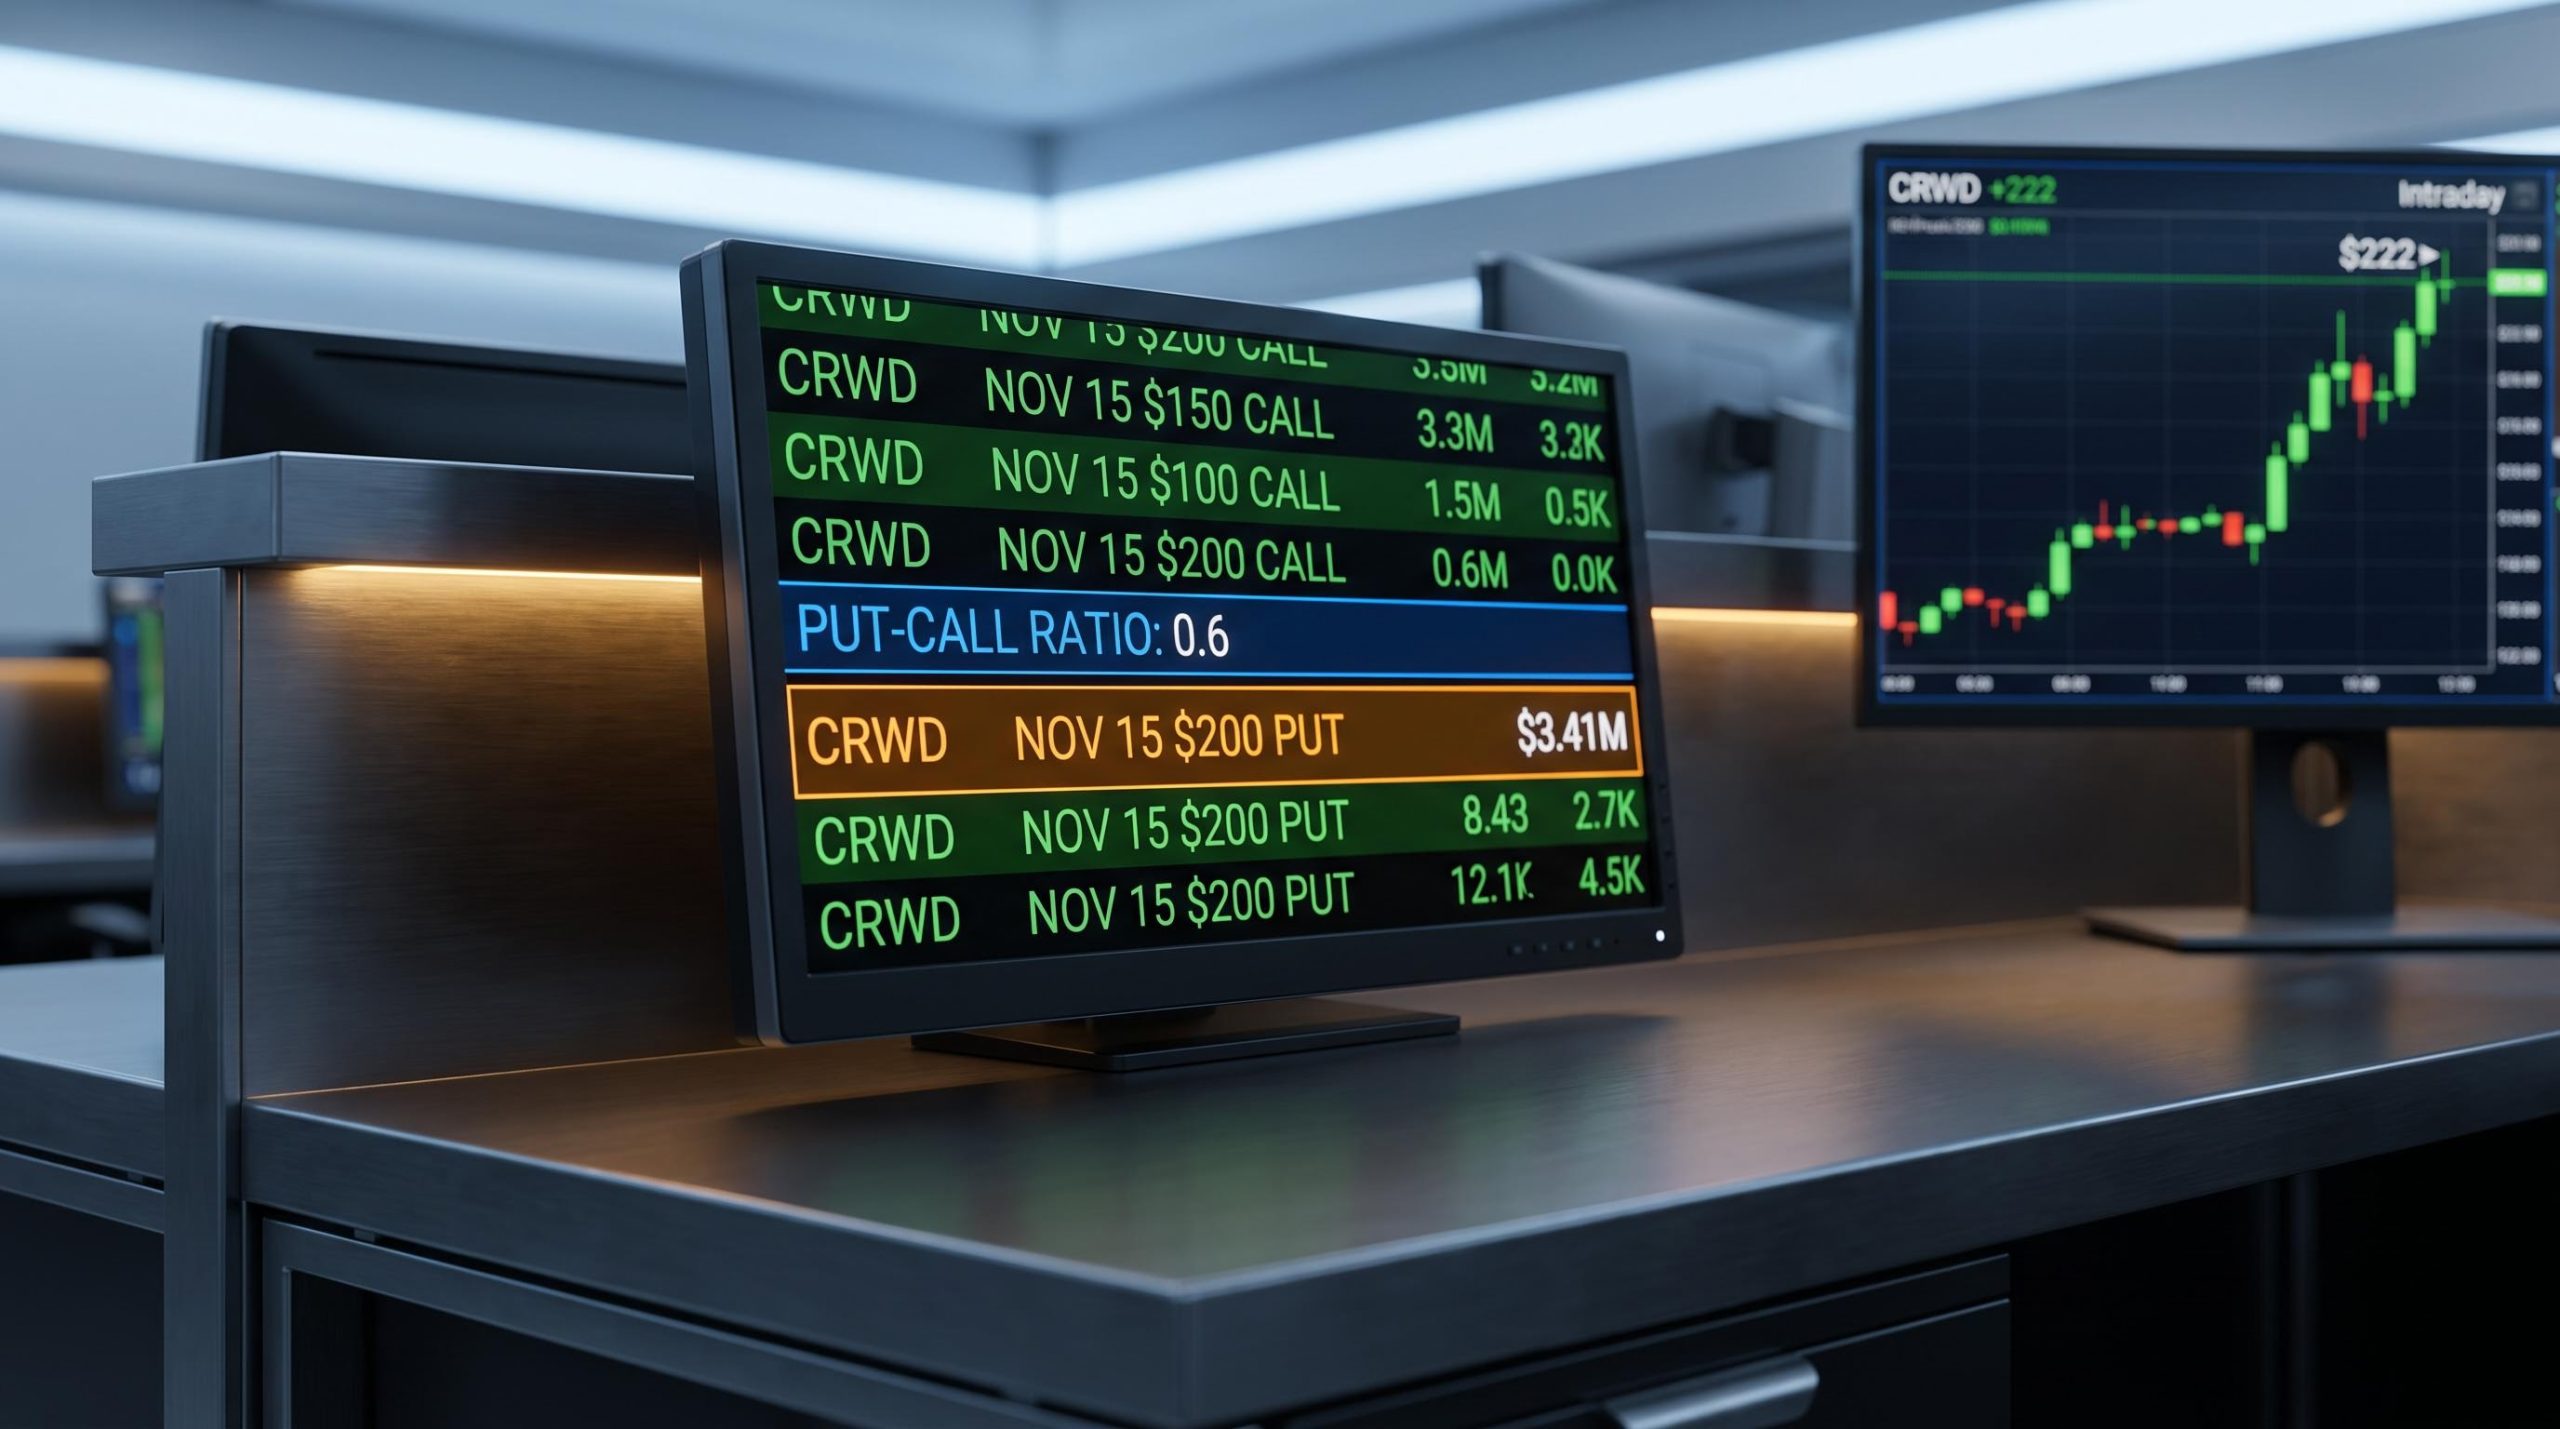
Someone spent $3.41 million buying put options on CrowdStrike on the morning of 27 August 2026, while the stock was still climbing toward $222. The company had just reported its best quarter in history. The buyer filled the position aggressively, with 96% of volume clearing at the ask, and ended up holding a contract already sitting 10% out of the money.
On the surface, that looks like a large, expensive bet against a stock that the rest of the market was busy bidding higher. The options tape that morning told a different story: intraday volume exceeded 180,000 contracts, the put-call ratio ran approximately 0.6-0.78 (heavily skewed toward calls), and implied volatility sat in the low-to-mid 50s. The dominant market interpretation was bullish. This single trade was an outlier in size, not in sentiment.
Misreading a print like this can lead to panicked selling out of a fundamentally accelerating position, or worse, copycat speculation against a business that just posted 51% net new annual recurring revenue (ARR) growth. Here is what the trade’s own structure tells you about who placed it and why, and a four-part framework you can apply to any unusual CrowdStrike options activity, or any other large put purchase, the next time one crosses your screen.
CrowdStrike just posted its best quarter ever, and the market believed it
The number that matters most in CrowdStrike’s fiscal Q2 2027 report is not revenue or total ARR. It is net new ARR: the amount of new recurring subscription value added during the quarter. That figure came in at $333 million, up 51% year over year.
Net new ARR: $333 million, up 51% year over year. For a platform software business already running at $5.84 billion in ending ARR, accelerating net new additions at this rate signals that growth is compounding, not flattening. That distinction is what high-multiple software investors fear losing most.
Net new ARR is the growth rate of the growth rate. When it decelerates, it tells you the business is maturing and that the stock’s premium multiple is at risk. When it accelerates at scale, it tells you the opposite: the company is winning new workloads faster than the market expected. CrowdStrike just delivered the latter.
| Metric | Reported figure | Year-over-year change |
|---|---|---|
| Revenue | $1.47 billion | +26% |
| Ending ARR | $5.84 billion | +25% |
| Net new ARR | $333 million | +51% |
| FY2027 revenue guidance (raised) | $5.99-$6.01 billion | Raised |
| FY2027 non-GAAP EPS guidance (raised) | $1.25-$1.26 | Raised |
Management raised full-year guidance on both revenue and non-GAAP earnings per share (EPS), which means the beat was not a one-off. George Kurtz, the company’s CEO, went on record calling it the strongest quarter CrowdStrike had ever delivered.
Some coverage flagged an adjustment to stock-based compensation (SBC) accounting treatment. This was a presentation-layer reclassification, not a deterioration in the underlying economics of the business. It affected how SBC expenses appear in the income statement, not how much the company actually spent or earned.
The stock opened at approximately $208.25 on 27 August and traded toward $222 across the 27-28 August sessions, an 18-20% rerating. That move was not euphoria. It was a market recalibrating to a business that just proved it is still accelerating at scale.
When big ASX news breaks, our subscribers know first
What the $3.41 million put trade actually looked like
At the open on 27 August, with CrowdStrike rising sharply off its opening print of $208.25 toward the low $220s, someone pulled the trigger on a large put position. The execution was notably urgent: roughly 96% of volume transacted at the ask, indicating the buyer prioritised certainty of fill over getting a better price.
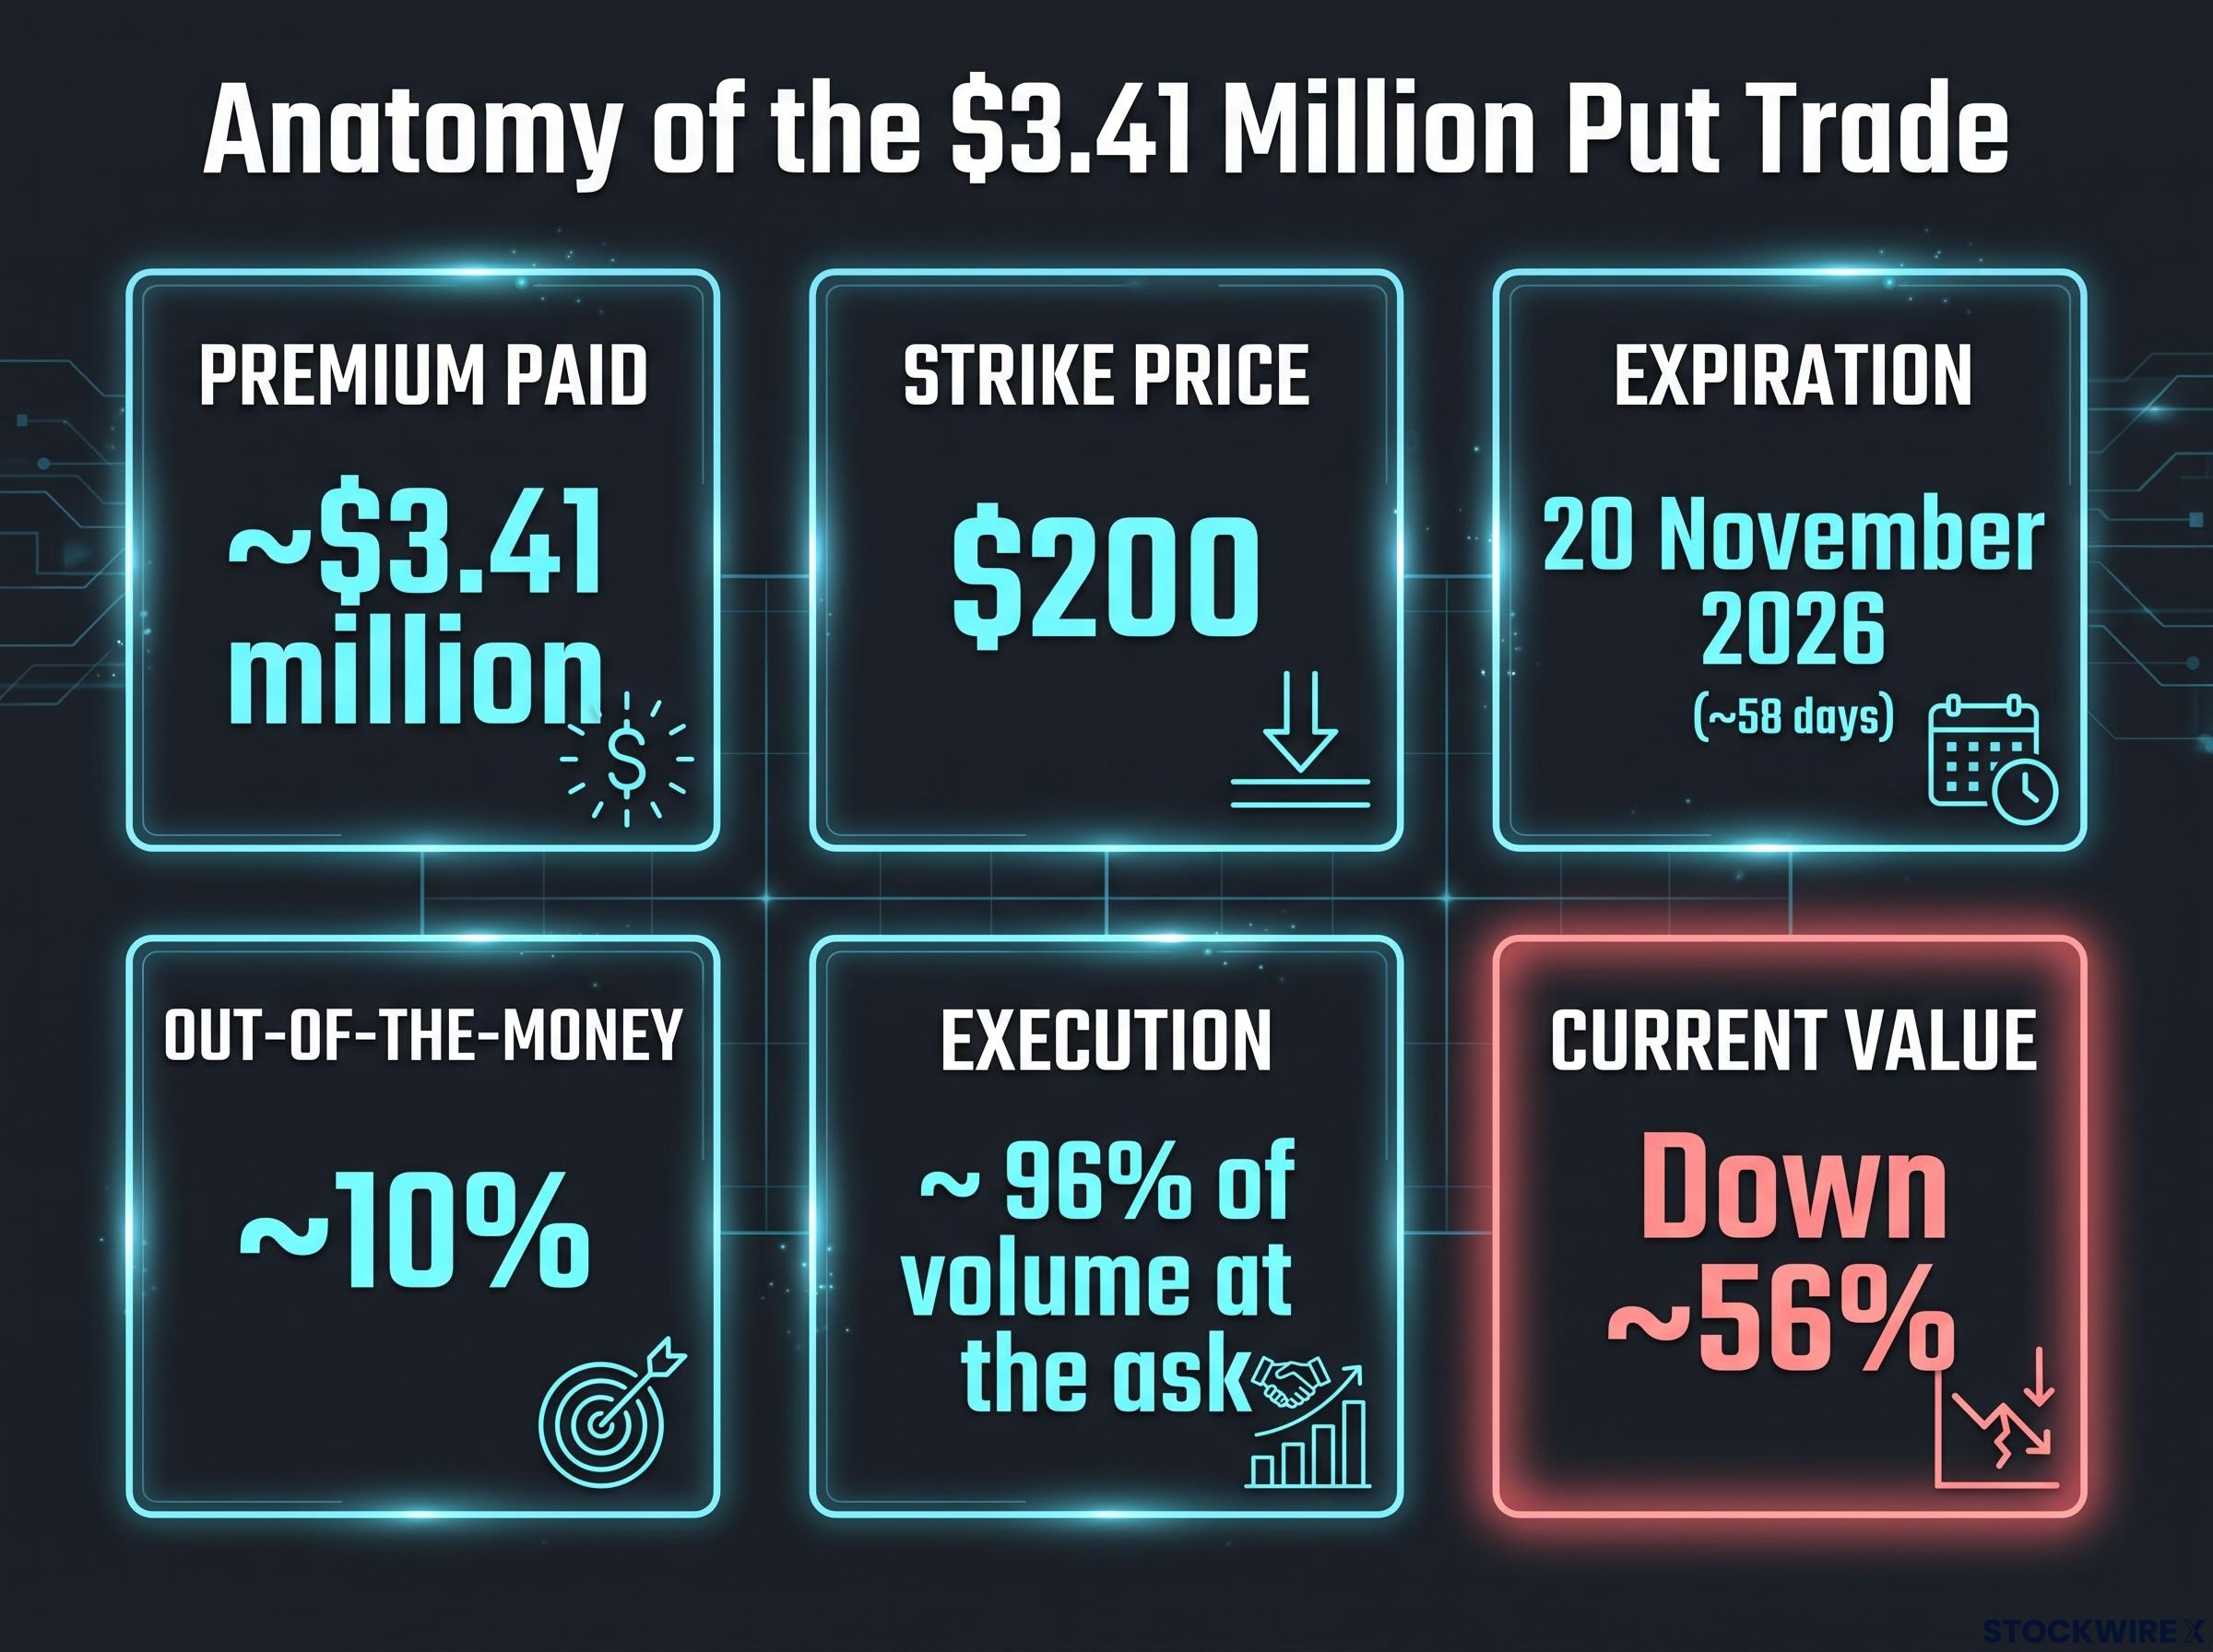
96% of volume hitting the ask is the single most telling execution detail. A buyer willing to pay up that aggressively is prioritising speed of execution over price, behaviour consistent with someone managing risk on a time-sensitive basis rather than building a speculative position patiently.
| Trade characteristic | Value |
|---|---|
| Premium paid | ~$3.41 million |
| Strike price | $200 |
| Expiration | 20 November 2026 |
| Days to expiration at trade | ~58 days |
| Out-of-the-money at trade | ~10% |
| Implied volatility at trade | ~52% |
| Estimated probability of profit | ~1 in 3 |
| Volume hitting ask | ~96% |
| Put value change since trade | Down ~56% |
Since the trade was placed, the put has shed approximately 56% of its value as the stock continued its advance. That matters for the interpretation. The broader options tape on the same day was overwhelmingly call-heavy: more than 180,000 contracts traded, with the put-call ratio running approximately 0.6-0.78. Implied volatility across CrowdStrike options sat in the low-to-mid 50s, moderate rather than elevated.
What the aggregate flow tells you is that the market’s collective judgment was bullish. This one trade was an outlier in dollar terms, but it was swimming against the current of the entire options tape, a structural mismatch that becomes important when you evaluate whether the buyer was speculating or hedging.
Four structural features that separate a hedge from a directional bet
A large put purchase, by itself, tells you very little about the buyer’s intent. What tells you more is how the trade was constructed. Four characteristics of this specific position, when evaluated together, point consistently toward a hedge rather than a bearish speculation.
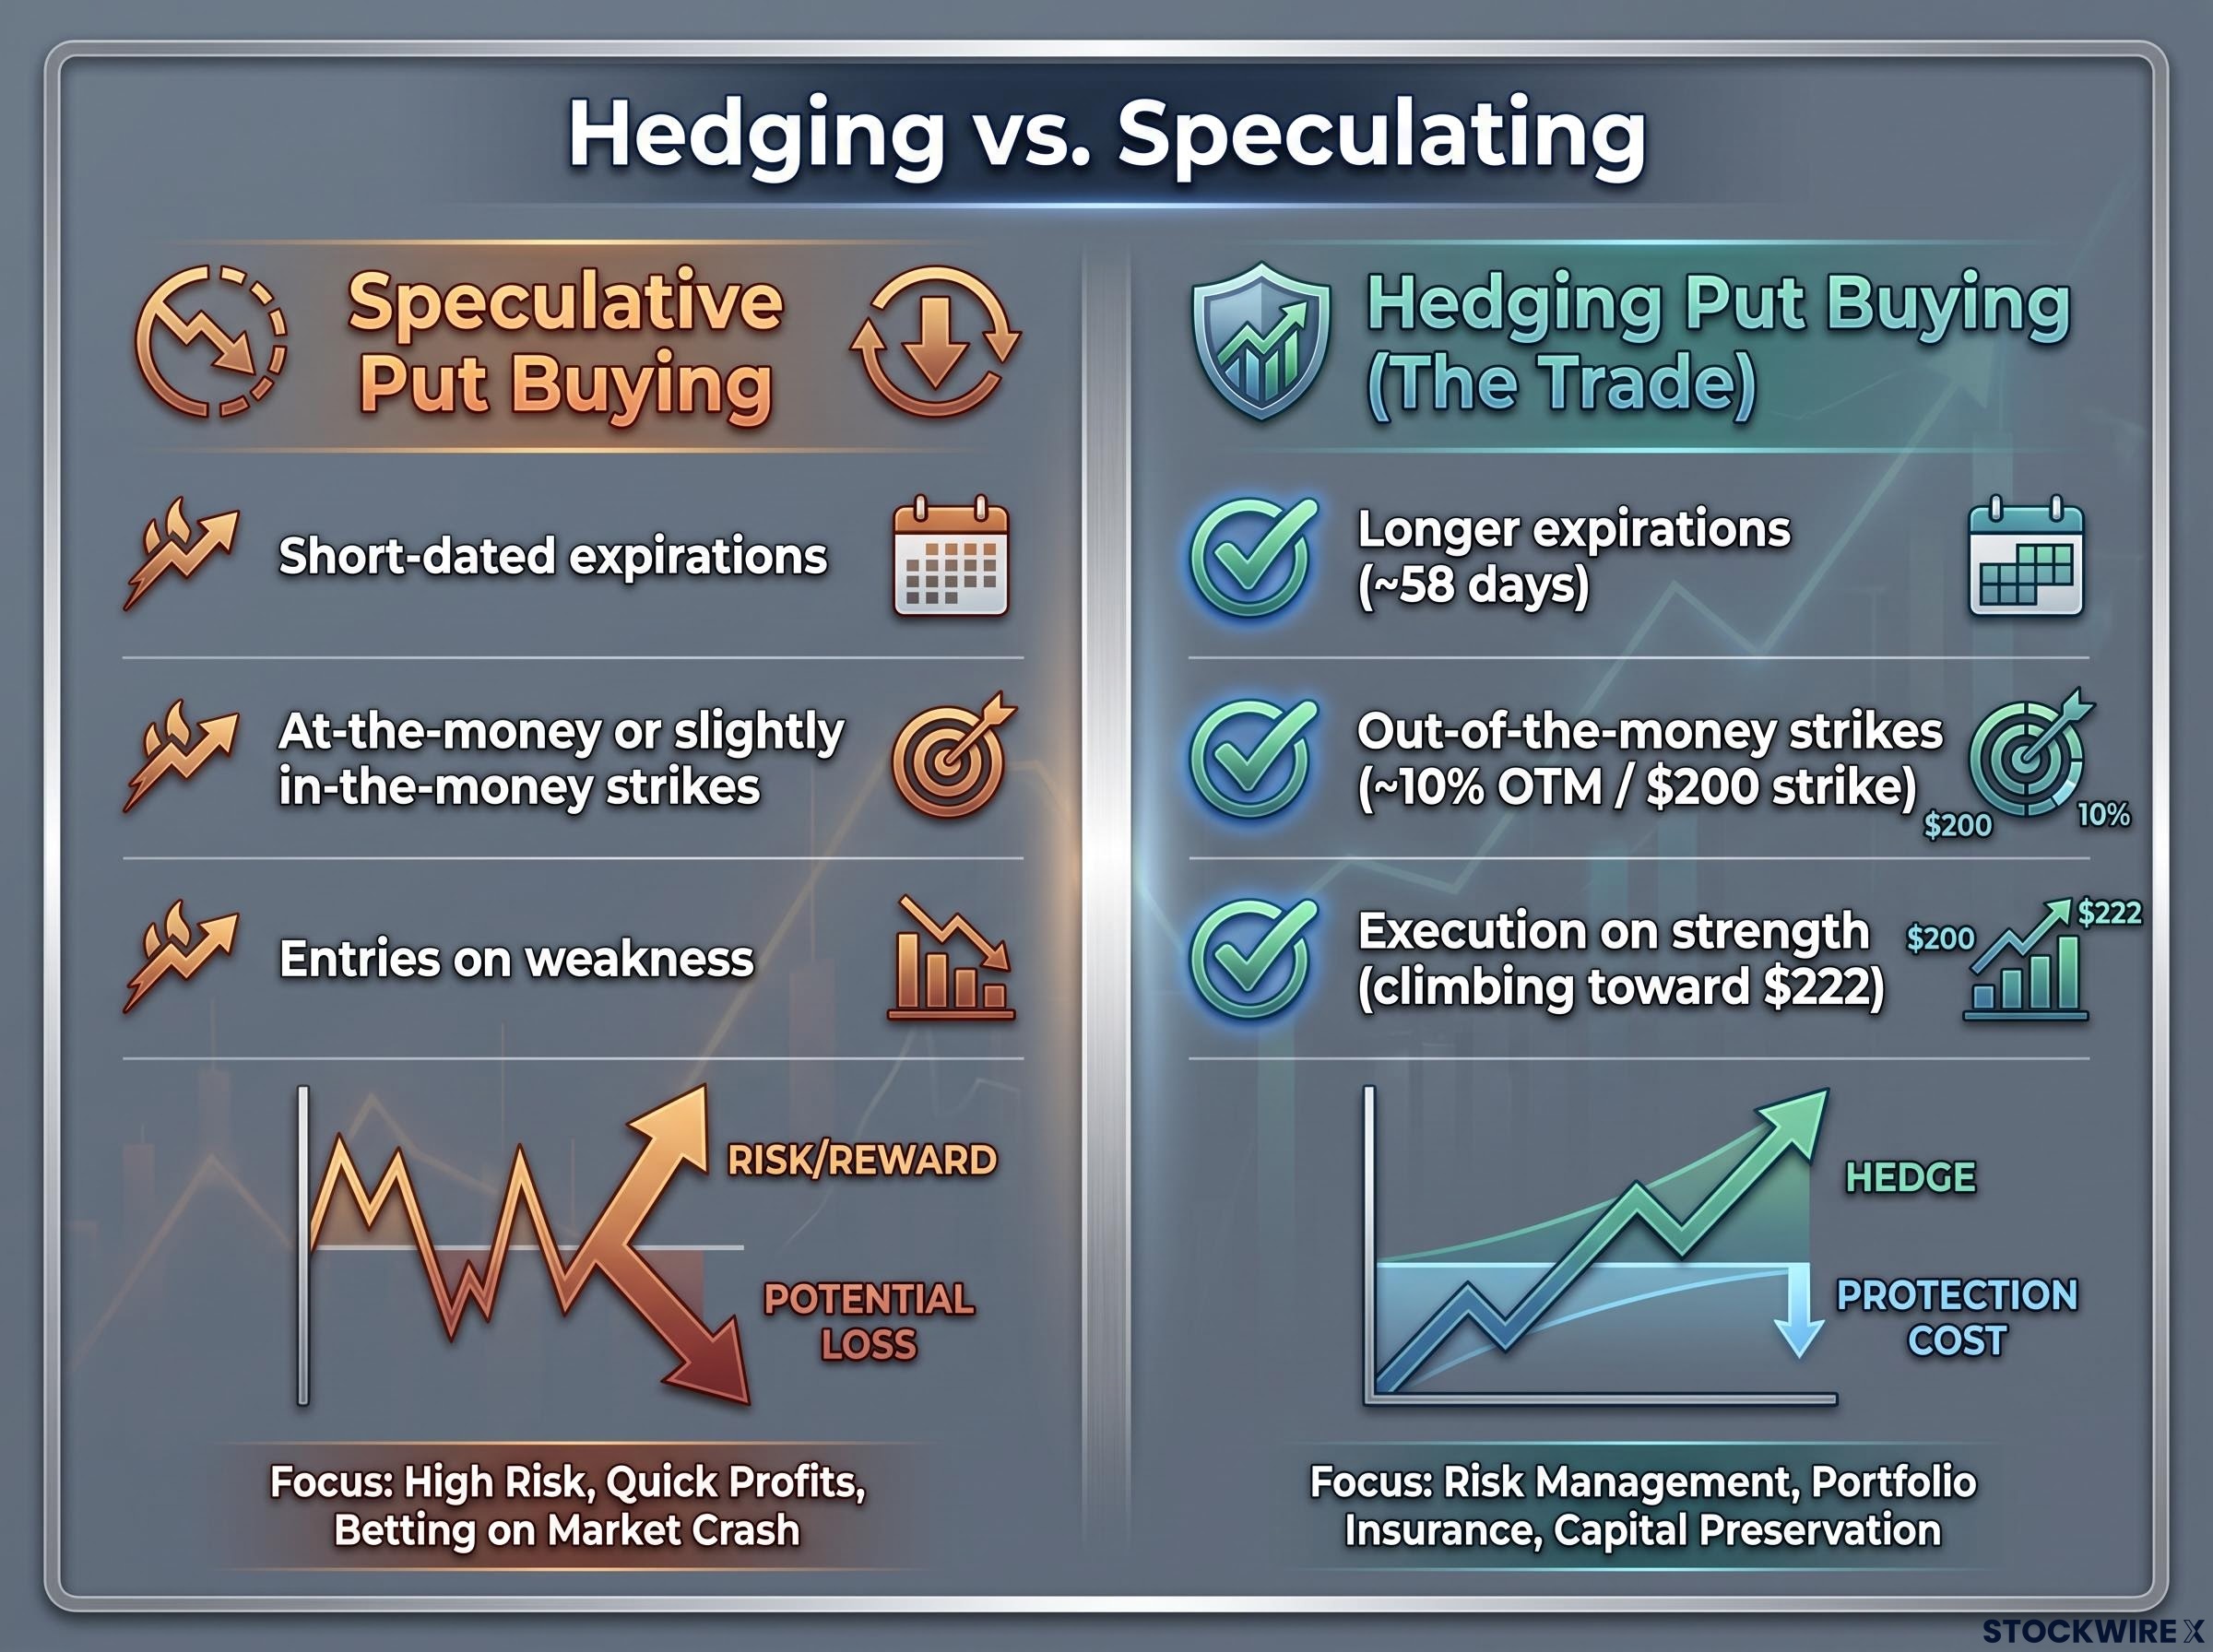
The speculative vs. hedging profile compared
Before applying each feature, it helps to see what each profile typically looks like:
- Speculative put buying tends to use short-dated expirations (days to a few weeks), at-the-money or slightly in-the-money strikes for maximum delta leverage, entries on weakness or near a known negative catalyst, and position sizing large relative to daily volume but not tied to an identifiable stock holding
- Hedging put buying tends to use longer expirations (several weeks to months), out-of-the-money strikes designed to cap tail risk rather than everyday volatility, execution on strength (often shortly after large gains), and premiums that make sense as a single-digit percentage of a plausible underlying equity position
The CrowdStrike November $200 put trade checks every hedging box and none of the speculative ones. Here is how each feature maps:
- Timing: The puts were purchased while the stock was still climbing, not after signs of exhaustion. Buying protection into strength is consistent with a long holder whose mark-to-market gain just expanded by 18-20% overnight and who wants to insure it. A directional speculator typically waits for a perceived peak or enters on weakness.
- Strike selection: The $200 strike was approximately 10% out of the money. It only pays off meaningfully if CrowdStrike gives back most or all of the post-earnings move and keeps falling. A directional bear expecting a near-term rollover prefers at-the-money or slightly in-the-money puts to maximise sensitivity to a smaller move.
- Expiration length: Roughly 58 days to expiration covers multiple macro and sector catalysts through the digestion period after a large rerating. A speculator targeting an immediate reversal would choose shorter-dated options for more leverage per dollar of premium. A two-month duration is a risk-management window, not a leveraged event play.
- Execution urgency: With 96% of volume hitting the ask, the buyer was paying up to get filled fast. For a directional trader watching the stock move against the trade (upward, making the puts cheaper), there is little reason to rush. For a hedger, every minute without protection leaves an increasingly large dollar gain exposed to reversal.
A $3.4 million put premium on a plausible $30-$60 million equity stake represents a 5-10% insurance expenditure. That is a routine cost of institutional risk management, not a dramatic bearish thesis.
The put’s 56% decline in value since initiation does not falsify the hedging interpretation. It confirms it. A hedge is supposed to lose value when the underlying position keeps going right. A speculative short that loses 56% immediately is a thesis failure. The two interpretations carry very different implications.
Why the fundamental backdrop makes the bearish reading even harder to sustain
If this trade were a speculative bet against CrowdStrike, the buyer would need a compelling counter-narrative. Against this specific earnings print, the evidence for one is thin:
- Net new ARR accelerated 51% year over year, the opposite of the deceleration pattern that typically precedes a high-multiple software unwind
- Management raised full-year guidance on both revenue and EPS, projecting forward strength rather than warning of headwinds
- The broader options tape was call-heavy (put-call ratio 0.6-0.78), not consistent with institutional actors quietly positioning for a collapse
- The only surface-level negative, the SBC accounting reclassification, was a presentation-layer change with no bearing on underlying economic performance
A sophisticated actor running a $3.4 million bearish thesis against a quarter the CEO called the company’s best ever, with accelerating ARR growth and raised guidance, would need an edge the fundamental data does not support. The “too far, too fast” argument is a valuation concern, not a fundamental one, and it is not corroborated by the aggregate options flow.
The simplest reading remains the cleanest. CrowdStrike delivered an outstanding quarter. The stock was repriced sharply higher. At least one large holder spent $3.41 million to insure a much larger profit pool against the possibility of a sharp reversal during the digestion period. That is a risk-management story, not a hidden bearish signal.
This article is for informational purposes only and should not be considered financial advice. Investors should conduct their own research and consult with financial professionals before making investment decisions. Options involve substantial risk, including the potential loss of the entire premium paid.
Reading the tape with discipline, not just the headline number
The structure of a trade, its strike, tenor, timing, and execution, tells you more about intent than the dollar figure on the headline. A $3.41 million put sounds alarming in isolation. In the context of a plausible $30-$60 million long equity stake, a call-heavy options tape, and a quarter that just delivered 51% net new ARR acceleration, it reads as insurance.
The CrowdStrike case gives you a repeatable process for evaluating any large unusual options print you encounter:
- Check the broader tape composition. Is the overall flow bullish, bearish, or mixed? A single large put in a call-heavy tape means something different from a cluster of puts in a put-heavy tape.
- Analyse the individual trade’s structural characteristics. Look at timing (strength or weakness), strike selection (OTM tail protection or ATM delta leverage), expiration (risk-management window or short-dated event play), and execution urgency (paying up or fishing).
- Layer in the fundamental backdrop. Does the underlying business give a sophisticated actor a reason to bet against it right now? If the fundamentals are accelerating and guidance is rising, the burden of proof falls on the bearish interpretation.
The put’s 56% decline since initiation is the cleanest confirmation available. It is performing exactly as a hedge performs when the position it protects keeps appreciating. The buyer’s long stock position is almost certainly worth more today than when the trade was placed. That is the outcome a hedger wants.
The next time you see a large put position reported in financial media, resist the instinct to ask “who is betting against this stock?” Ask instead: what does the structure of this trade tell you about why it was placed? That question, applied consistently, is the difference between reacting to a headline and reading the tape.