
FY26 results overview
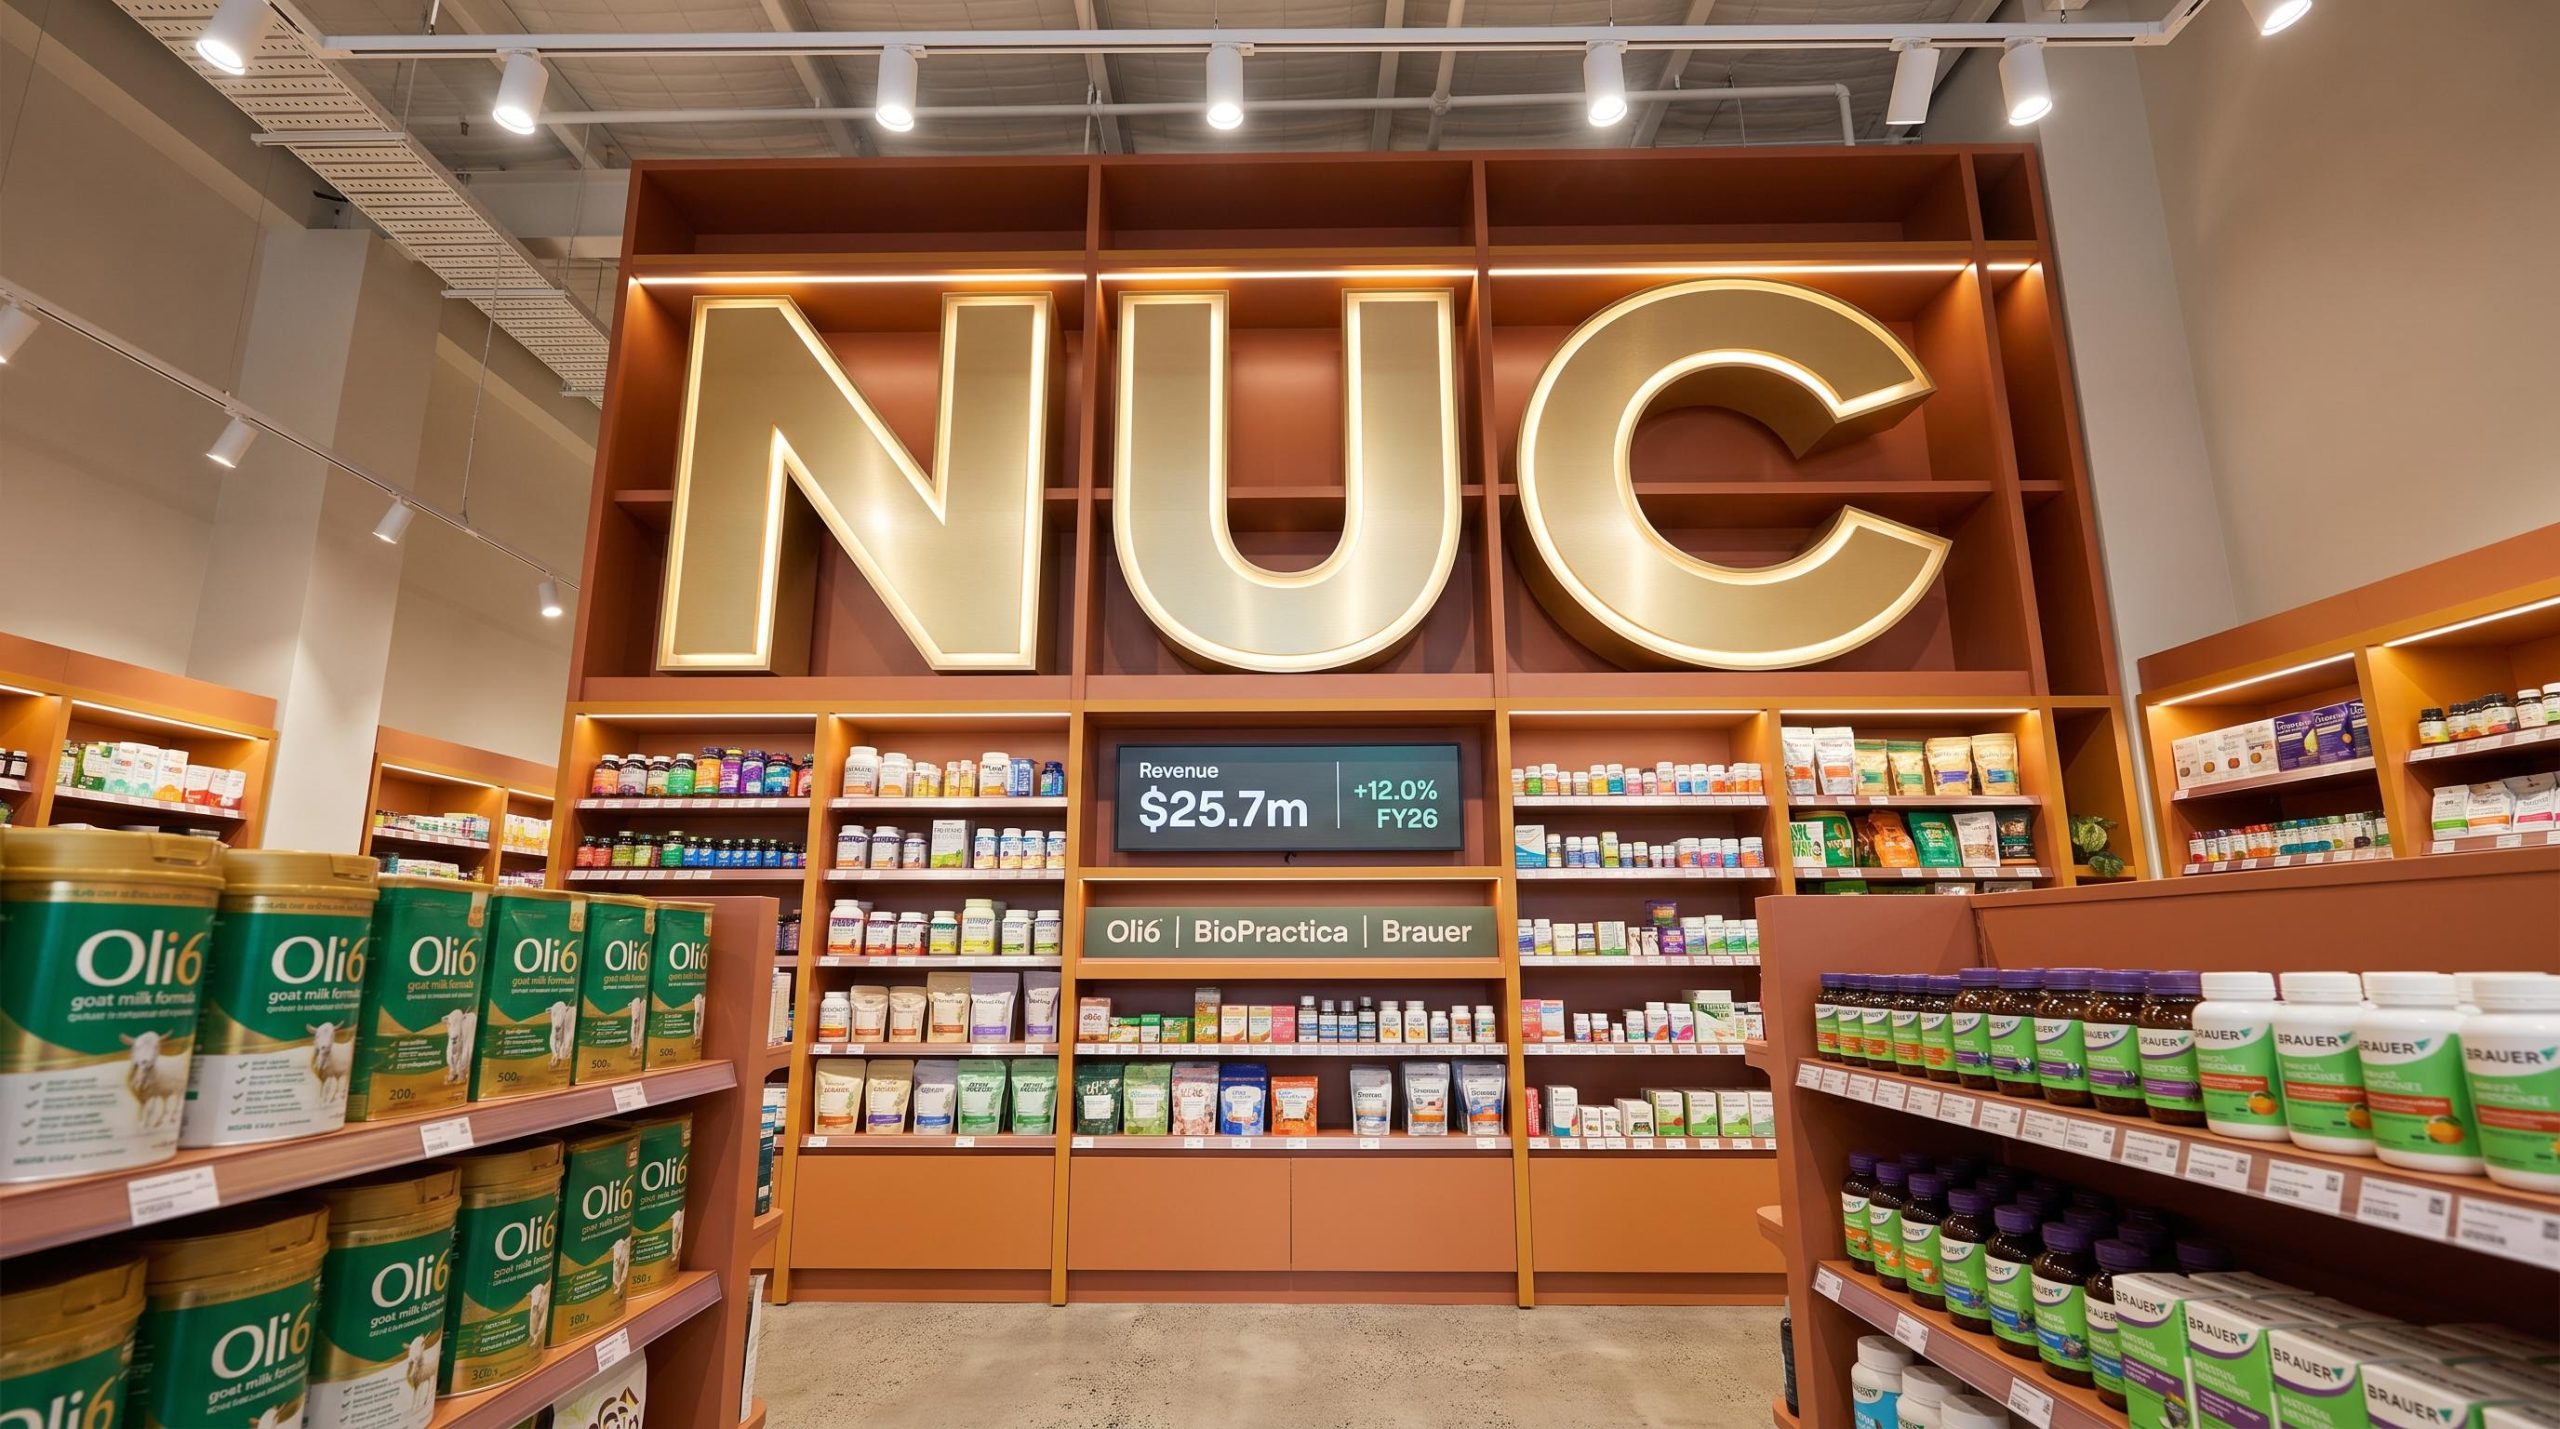
In its FY26 full-year results presentation, Nuchev reported Group revenue growth to $25.7m (+12.0%) for the year ended 30 June 2026, driven by domestic strength across its consumer nutrition and distribution brands.
Management framed FY27 around a clear shift in focus toward conversion, margin and cash. That framing acknowledged a balancing reality. Gross profit rose to $11.2m (+3.2%), but the adjusted EBITDA loss widened to $(4.6)m and closing cash fell to $2.1m.
The story management outlined for FY27 centres on operating leverage and working-capital conversion, built on a domestic base that has scaled materially over the period.
When big ASX news breaks, our subscribers know first
FY26 headline results at a glance
The topline result reflected a clear tension. Revenue grew, yet margin, earnings and cash conversion all weakened over the period. Cost of sales rose faster than revenue, while a broader distribution model increased the cash tied up in the balance sheet.
The statutory loss also included a $1.873m non-cash goodwill impairment. Management noted this impairment is non-cash and does not affect adjusted EBITDA, available funding or current operating plans.
Set against a five-year view, the wider loss is not unprecedented. The Group recorded adjusted EBITDA losses in every year from FY22 to FY26. Losses had narrowed steadily across FY22 to FY25, before FY26 disrupted that improvement trend.
| Metric | FY26 | FY25 | Change |
|---|---|---|---|
| Revenue | $25.7m | $22.9m | +12.0% |
| Gross profit | $11.2m | $10.9m | +3.2% |
| Gross margin | 43.6% | 47.3% | –3.7pp |
| Adjusted EBITDA | $(4.6)m | $(3.3)m | +36.3% wider loss |
| Loss after tax | $(7.4)m | $(3.8)m | Wider |
| Closing cash | $2.1m | $3.6m | Lower |
What’s driving the numbers — Australia now 76% of revenue
Domestic growth offsetting international softness
The revenue mix shifted markedly toward the domestic market. Australia and New Zealand revenue grew to $19.4m (+37.9%), now representing 76% of Group revenue. International revenue declined to $6.3m (–29.3%), split between China at $4.9m and Vietnam at $1.4m.
Management characterised international performance as both an opportunity and a source of volatility. Distributor ordering patterns, shipment timing, and registration and import documentation requirements delayed conversion during the period.
Why gross margin compressed
Cost of sales grew +19.9%, outpacing revenue growth of +12.0%. This compressed gross margin to 43.6%, down from 47.3% in FY25, a decline of 3.7 percentage points.
The presentation disclosed four drivers behind the margin compression:
- Channel and product mix
- Promotional activity
- Product costs
- Logistics
Margin recovery is one of the key focus areas for FY27, alongside operating leverage and working-capital conversion.
Understanding the working capital and cash picture
Why the broader distribution model ties up more cash
The shift to a broader distribution model increased balance-sheet intensity, tying up more cash in debtors and inventory. For investors, this matters because more cash is committed until demand converts into collected sales. The FY26 movements reflected this shift:
The shift from agency to distribution for Brauer, Skin Physics, and Rapid Loss expanded Nuchev’s commercial control over pricing, inventory, and brand execution, but required a front-loaded investment in working capital that is visible in the FY26 balance-sheet movements.
- Receivables +96.6%
- Inventory +37.3%
- Payables +185.0%
Operating cash use rose to $(6.639)m, compared with $(3.742)m in FY25, reflecting the operating loss and investment in inventory and receivables. Financing provided an inflow of $5.267m, including $1.926m of share proceeds and $3.500m of borrowings, leaving closing cash of $2.125m.
Liquidity and the going-concern position
The Group ended the period with net current assets of $7.6m, net assets of $5.9m and cash of $2.1m. It also holds $6.0m in unsecured shareholder-supported working-capital facilities, of which $3.5m is drawn and $2.5m remains available, maturing on 31 March 2028.
The shareholder-supported working-capital facility underpinning this liquidity position was established with H&S Global Holdings in May 2026, structured as two tranches of $2 million each on an unsecured basis, with interest and fees capitalised at the company’s election.
The Directors consider the going-concern basis appropriate. The accounts also disclose a material uncertainty, because the forecast remains sensitive to revenue growth, margin, working capital and facility drawdowns.
Building a broader nutrition and wellness platform
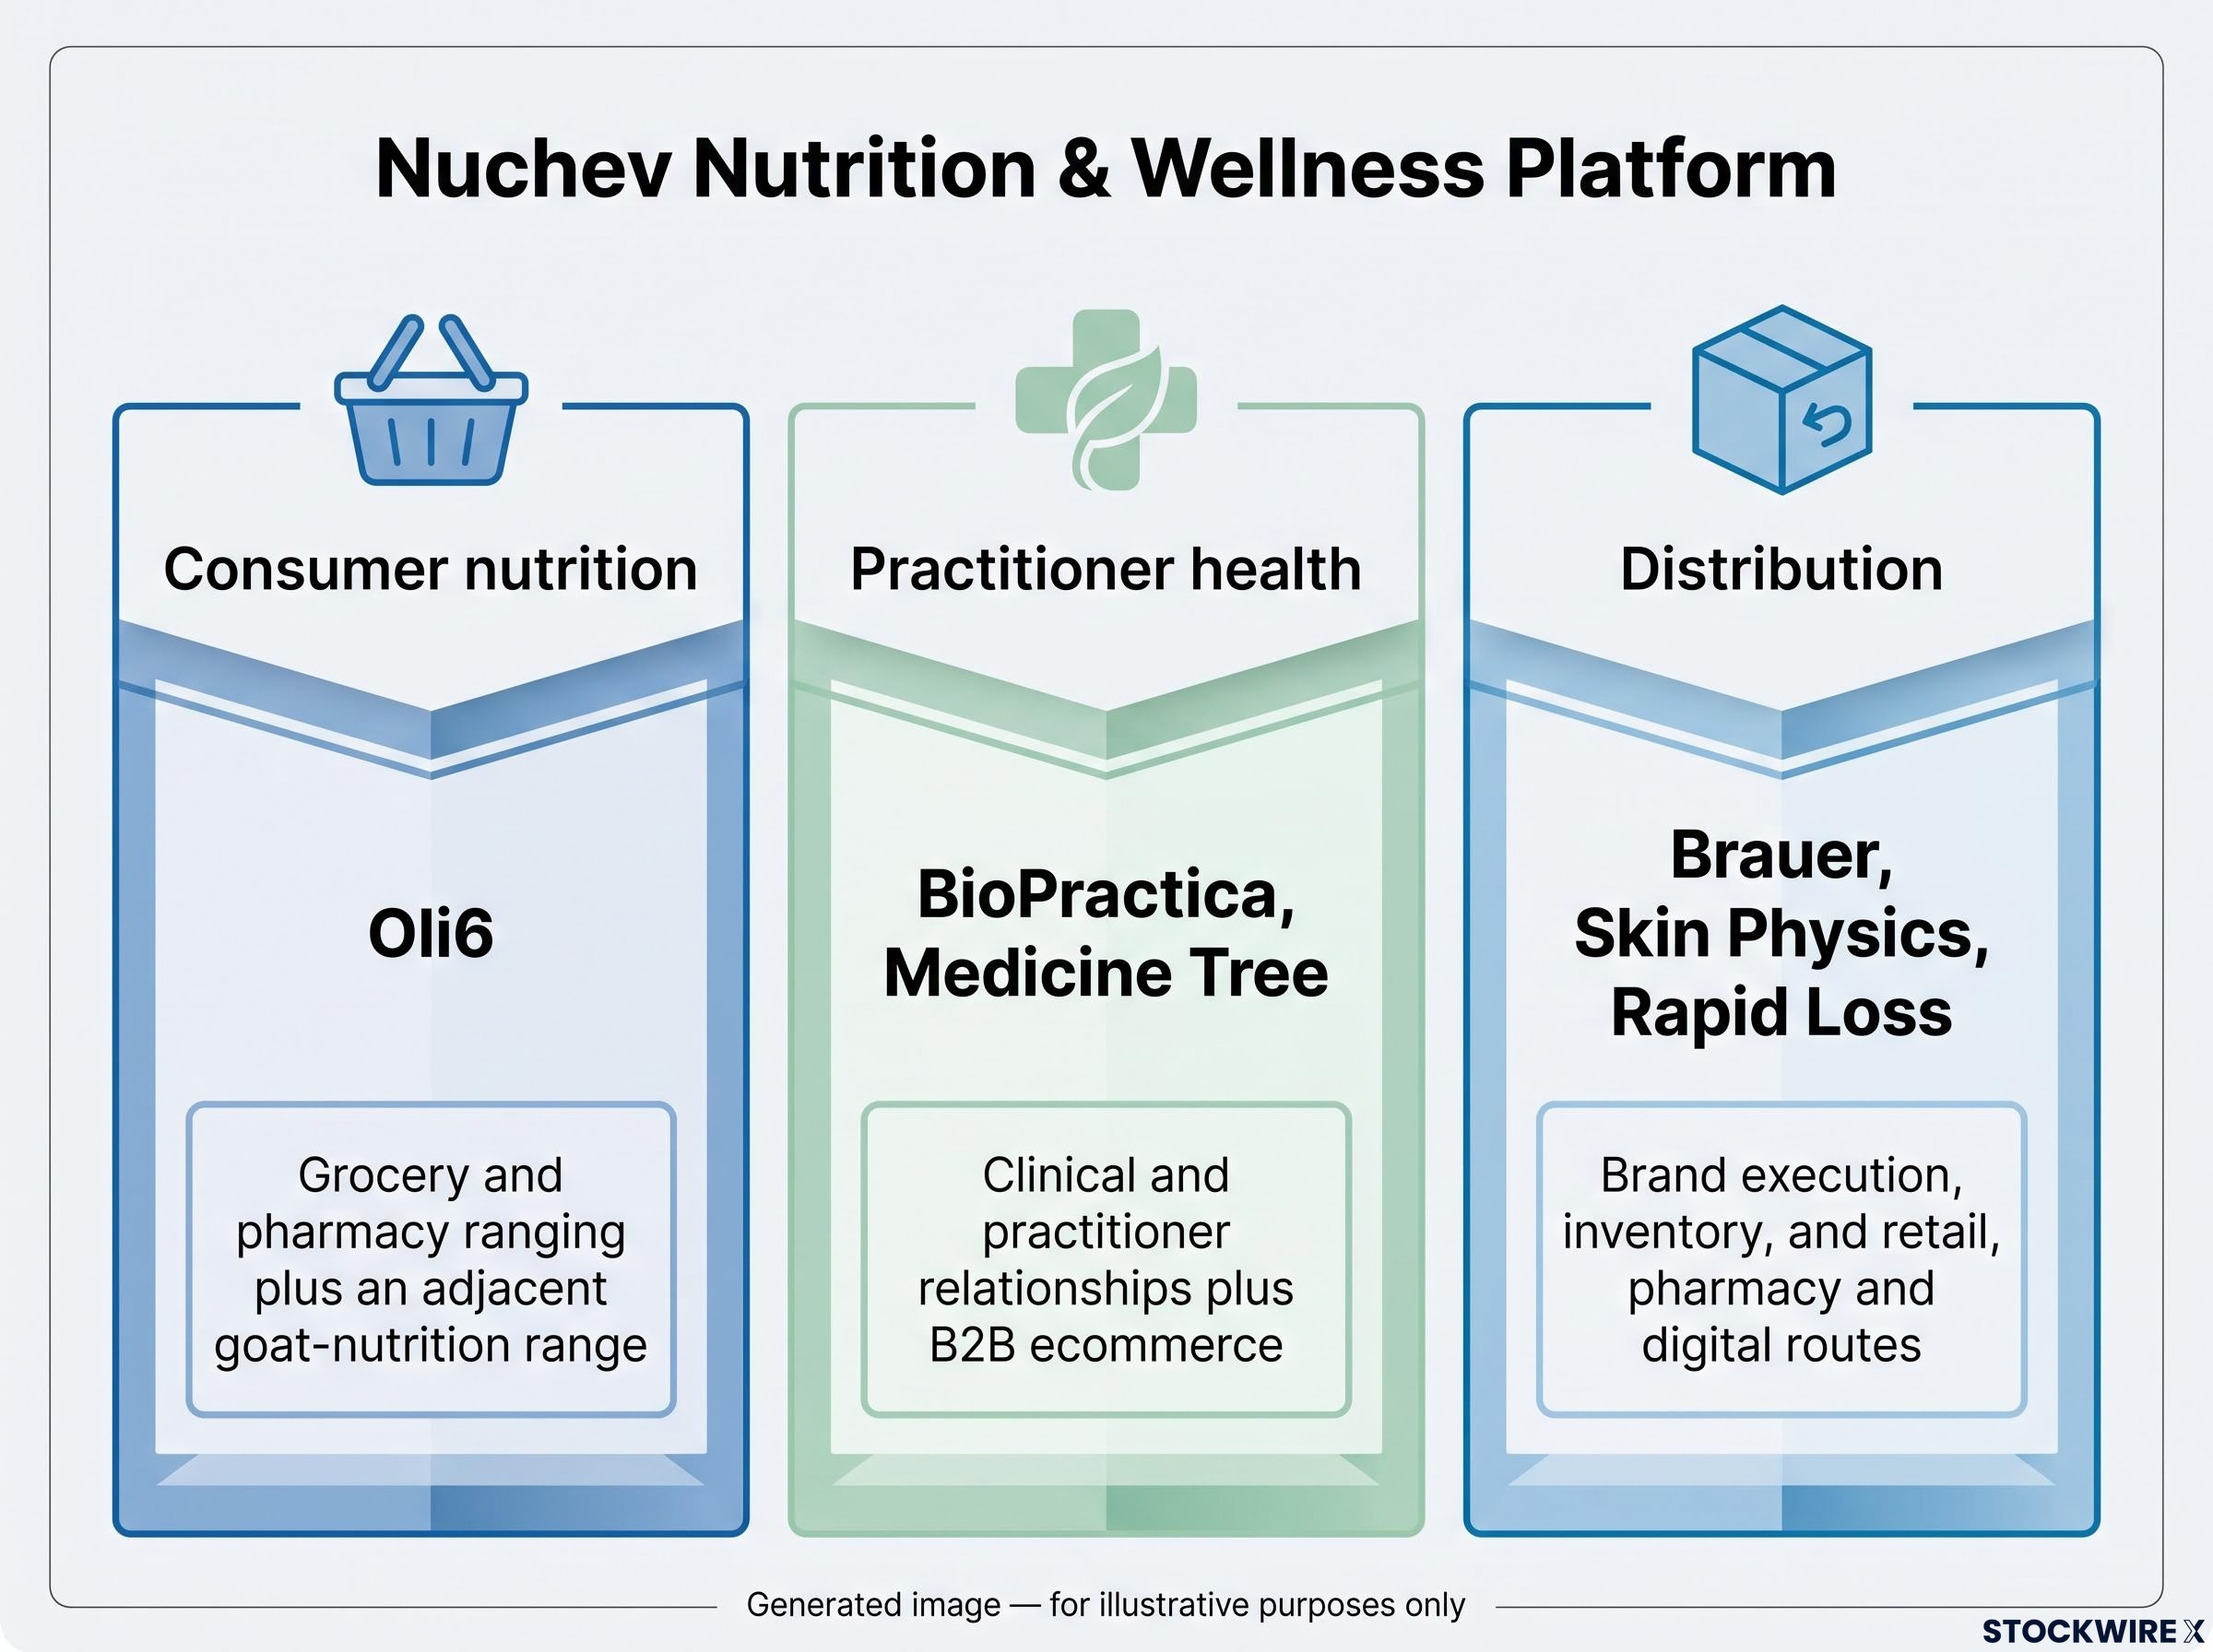
Management detailed an integrated platform spanning three segments, designed to reduce reliance on any single product, geography or channel. The strategic logic centres on multiple brands operating across shared capability in supply chain, regulatory and routes to market.
| Segment | Brands | Role |
|---|---|---|
| Consumer nutrition | Oli6 | Grocery and pharmacy ranging plus an adjacent goat-nutrition range |
| Practitioner health | BioPractica, Medicine Tree | Clinical and practitioner relationships plus B2B ecommerce |
| Distribution | Brauer, Skin Physics, Rapid Loss | Brand execution, inventory, and retail, pharmacy and digital routes |
FY26 operating progress showed Oli6 domestic revenue ahead of FY25, alongside portfolio expansion including Children’s snacking and Nighty Night Goat. Brauer’s contribution rose over the closing months following the March 2026 transition from agency to distribution, and Oli6Goat.com went live in June 2026.
The road ahead — scaling engines and converting to cash
Management framed FY27 around four complementary growth engines, with the goal of scaling revenue without a corresponding expansion in the fixed cost base. The strategic priorities outlined were:
- Strengthen Oli6
- Rebuild Practitioner
- Scale distribution
- Commercialise innovation
- Convert growth through mix, operating leverage and working-capital conversion
Importantly, no formal FY27 earnings guidance was provided. The following were presented as planning assumptions, not forecasts: continued domestic retail growth, a full-year Brauer distribution contribution, progress in international markets, a rebuilding of the Practitioner business, and further facility drawdown as required.
Management also detailed downside levers available if performance falls below plan, including deferring discretionary spend, managing inventory, adjusting launch timing, focusing on debtor collections and sequencing supplier payments.
From the presentation
“The strategy is simple: scale multiple revenue engines across an operating platform already built to support a larger business.”
Management closed on three investor takeaways: proven domestic momentum and a broader revenue base; multiple brands, categories and routes to market; and a clear focus on contribution, leverage and cash.
Don’t Miss the Next Consumer Sector Move on ASX
Big News Blast delivers FREE breaking ASX news across consumer, healthcare, tech and more, straight to your inbox within minutes of release, with in-depth analysis already completed. Over 20,000 active subscribers rely on it to stay ahead of the market. Click the “Free Alerts” button at Big News Blast to get the next announcement the moment it drops.