
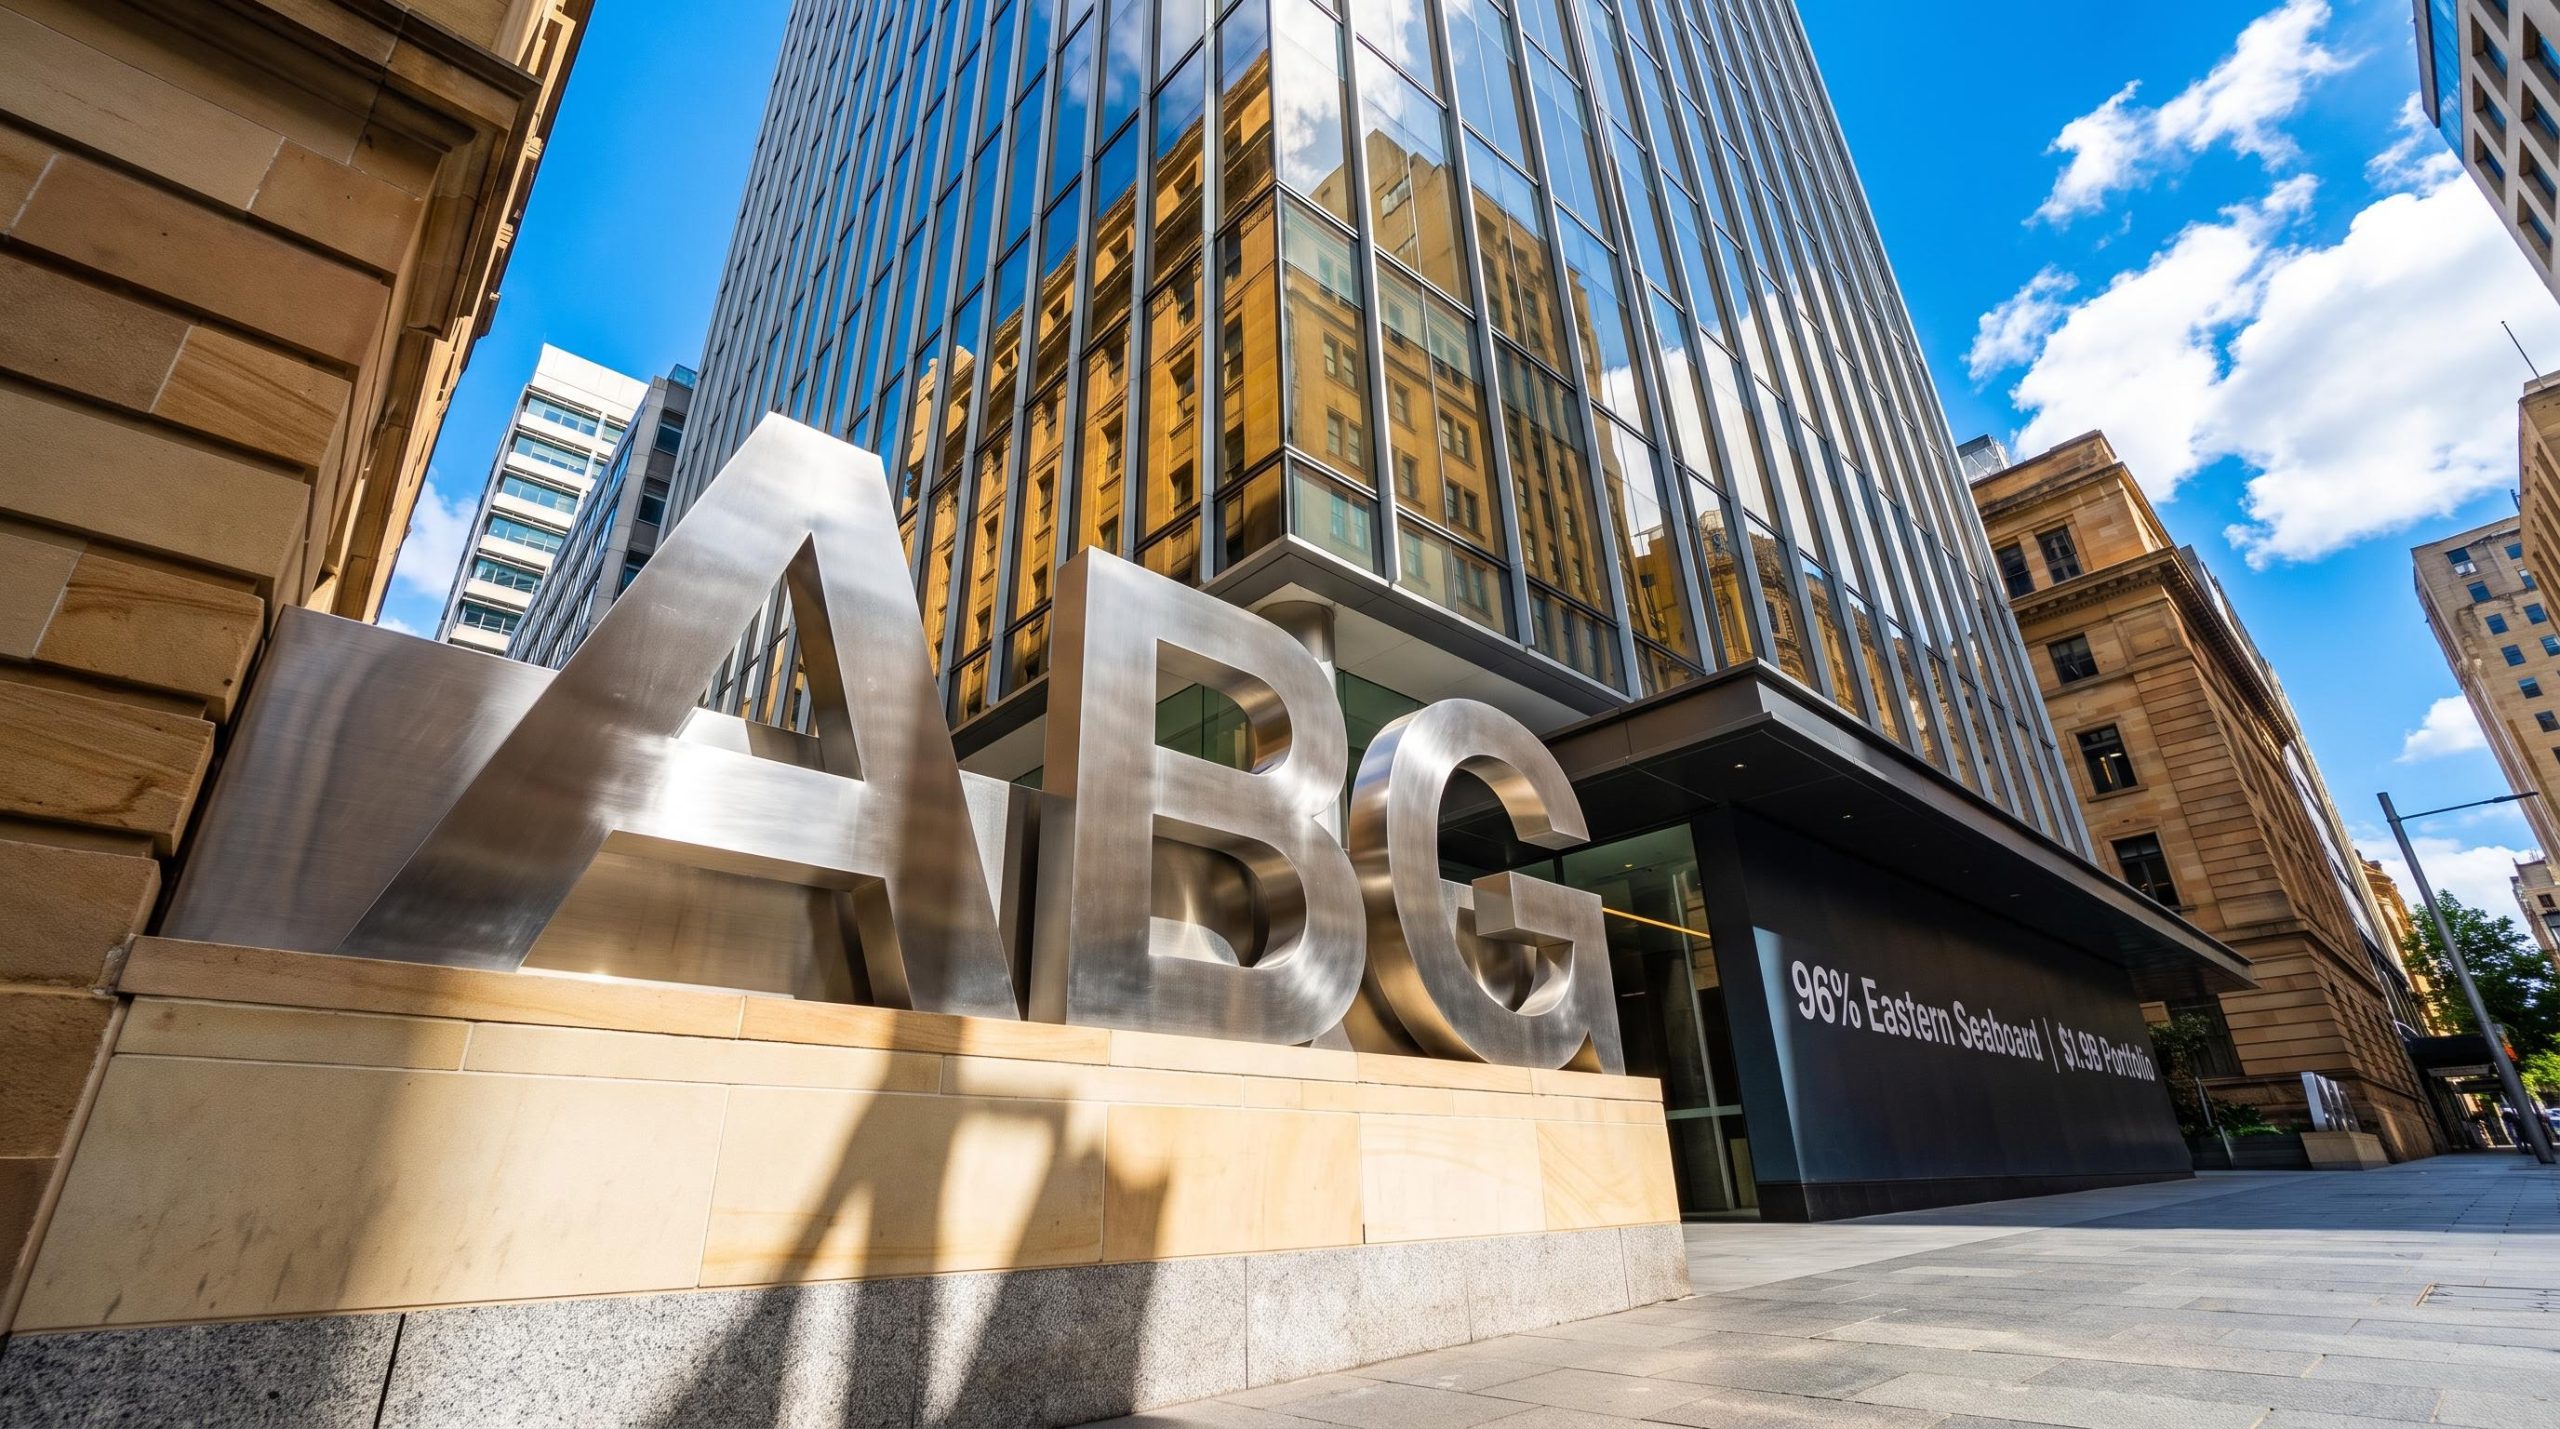
Abacus reveals $1.9bn property portfolio concentrated on the Eastern Seaboard
In its FY26 Property Book, released 25 August 2026, Abacus Group detailed a $1.9bn commercial property portfolio comprising 17 assets, with 96% of the book exposed to Australia’s Eastern Seaboard. The disclosure presented a concentrated, quality-focused office and retail portfolio weighted towards the nation’s strongest metropolitan markets, with all figures reported as at June 2026.
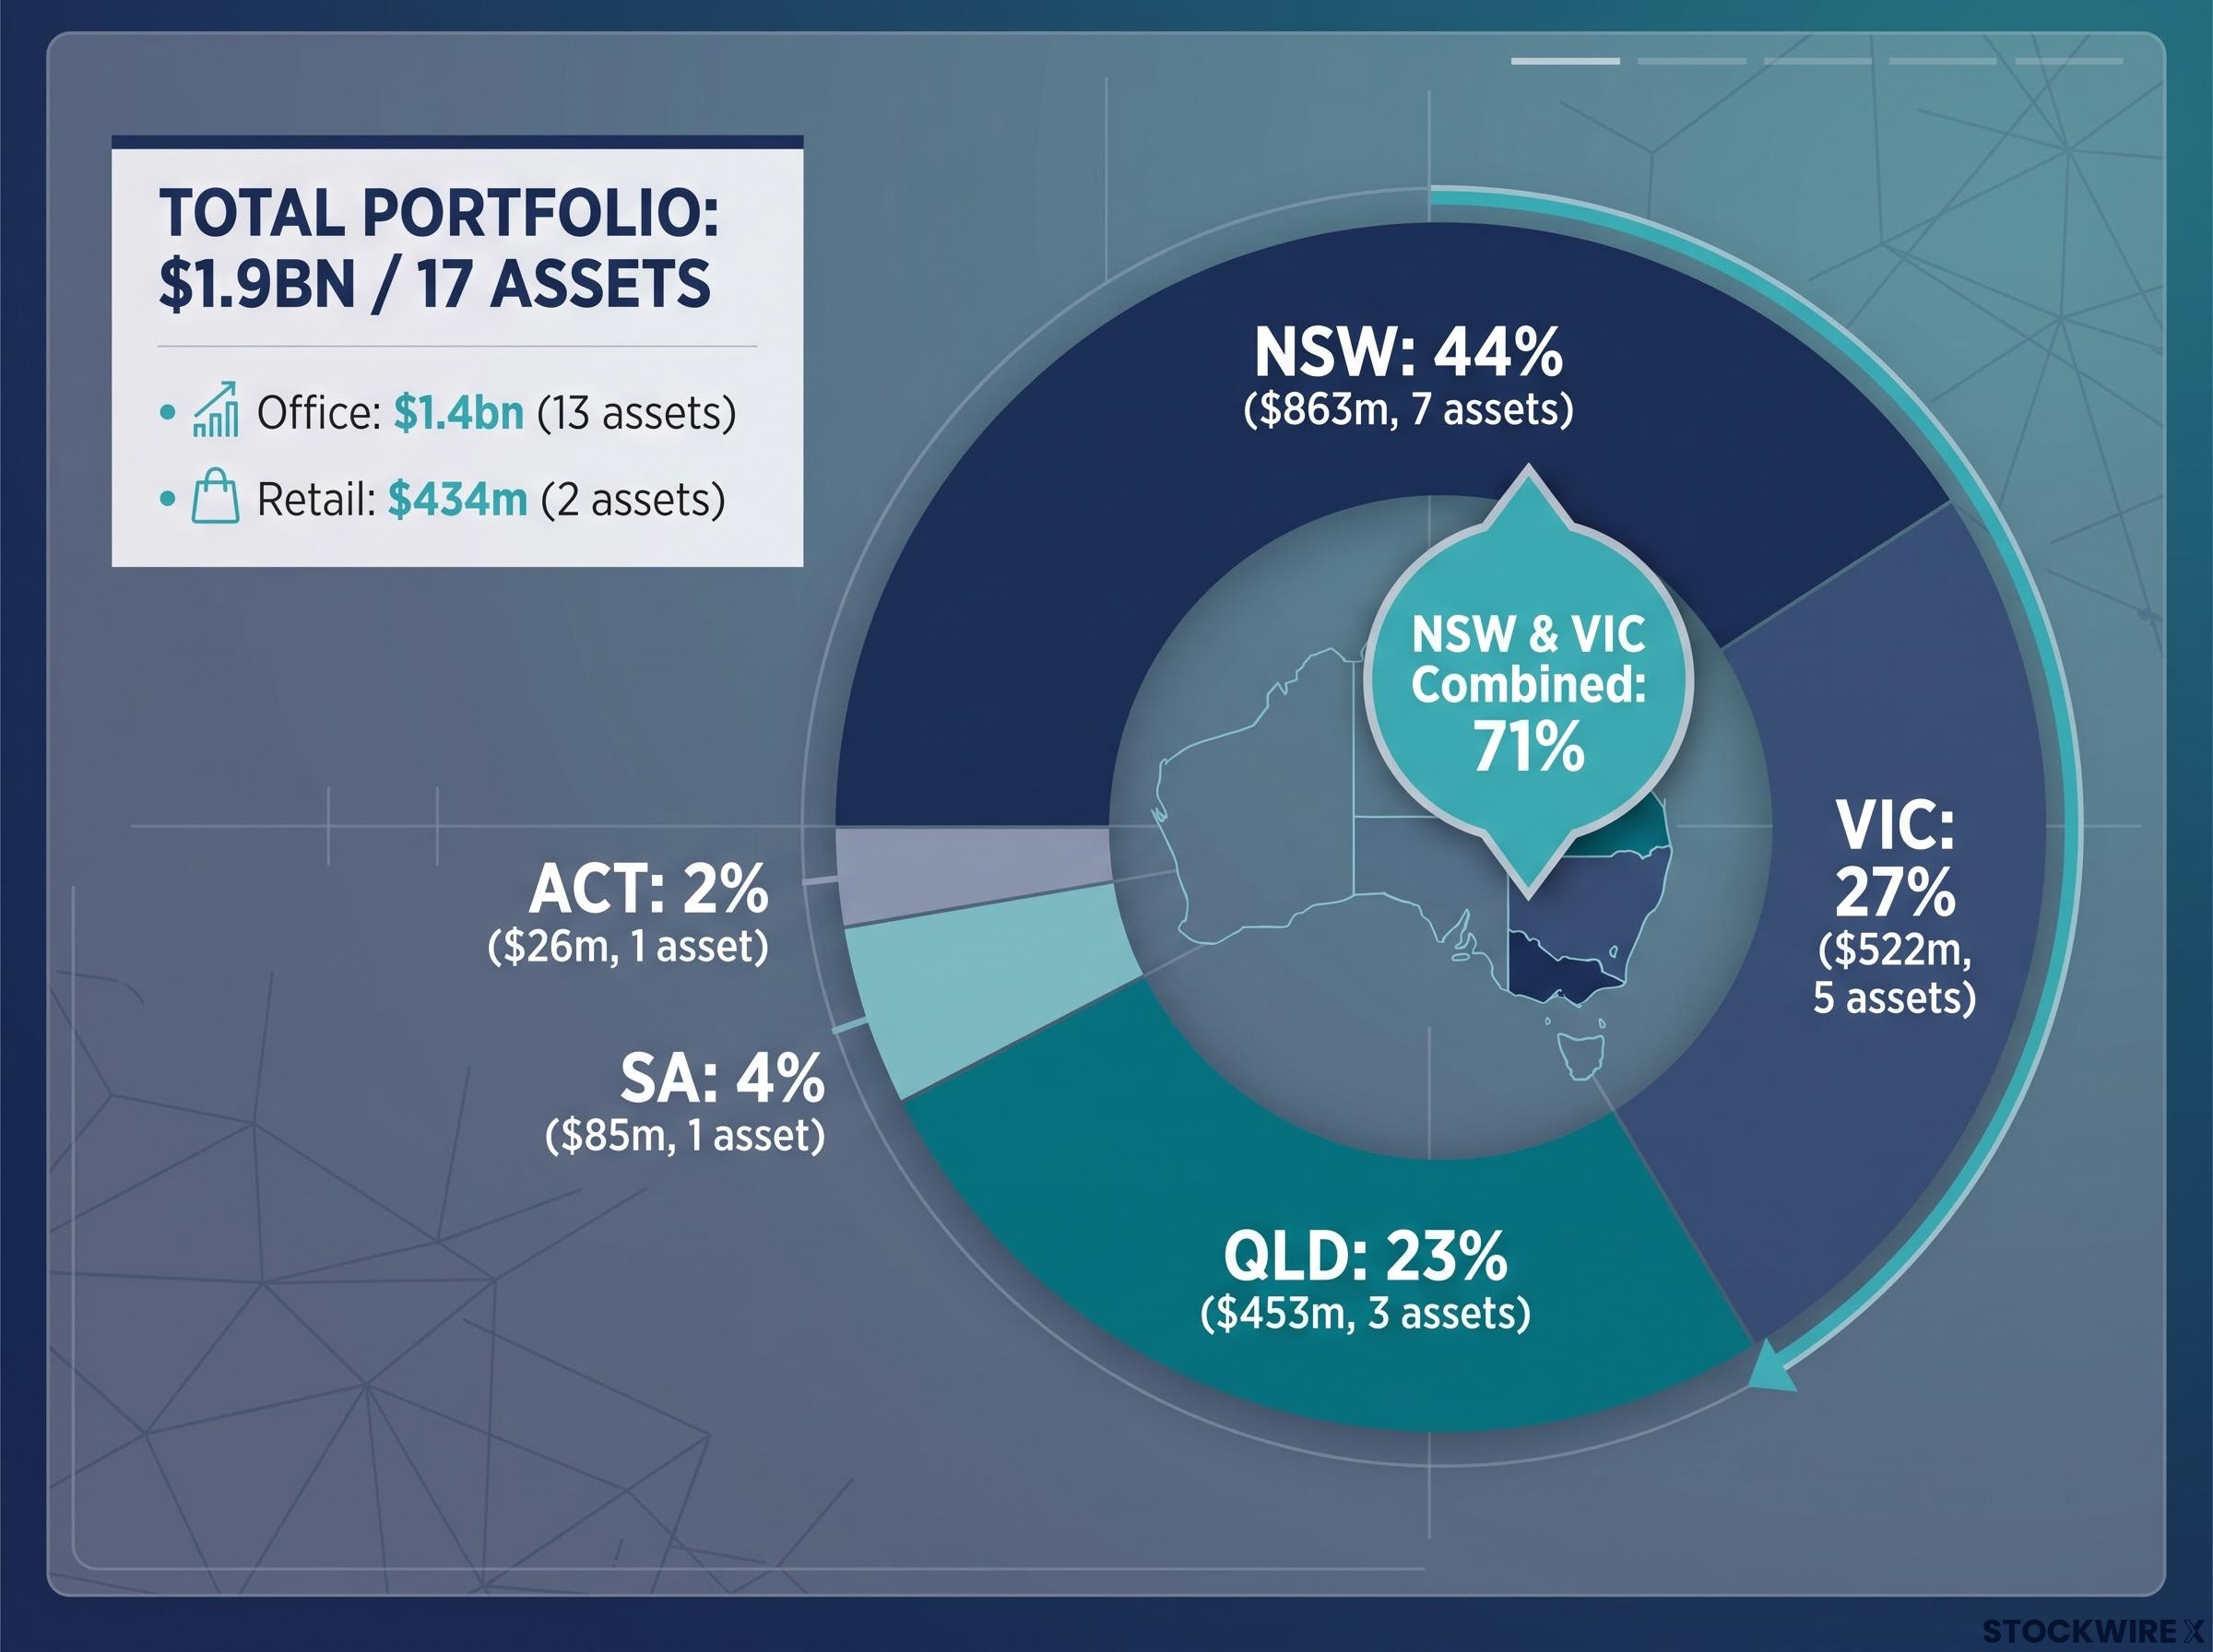
The portfolio breakdown showed office as the clear anchor, spanning 13 assets with a combined carrying value of $1.4bn. Retail accounted for 2 assets valued at $434m.
The document framed the strategy around premium, transport-connected assets in central business district (CBD) markets.
When big ASX news breaks, our subscribers know first
State-by-state portfolio breakdown
The FY26 Property Book set out the geographic distribution of the $1.9bn book across five states and territories, by both value and sector. New South Wales and Victoria dominated, together representing 71% of total portfolio value.
| State | % of Portfolio | Total Value | No. of Assets | Sector Split |
|---|---|---|---|---|
| NSW | 44% | $863m | 7 | 5 office ($796m), 2 other ($67m) |
| VIC | 27% | $522m | 5 | 4 office ($308m), 1 retail ($214m) |
| QLD | 23% | $453m | 3 | 2 office ($233m), 1 retail ($220m) |
| SA | 4% | $85m | 1 | 1 office ($85m) |
| ACT | 2% | $26m | 1 | 1 office ($26m) |
The concentration in high-barrier CBD markets across NSW, VIC and QLD reflects a quality-over-quantity approach, with smaller footprints held in SA and the ACT.
Office portfolio anchored by prime Sydney CBD assets
The office portfolio formed the core of the book, comprising 13 assets with a carrying value of $1.4bn. The marquee holdings sat in the Sydney and North Sydney CBDs, several positioned close to newly opened Metro stations, a recurring quality signal throughout the disclosure.
The flagship NSW office assets included:
-
99 Walker Street, North Sydney — $227m book value, 89.4% occupancy, 7.16% cap rate, positioned near the new Victoria Cross Metro Station.
-
77 Castlereagh Street, Sydney — $216m book value, 100% occupancy, 6.13% cap rate, sitting above Westfield Sydney and Pitt Street Mall.
-
201 Elizabeth Street, Sydney — $199m book value (32% interest), 84.6% occupancy, 6.38% cap rate, an A-Grade tower directly opposite the new Gadigal Metro Station.
-
14 Martin Place, Sydney — $120m book value (50% interest), 86.2% occupancy, 5.88% cap rate, featuring an eight-level heritage façade.
Diversification across VIC, QLD, SA and ACT
Beyond Sydney, the office holdings spread across Victoria, Queensland, South Australia and the ACT, with several assets recording strong operating metrics. Industry Lanes in Richmond reported 99.8% occupancy, while 2 King Street in Fortitude Valley carried a 6-star NABERS Energy rating and a 5.2-year WALE.
In Canberra, 51 Allara Street reported 100% occupancy and holds carbon neutral certification. The disclosure noted that one tenant, the Commonwealth of Australia (DCCEEW), vacated 1 July 2026.
Among the Victorian assets, 710 Collins Street in Melbourne reported 8.0% occupancy as at June 2026, presenting a potential lease-up opportunity within the book.
Understanding cap rates, WALE and NABERS — what the metrics mean for investors
Reading a property portfolio requires familiarity with three key real estate investment trust (REIT) metrics. Each offers a different lens on asset quality and income durability.
-
Capitalisation (cap) rate — the annual return an asset generates relative to its value. Lower cap rates, such as 5.88% at 14 Martin Place, typically signal higher-quality, premium-location assets. Across this portfolio, cap rates span 5.88% to 8.50%.
-
WALE (Weighted Average Lease Expiry) — the average time remaining until leases expire. A longer WALE points to more secure, predictable income.
-
NABERS rating — a sustainability benchmark measuring energy and water efficiency. Higher ratings increasingly matter to blue-chip tenants and environmental, social and governance (ESG) focused investors.
Together, these measures form the lens through which investors can assess the portfolio’s underlying quality and the resilience of its income streams.
Retail portfolio and tenant covenant strength
The retail portfolio comprised two assets with a combined carrying value of $434m, both underpinned by strong anchor tenants and high occupancy.
The Oasis in Broadbeach on the Gold Coast carried a $220m book value, 95.4% occupancy and a 6.50% cap rate, anchored by Woolworths. Significant capital works were completed over the past five years, positioning the centre for Gold Coast population and tourism growth.
Myer Bourke Street in Melbourne held a $214m book value (50% interest), 100% occupancy, a 6.00% cap rate and a 5.5-year WALE. The flagship Myer department store connects via multilevel walkways to Emporium Melbourne.
Blue-chip anchor tenants such as Woolworths and Myer, combined with high occupancy, underpin the defensive income profile of the retail holdings.
Quality tenant base across the portfolio
Strong tenant covenants featured consistently across both the office and retail assets. Notable customers disclosed in the FY26 Property Book included:
- State Government of NSW
- Commonwealth of Australia (DFAT)
- The World Bank Group / IFC
- ANZ
- Lendlease
- Johnson & Johnson
- Computershare
- Woolworths
- Myer
What the FY26 Property Book signals for investors
The disclosure painted a picture of a concentrated, quality-focused portfolio built around four recurring pillars: Eastern Seaboard weighting, transport-connected CBD assets, a blue-chip tenant base, and sustainability credentials across several buildings.
The FY26 Property Book sits within a broader strategic pivot: following binding agreements to sell ASK’s responsible entity, Abacus Group is transitioning to a pure-play commercial real estate investor mandate, with management flagging a range of options to further optimise the portfolio and capital structure.
Portfolio highlight
$1.9 billion across 17 assets, with 96% of the portfolio exposed to Australia’s Eastern Seaboard markets.
The document also revealed that lower-occupancy assets such as 710 Collins Street (8.0%) and 201 Elizabeth Street (84.6%) sit within an otherwise well-tenanted book.
Overall, the FY26 Property Book positioned Abacus as the holder of an income-durable, quality-weighted commercial portfolio anchored in Australia’s strongest metropolitan office and retail markets.
Don’t Miss the Next ASX Real Estate Move
Big News Blast delivers FREE breaking ASX announcements straight to your inbox within minutes of release, complete with in-depth analysis already done for you. Join 20,000+ investors staying ahead of the market across Finance, Real Estate and beyond. Click the “Free Alerts” button at Big News Blast to never miss market-moving news again.