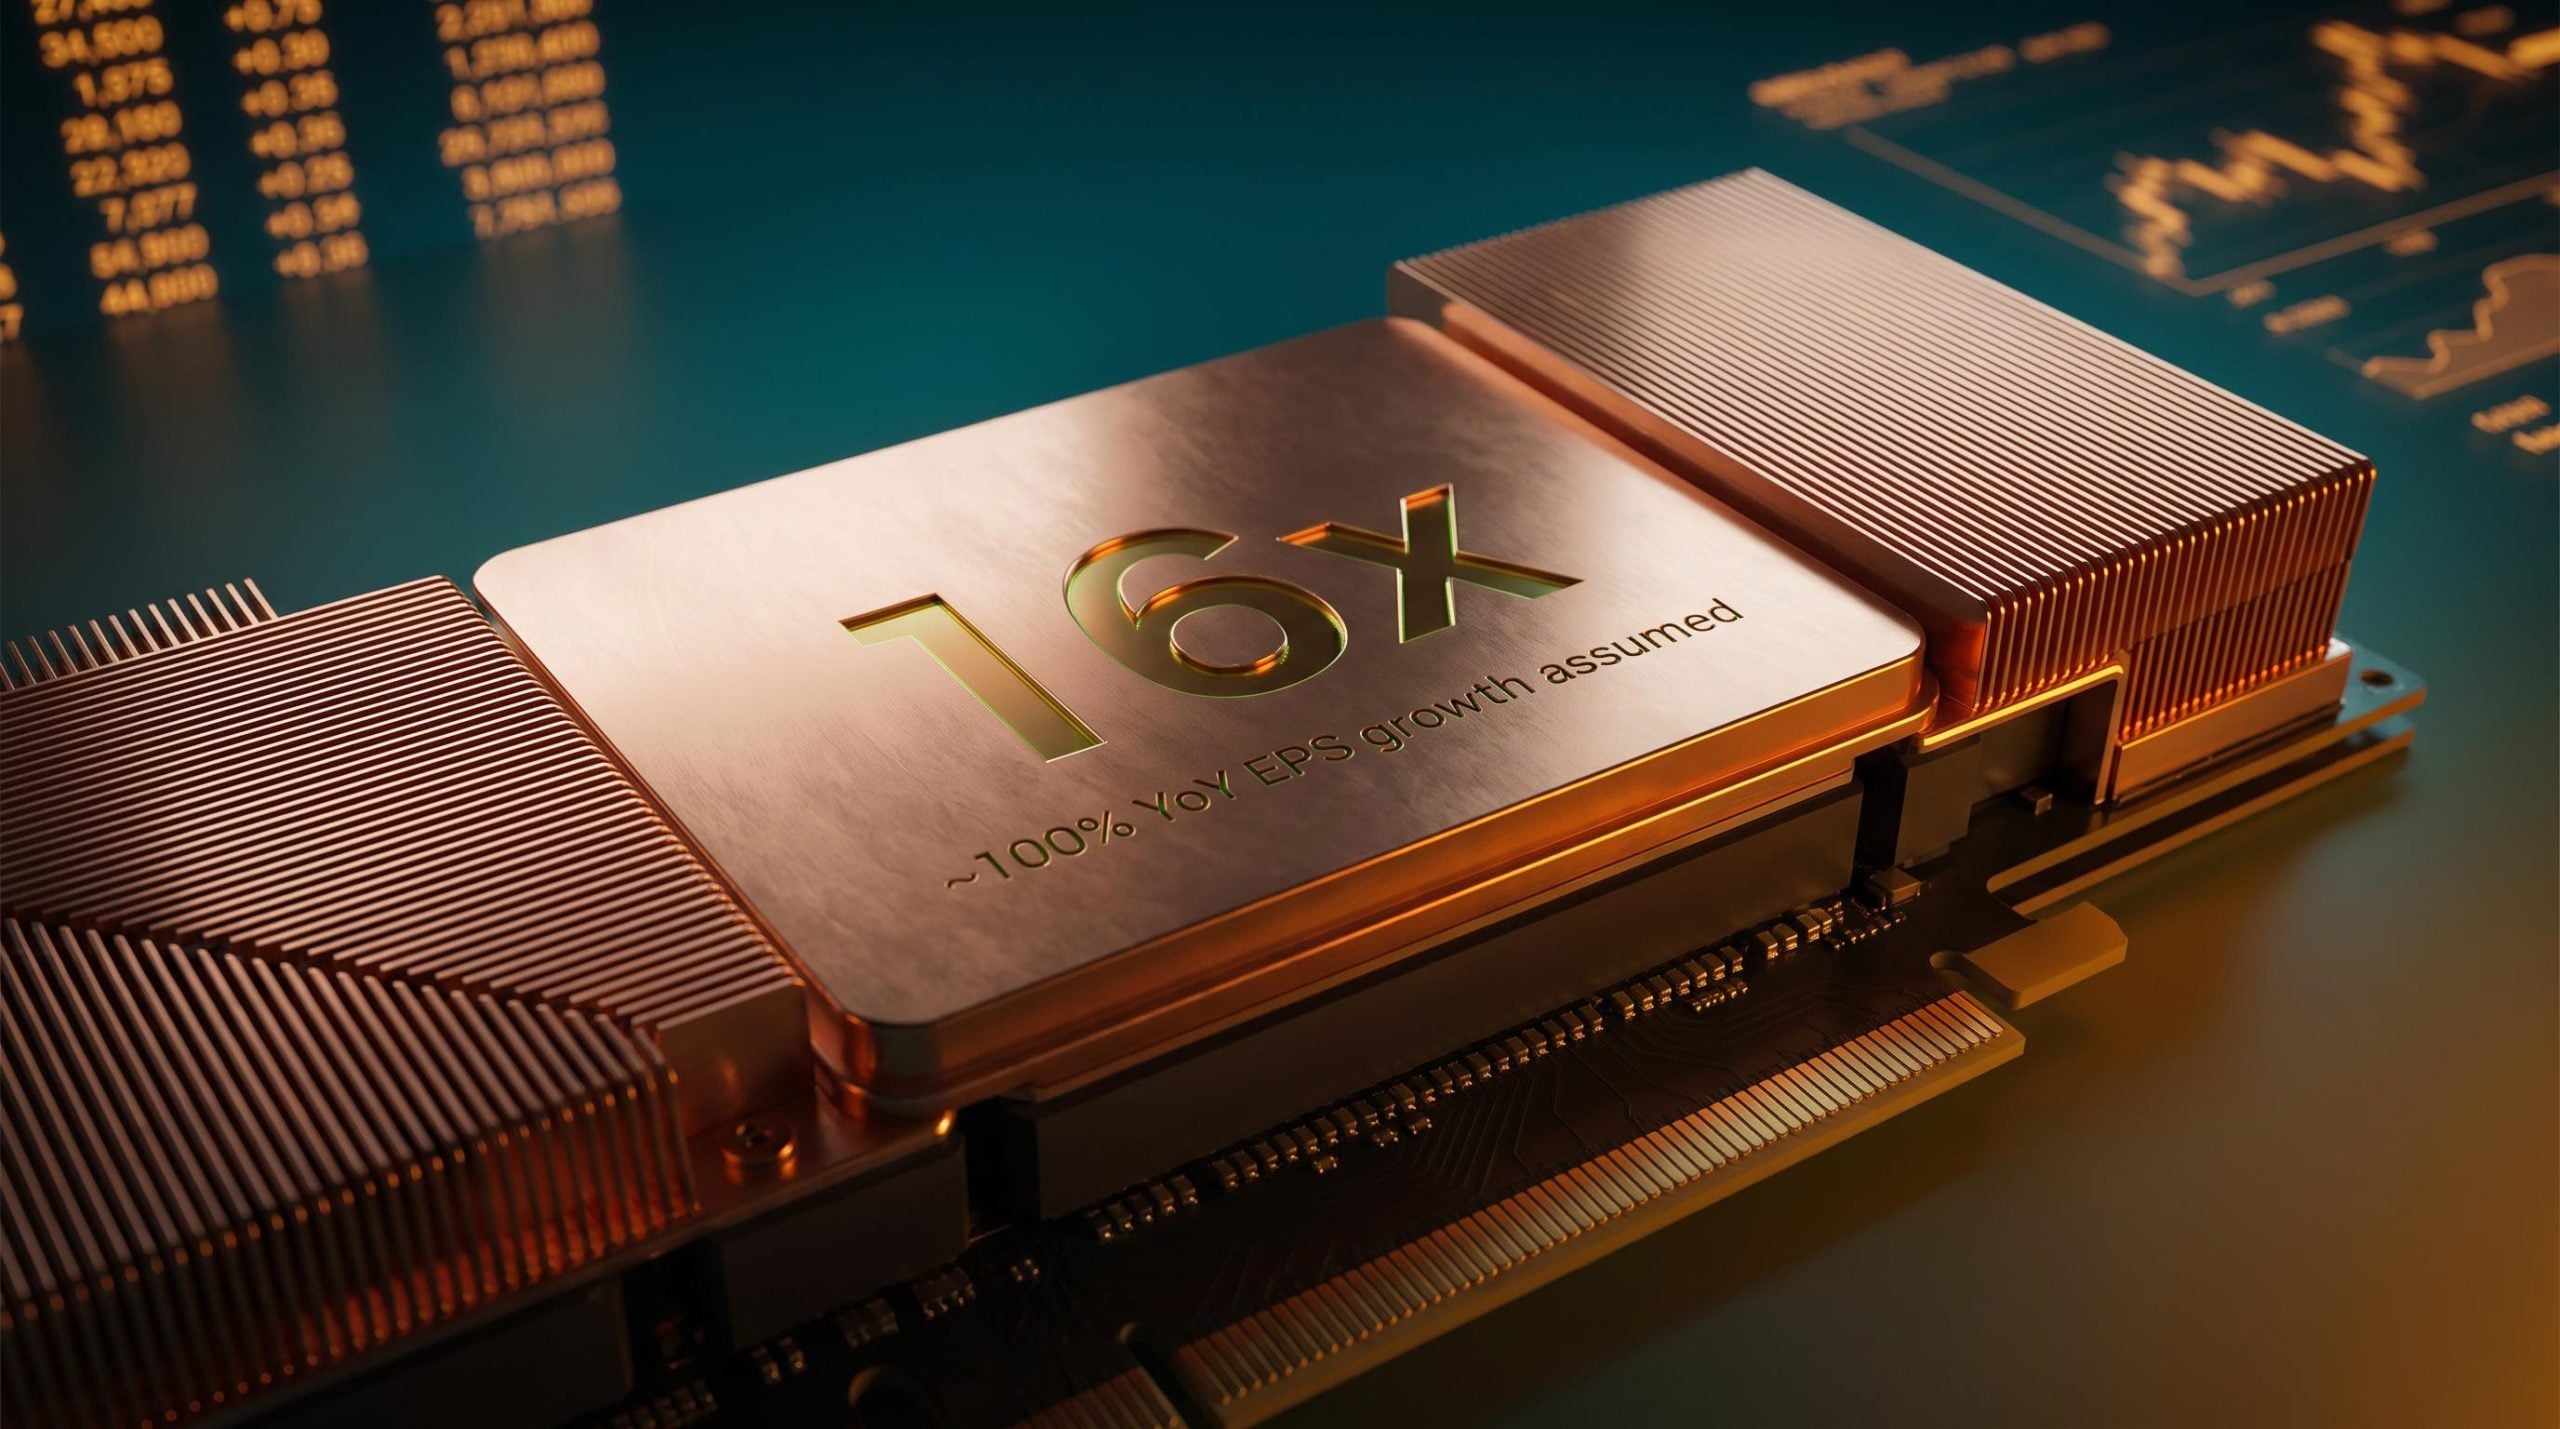
A forward price-to-earnings ratio of 16x looks cheap on paper. It is cheap on paper. The problem is the denominator: consensus estimates already assume Nvidia’s earnings per share will roughly double year-over-year in the quarter about to be reported. The multiple is not the anchor. The growth assumption underneath it is.
August 26, 2026 is the date that assumption gets tested. Nvidia reports fiscal Q2 FY2027 results after the market close, and it does so against a backdrop that has shifted since the last beat. The Philadelphia Semiconductor Index (SOX) has pulled back approximately 20% from its mid-year peak. The US semiconductor sector sits at an estimated $14.5 trillion in value. The question facing investors is not whether Nvidia dominates AI compute; it is whether the consensus growth assumptions that make its valuation look reasonable are going to hold.
Here is the framework for reading the August 26 print clearly. After this, you will know which specific metrics confirm the value-opportunity thesis and which expose the value-trap risk, so you can score the report in real time rather than react to the headline number.
Why Nvidia’s quarterly result moves an entire $14.5 trillion sector
Nvidia’s GPU and systems platforms sit at the centre of AI infrastructure, hyperscaler capital expenditure, and high-performance computing. That positioning makes its order trends a leading indicator for an entire supply chain. When Nvidia reports strong demand, the read-through ripples outward across:
- Memory suppliers, whose volumes track AI training cluster builds
- Networking companies, whose switch and interconnect orders follow data-centre expansion
- Substrate manufacturers, whose advanced packaging capacity is booked against GPU production schedules
- Equipment makers, whose tool orders reflect the next generation of fab investment
The Q1 FY2027 result, reported on 20 May 2026, beat on both earnings per share and revenue, reinforcing the narrative of sustained AI-driven demand. That beat raised the bar. The market now treats Nvidia strength as an expectation rather than an upside surprise, which means the margin for disappointment on August 26 is thinner than it was three months ago.
Hyperscaler AI capex commitments from the four largest cloud operators are projected to exceed $650 billion in 2026, nearly double 2025 levels, providing the demand backstory that underpins Nvidia’s order visibility and explains why a single quarterly print from one company can reprice an entire sector in a session.
The US semiconductor sector is valued at approximately $14.5 trillion. A single company’s quarterly print can reprice that entire complex in a session.
A portion of active fund managers currently hold limited Nvidia exposure, which creates latent buying pressure if results are favourable. What this tells you is straightforward: even if you do not own Nvidia directly, your positions in memory, networking, or equipment names are exposed to this print. The conference call begins at 5 p.m. ET on August 26. Everyone in the semiconductor complex is listening.
When big ASX news breaks, our subscribers know first
Unpacking the earnings assumptions that make the 16x forward PE hold together
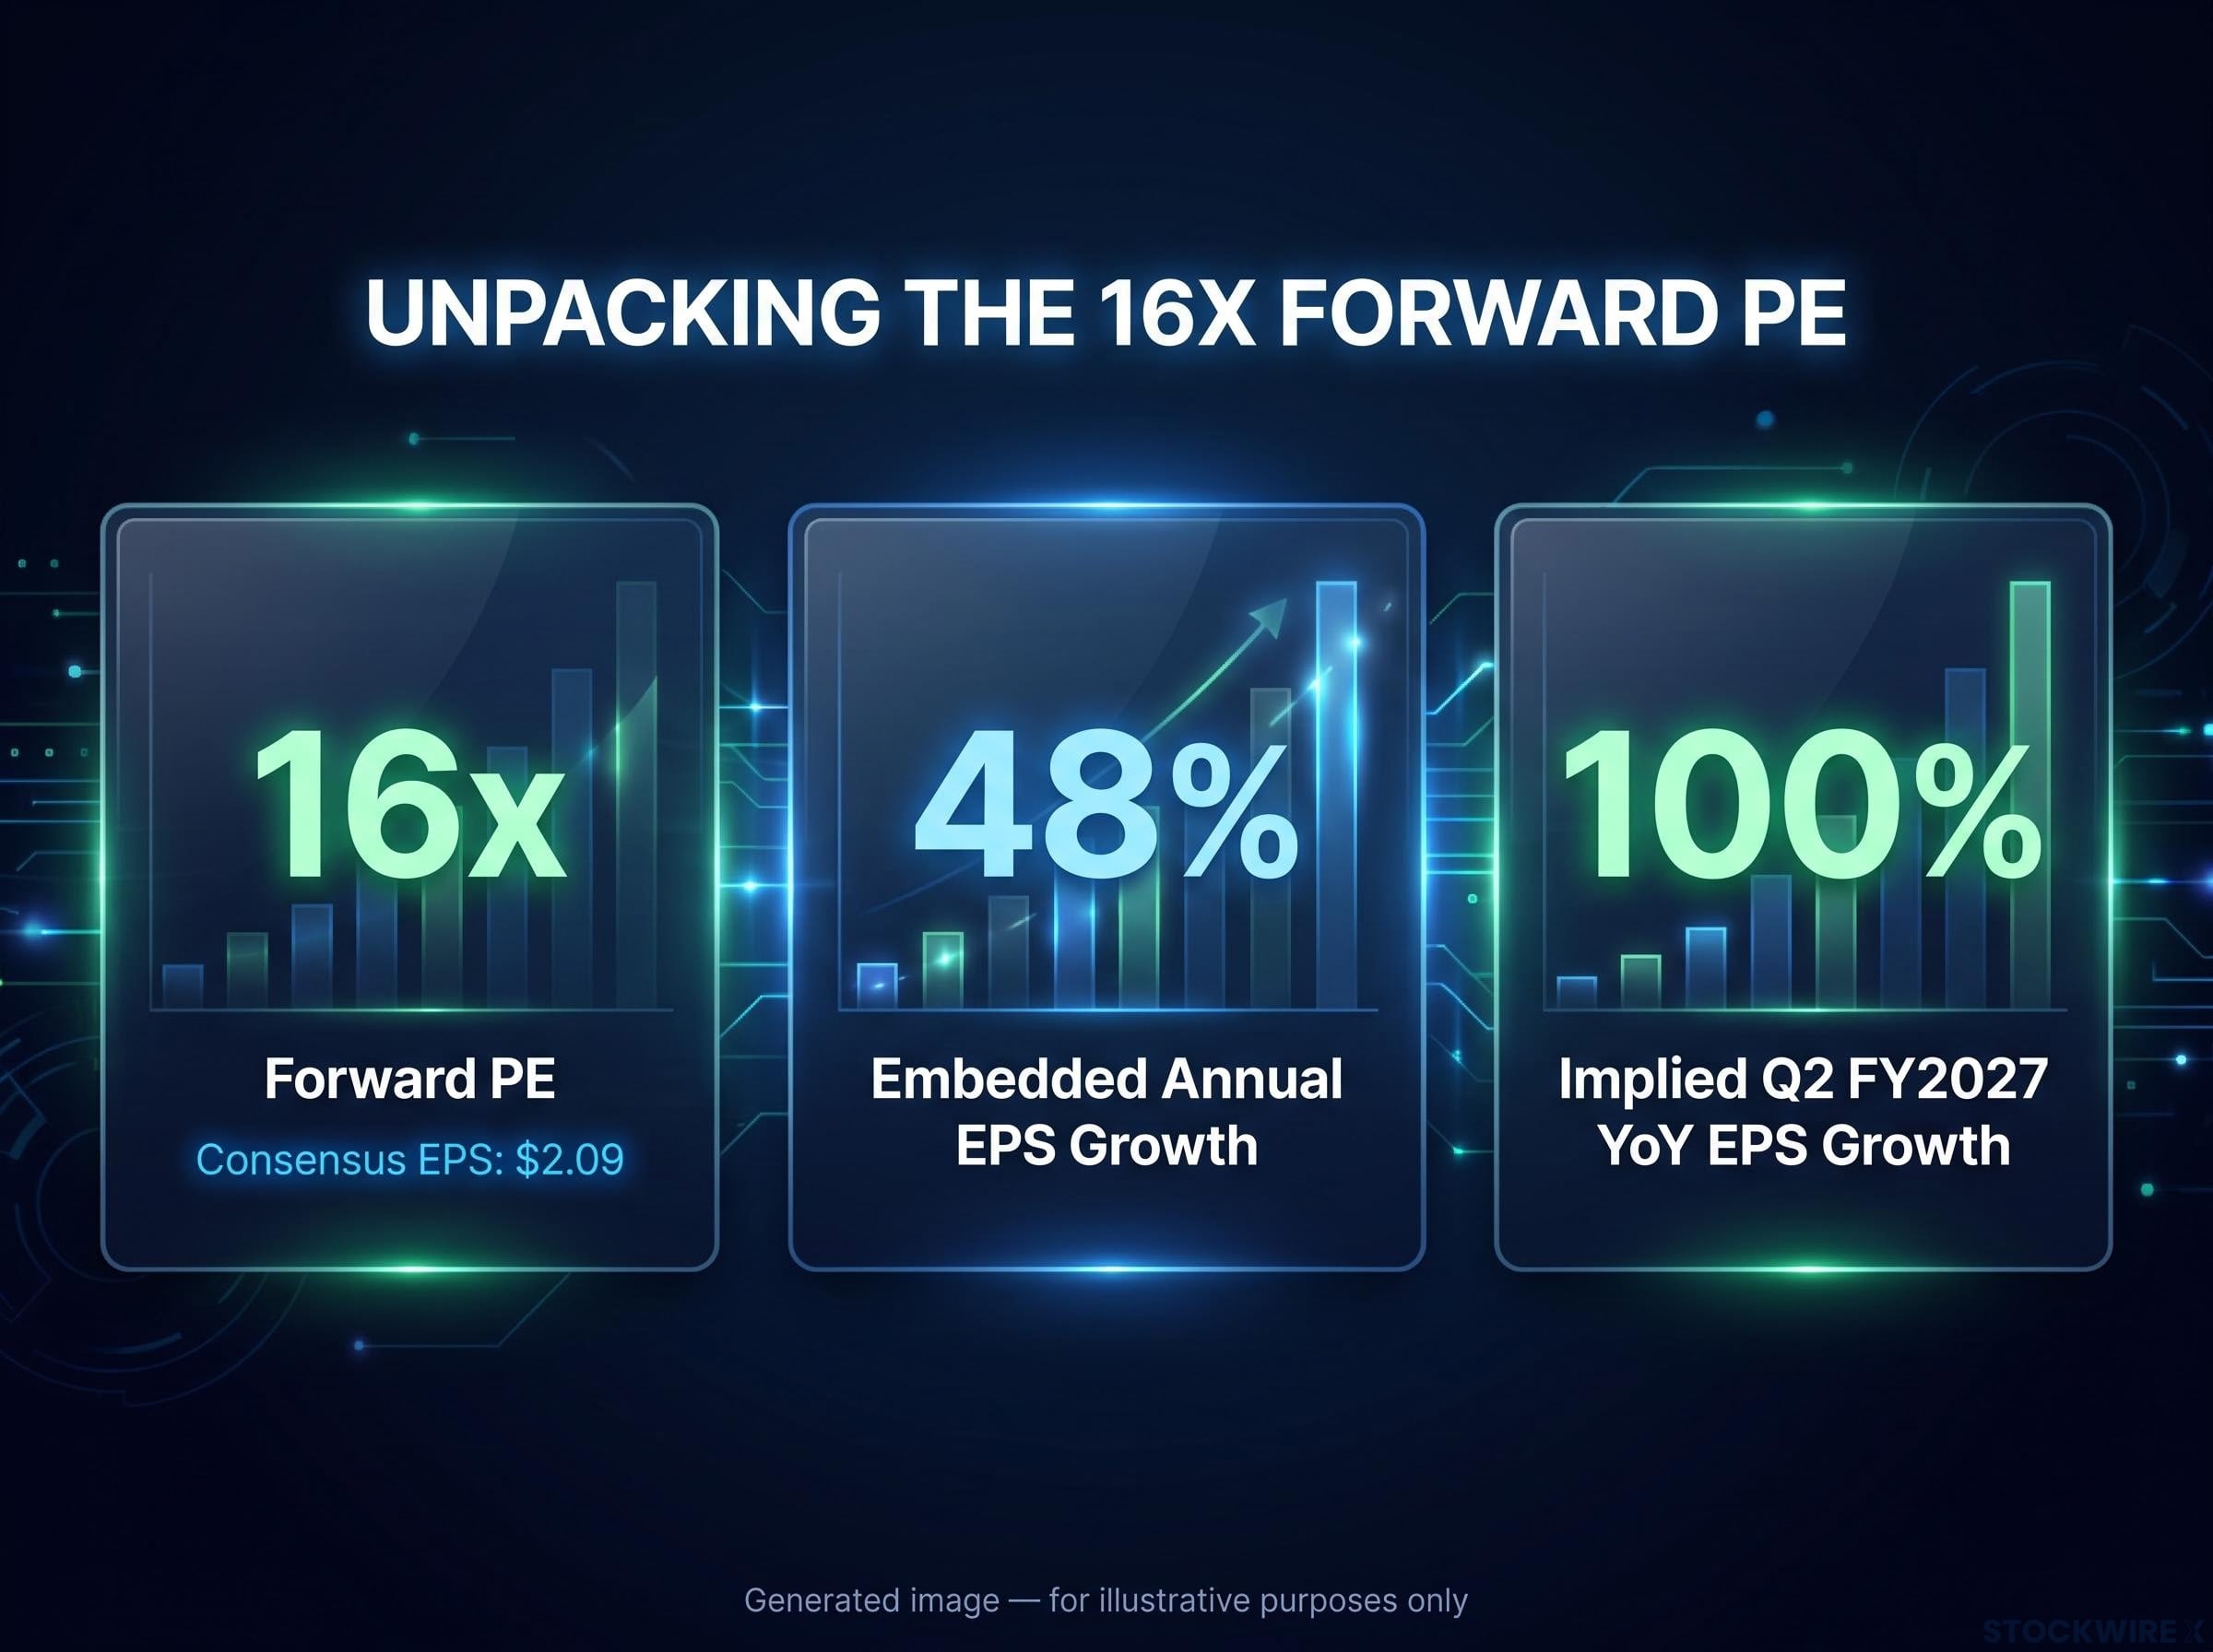
The 16x forward PE is a derived output. It is the result of dividing today’s share price by a consensus EPS estimate that already assumes approximately 48% annual EPS growth and roughly 100% year-over-year growth for Q2 FY2027 alone. The mechanical multiple is not where the risk lives. The earnings forecast beneath it is.
| Metric | Current figure | What it assumes |
|---|---|---|
| Forward PE | 16x (approximately a decade low) | Consensus EPS of approximately $2.09 holds |
| Annual EPS growth embedded in consensus | 48% | Sustained AI capex acceleration across hyperscalers |
| Q2 FY2027 implied EPS growth | Approximately 100% year-over-year | No demand deceleration or margin compression |
The bull case is real. If those growth assumptions hold, a mid-teens multiple on that earnings base could genuinely be attractive relative to Nvidia’s historical valuation range. The company has beaten estimates in recent quarters, and the AI infrastructure build-out shows no signs of structural reversal.
The 16x forward PE is a derived output, not a fundamental anchor. The real risk is in the optimism embedded in the consensus denominator.
The practical takeaway: anyone using the 16x figure as a buy signal without stress-testing the earnings assumptions underneath it is accepting more risk than the headline multiple implies. The multiple is only as strong as the denominator holding it up.
What the semiconductor pullback actually signals about sector positioning
A 20% pullback from a triple-digit one-year run sounds like a reset. It may not be one. Whether the SOX correction constitutes genuine value depends entirely on whether earnings estimates have reset alongside price. If consensus EPS forecasts have stayed aggressive while the index has fallen, the effective forward multiple after the decline may still be elevated once growth disappoints.
This is the ambiguity that makes sitting on the fence before the August 26 report analytically legitimate rather than indecisive. The data needed to resolve the question has not arrived yet.
Semiconductor positioning data from Bank of America shows active long-only overweights at approximately 20%, half the 40% peak recorded at the 2017 cycle high, which challenges the narrative that the SOX pullback is a speculative unwind rather than a valuation recalibration against genuine earnings growth.
The value-opportunity case
For investors with multi-year horizons and genuine tolerance for volatility, the setup has features worth examining:
- The sector has already corrected from exuberant highs
- Recent results have beaten forecasts
- Hyperscaler commitments (including the Marvell-Alphabet partnership discussed below) support the durability of AI infrastructure demand
- A mid-teens multiple on strong growth, if that growth materialises, is historically attractive
The value-trap risk
The counter-case is equally specific:
- Consensus estimates still embed approximately 100% year-over-year EPS growth for Nvidia in Q2 FY2027
- Margin compression from competition or product mix shifts would shrink the earnings denominator, mechanically expanding the effective forward multiple
- Guidance language pointing to slower hyperscaler capex or inventory digestion would challenge the entire denominator structure
- A 20% price correction may be insufficient to reset expectations after a triple-digit prior run
A 20% price correction is only a “reset” if the earnings assumptions under it have also moderated. Before treating the pullback as a margin-of-safety signal, check whether the estimates you are using have actually come down.
Understanding why Nvidia dominates AI compute and why that dominance is being contested
Nvidia’s position atop the AI compute stack was not built on hardware performance alone. Three layers of competitive advantage created the lock-in:
- Software ecosystem (CUDA): Developers wrote their AI training code on Nvidia’s CUDA platform, creating switching costs that compound with every model trained
- Manufacturing scale: Volume leadership across advanced nodes gives Nvidia cost advantages and supply priority that smaller competitors cannot match
- Data-centre systems integration: Nvidia sells complete systems, not just chips, which simplifies procurement for hyperscalers building clusters at speed
The data-centre segment has been the primary driver of recent revenue beats and margin elevation, with gross margins running above historical norms on the strength of AI product mix and pricing power.
That dominance is being actively contested. The custom silicon threat comes from the hyperscalers themselves:
- Google, Amazon, and Microsoft are investing in in-house accelerators because at hyperscale, even small per-unit cost savings compound enormously
- Inference workloads, which are growing faster than training workloads, are more amenable to custom silicon optimisation
- The Marvell-Alphabet warrant (covered in the next section) is concrete evidence that hyperscalers are committing multi-year capital to this strategy
For investors, this is not a binary question of whether Nvidia loses its position. It is a question of whether custom silicon adoption compresses Nvidia’s long-run growth rate from explosive to merely strong, and whether current consensus estimates have priced in that compression. The guidance language on August 26 will reveal how management characterises this competitive dynamic, and whether that characterisation reflects genuine confidence or managed messaging around a narrowing competitive window.
The custom silicon paradox at the centre of Nvidia’s competitive position is structural: the same $700 billion AI capex wave funding Nvidia’s order book is simultaneously bankrolling the in-house accelerator programmes at Alphabet, Amazon, and Microsoft that represent the most credible long-run threat to its pricing power.
What Marvell’s Alphabet deal reveals about the broader AI infrastructure bet
Marvell Technology’s expanded partnership with Alphabet puts a specific price tag on hyperscaler commitment to custom silicon. Two figures describe the same deal, and both can be true simultaneously.
Company announcements reference a potential commercial value of up to $120 billion across a five-year term, subject to contractual conditions. SEC filings describe a warrant giving Google the right to purchase up to approximately 59 million Marvell shares at an exercise price of $206.58 per share, with a total potential warrant value of approximately $12.2 billion if fully exercised.
Marvell’s 8-K SEC filing confirms the warrant covers 58,970,907 shares at an exercise price of $206.58, with vesting tied to time-based milestones, discretionary purchase commitments, and revenue from jointly developed products, giving the headline figures a specific contractual foundation rather than a promotional framing.
The $120 billion figure represents the broader commercial revenue potential of the relationship over five years. The $12.2 billion reflects the financial value of the equity warrant instrument specifically. Both figures refer to the same deal.
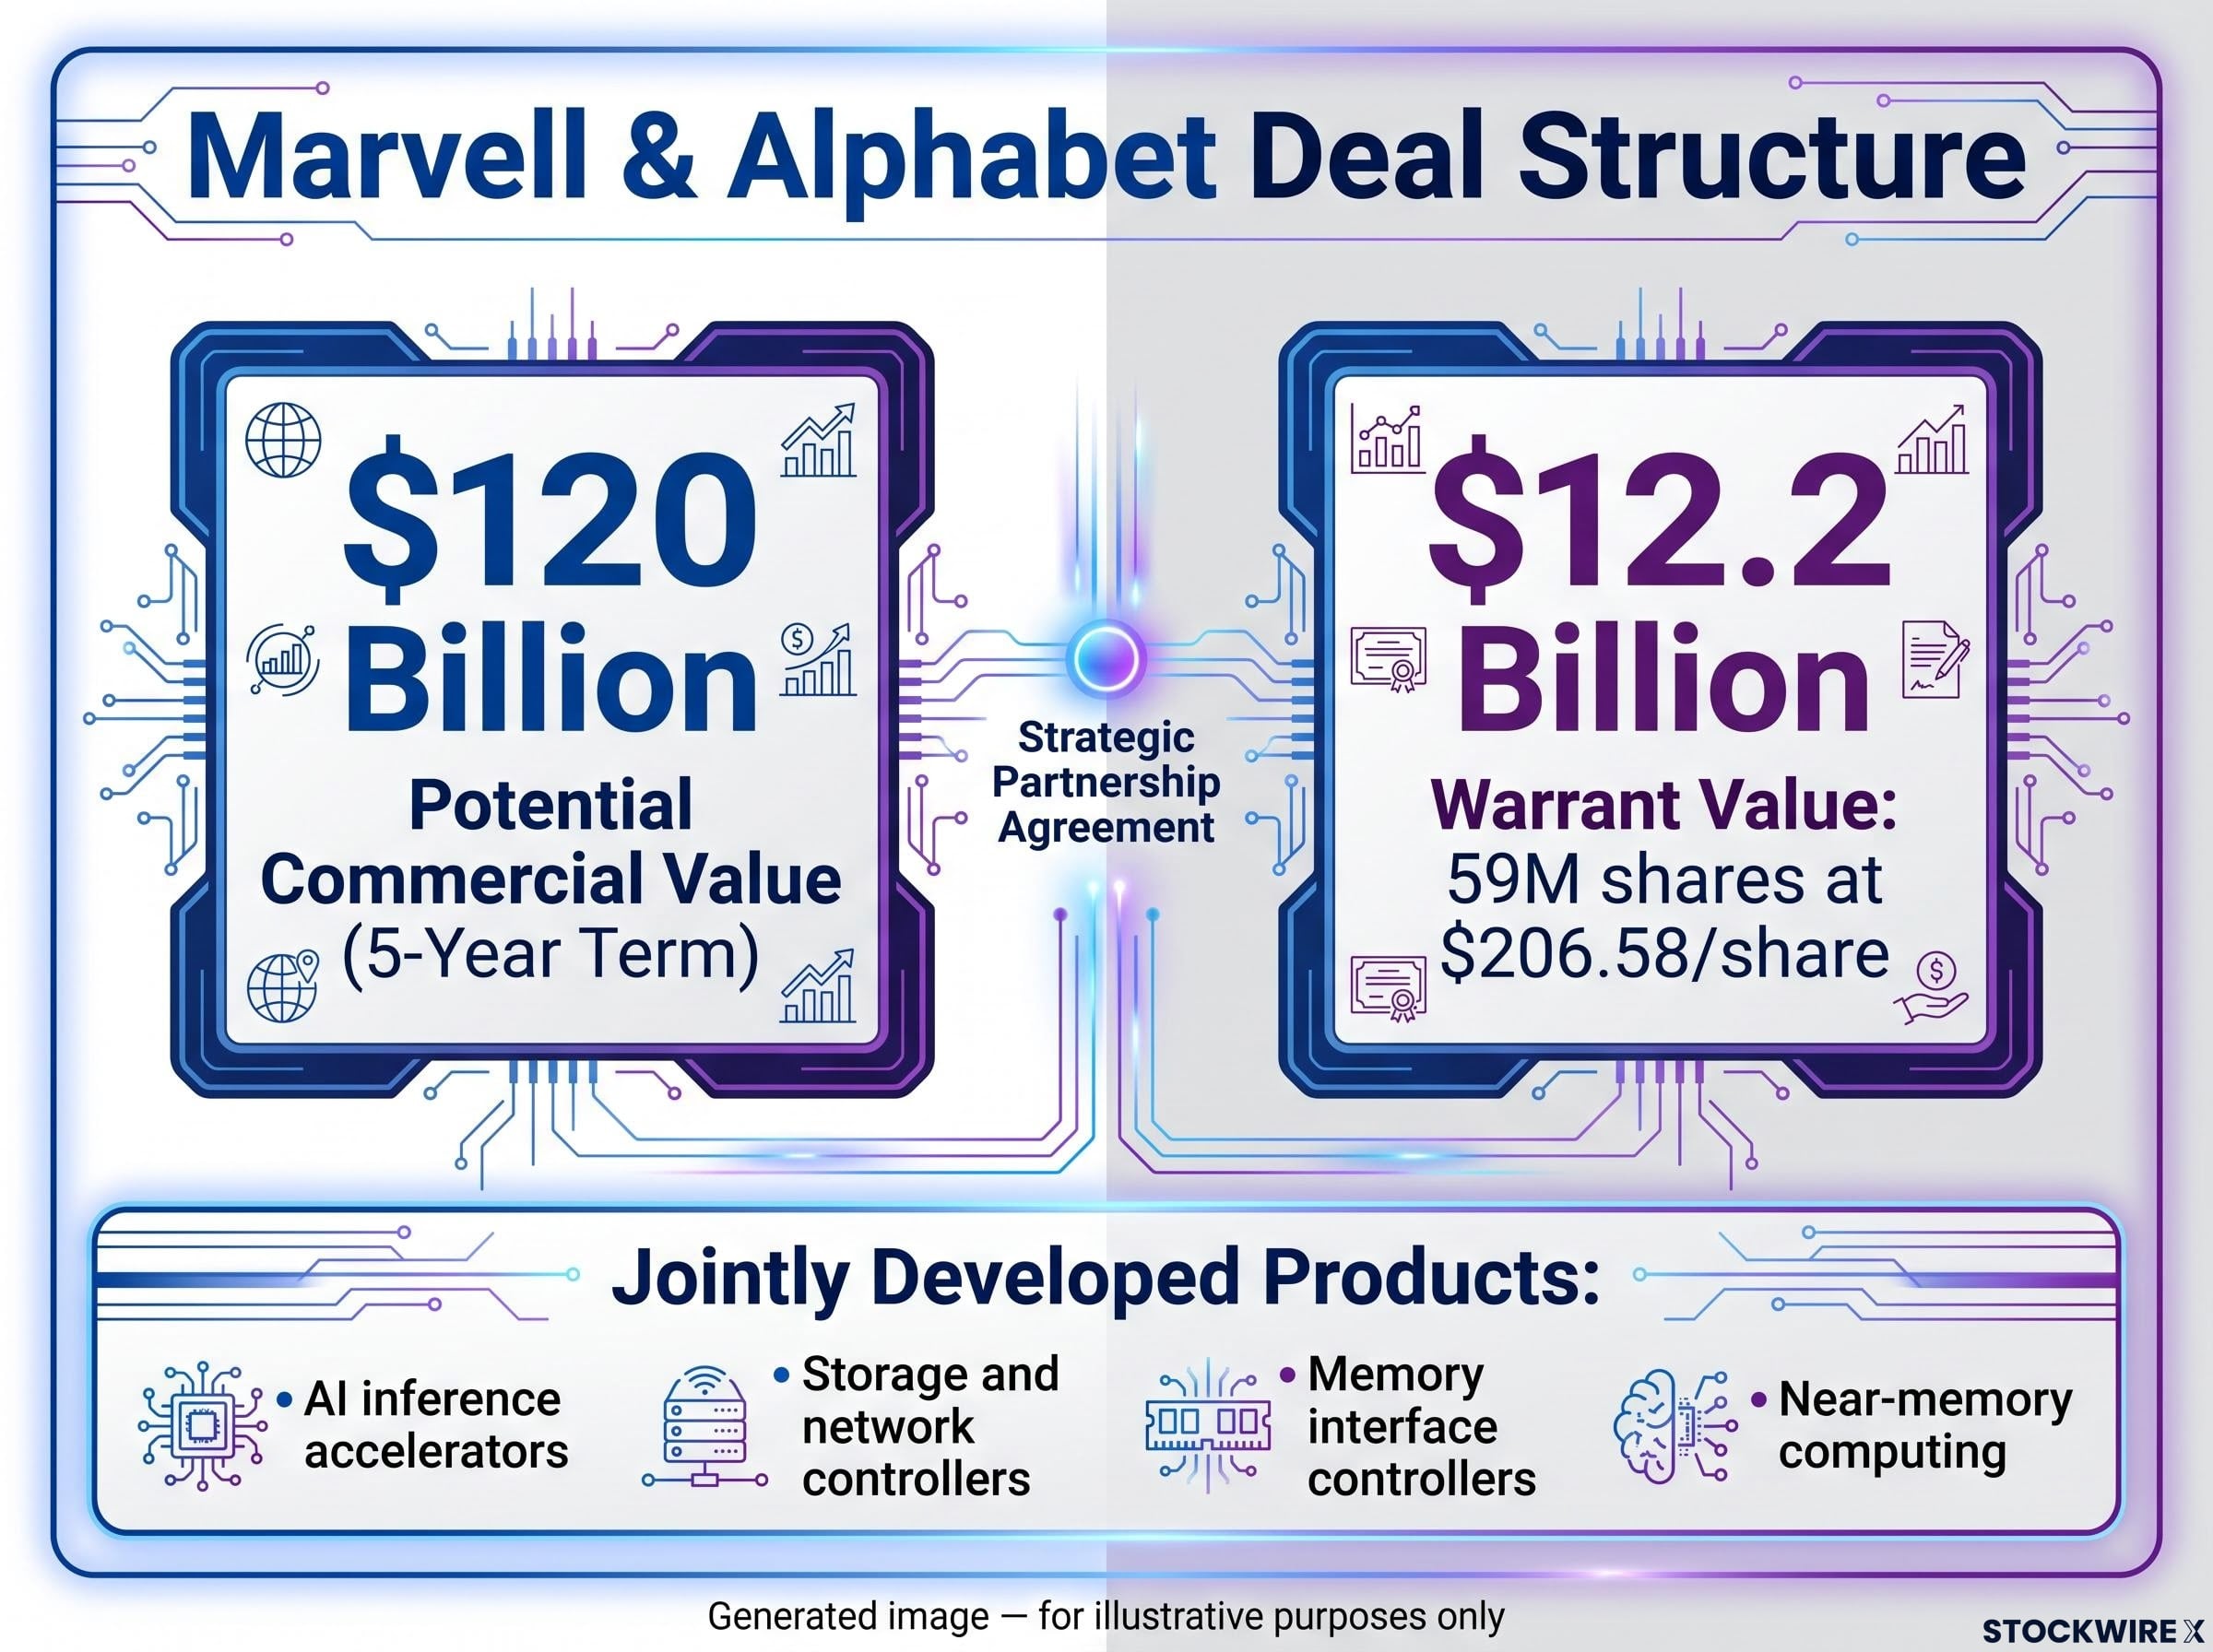
The warrant’s vesting structure is the signal that matters more than either headline number. Vesting conditions include time-based milestones, discretionary purchase commitments, and revenue from jointly developed products spanning AI inference accelerators, storage and network controllers, memory interface controllers, and near-memory computing. Google is not placing a speculative bet. It is structurally committing across multiple years.
| Timeframe | Marvell share performance |
|---|---|
| Single session (most recent) | +5.8% |
| Five trading days | +12% |
| Year-to-date | Approximately +190% |
| From June high | Approximately -18% |
Marvell shares have gained roughly 190% across 2026, though the stock has since retreated approximately 18% from its June peak, leaving investors weighing a substantial year-to-date run against a meaningful recent drawdown.
What this deal tells you about the broader sector is clear: hyperscaler demand for specialised silicon is not slowing. The debate is purely about pace and pricing power, and Nvidia’s guidance on August 26 will sharpen that picture significantly.
Five metrics that will define the August 26 verdict
The headline EPS number will get the after-hours reaction. These five metrics will determine whether that reaction holds by the following morning. Each one maps to the value-opportunity or value-trap interpretation established earlier.
- Data-centre revenue growth: The primary engine of recent beats. Any deceleration challenges the hyper-growth narrative directly.
- Gross margin trajectory: Elevated margins have supported the path to consensus earnings. Compression signals that path is narrowing.
- Forward guidance (Q3 FY2027 outlook): Management’s language around customer purchasing cycles, inventory levels, and deployment timelines reveals visibility.
- Customer and ecosystem commentary: Hyperscaler and enterprise AI spending plans are the read-through for the entire sector. Subtle shifts in phrasing matter as much as numbers.
- Competitive and custom silicon framing: How management characterises the in-house accelerator threat tells you whether pricing power is secure or beginning to erode.
| Metric | What to watch | Bullish signal | Bearish signal |
|---|---|---|---|
| Data-centre revenue | Sequential and year-over-year growth rate | Acceleration or sustained beat versus consensus | Deceleration, especially below street estimates |
| Gross margins | Direction versus prior quarter and guidance | Stable or expanding on favourable product mix | Compression from competition, costs, or mix shift |
| Forward guidance | Q3 FY2027 revenue and margin outlook | Above-consensus guide with expanding deployment language | References to “normalisation,” inventory digestion, or shorter visibility |
| Customer commentary | Hyperscaler and enterprise spending visibility | Multi-quarter commitments, larger AI cluster builds | Shorter order books, cautious phrasing, delayed programmes |
| Competitive framing | Custom silicon and alternative architecture discussion | Confidence in ecosystem stickiness, expanding use cases | Defensive tone, vague differentiation, conceding workload categories |
The gross margin line deserves particular attention because of its mechanical relationship to the valuation discussion. Margin compression shrinks the earnings denominator, which expands the effective forward multiple even if the share price stays flat. That is how a 16x multiple becomes a 20x multiple without the stock moving.
Pay attention to whether Nvidia’s forward guidance language on hyperscaler demand aligns with the multi-year commitment signal from the Marvell-Alphabet deal. If the two are consistent, the structural demand thesis holds. If they diverge, that gap is itself an analytical signal worth investigating.
Read these five metrics together rather than anchoring on any single beat or miss. Each is a chapter in the same story: whether the earnings growth assumptions baked into the 16x forward PE are going to hold or crack.
What the August 26 print will not settle, and what to do before it does
Nvidia’s numbers on August 26 will clarify whether the embedded growth assumptions are intact for the near term. Even a strong beat, however, will not eliminate the longer-run custom silicon and competitive compression risk discussed throughout this analysis. A single quarter does not close a multi-year structural debate.
For investors who want to map the August 26 print onto a broader cycle framework, our dedicated guide to semiconductor cycle positioning covers the five leading indicators that distinguish a mid-cycle correction from a structural peak, including how to sequence de-risking across memory, foundry, and logic positions before the 2027-2029 supply wave arrives.
The positioning logic depends on two variables that only you can define: your time horizon and your maximum tolerable drawdown. A short time horizon paired with low volatility tolerance produces different positioning logic than a long horizon paired with high tolerance, regardless of what the report shows. The same set of Nvidia numbers can constitute a buy signal for one investor and a hold-and-wait signal for another.
Before the close on August 26, consider this practical checklist:
- Verify your time horizon and write it down
- Stress-test the earnings assumptions beneath the 16x multiple; check whether the consensus estimates you are relying on have actually been revised since the pullback
- Identify which of the five metrics from the prior section matter most for your specific thesis
- Note Marvell’s upcoming earnings report as a corroborating or contradicting data point shortly after Nvidia’s print
The pre-report positioning window runs from August 21-26. The report drops after the close on August 26, with the conference call at 5 p.m. ET. Forward guidance will cover Q3 FY2027.
This article is for informational purposes only and should not be considered financial advice. Investors should conduct their own research and consult with financial professionals before making investment decisions. Past performance does not guarantee future results. Financial projections are subject to market conditions and various risk factors.