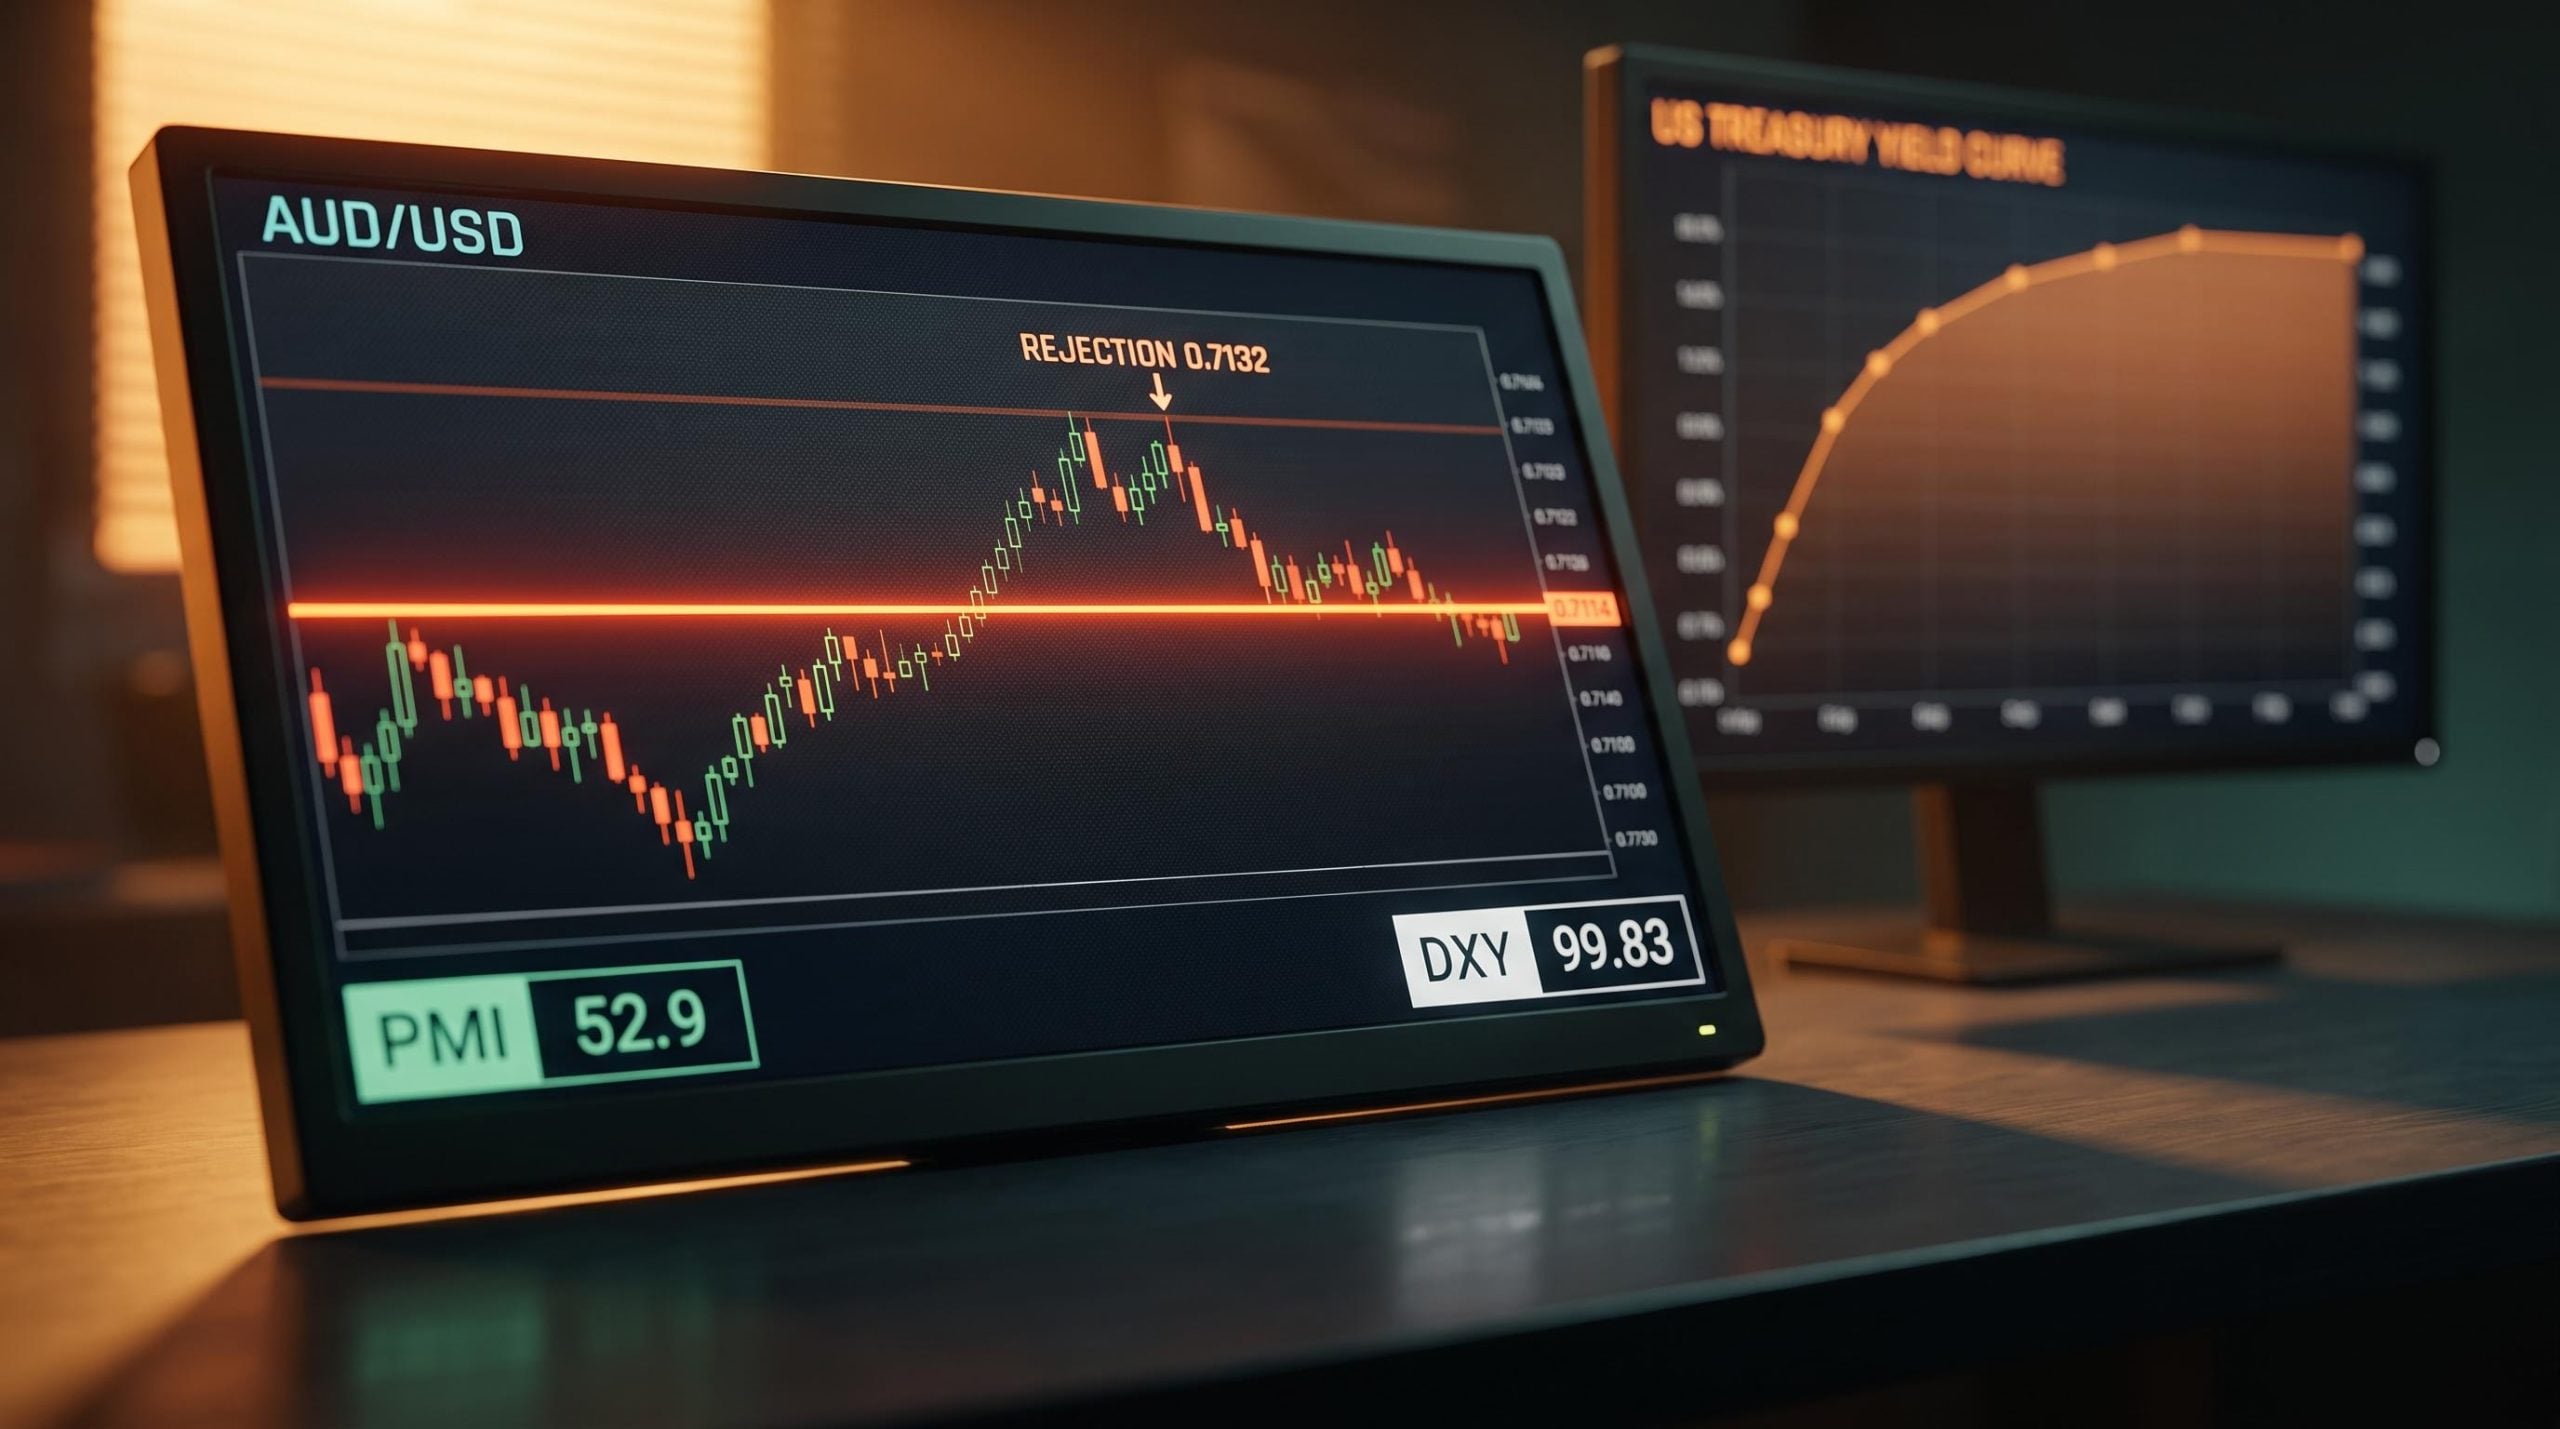
Australia’s economy just printed expansion-level PMI data across both manufacturing and services. AUD/USD fell anyway. That is not a contradiction; it is a lesson in how currency pairs actually work, where the US side of the equation can overpower positive domestic fundamentals entirely.
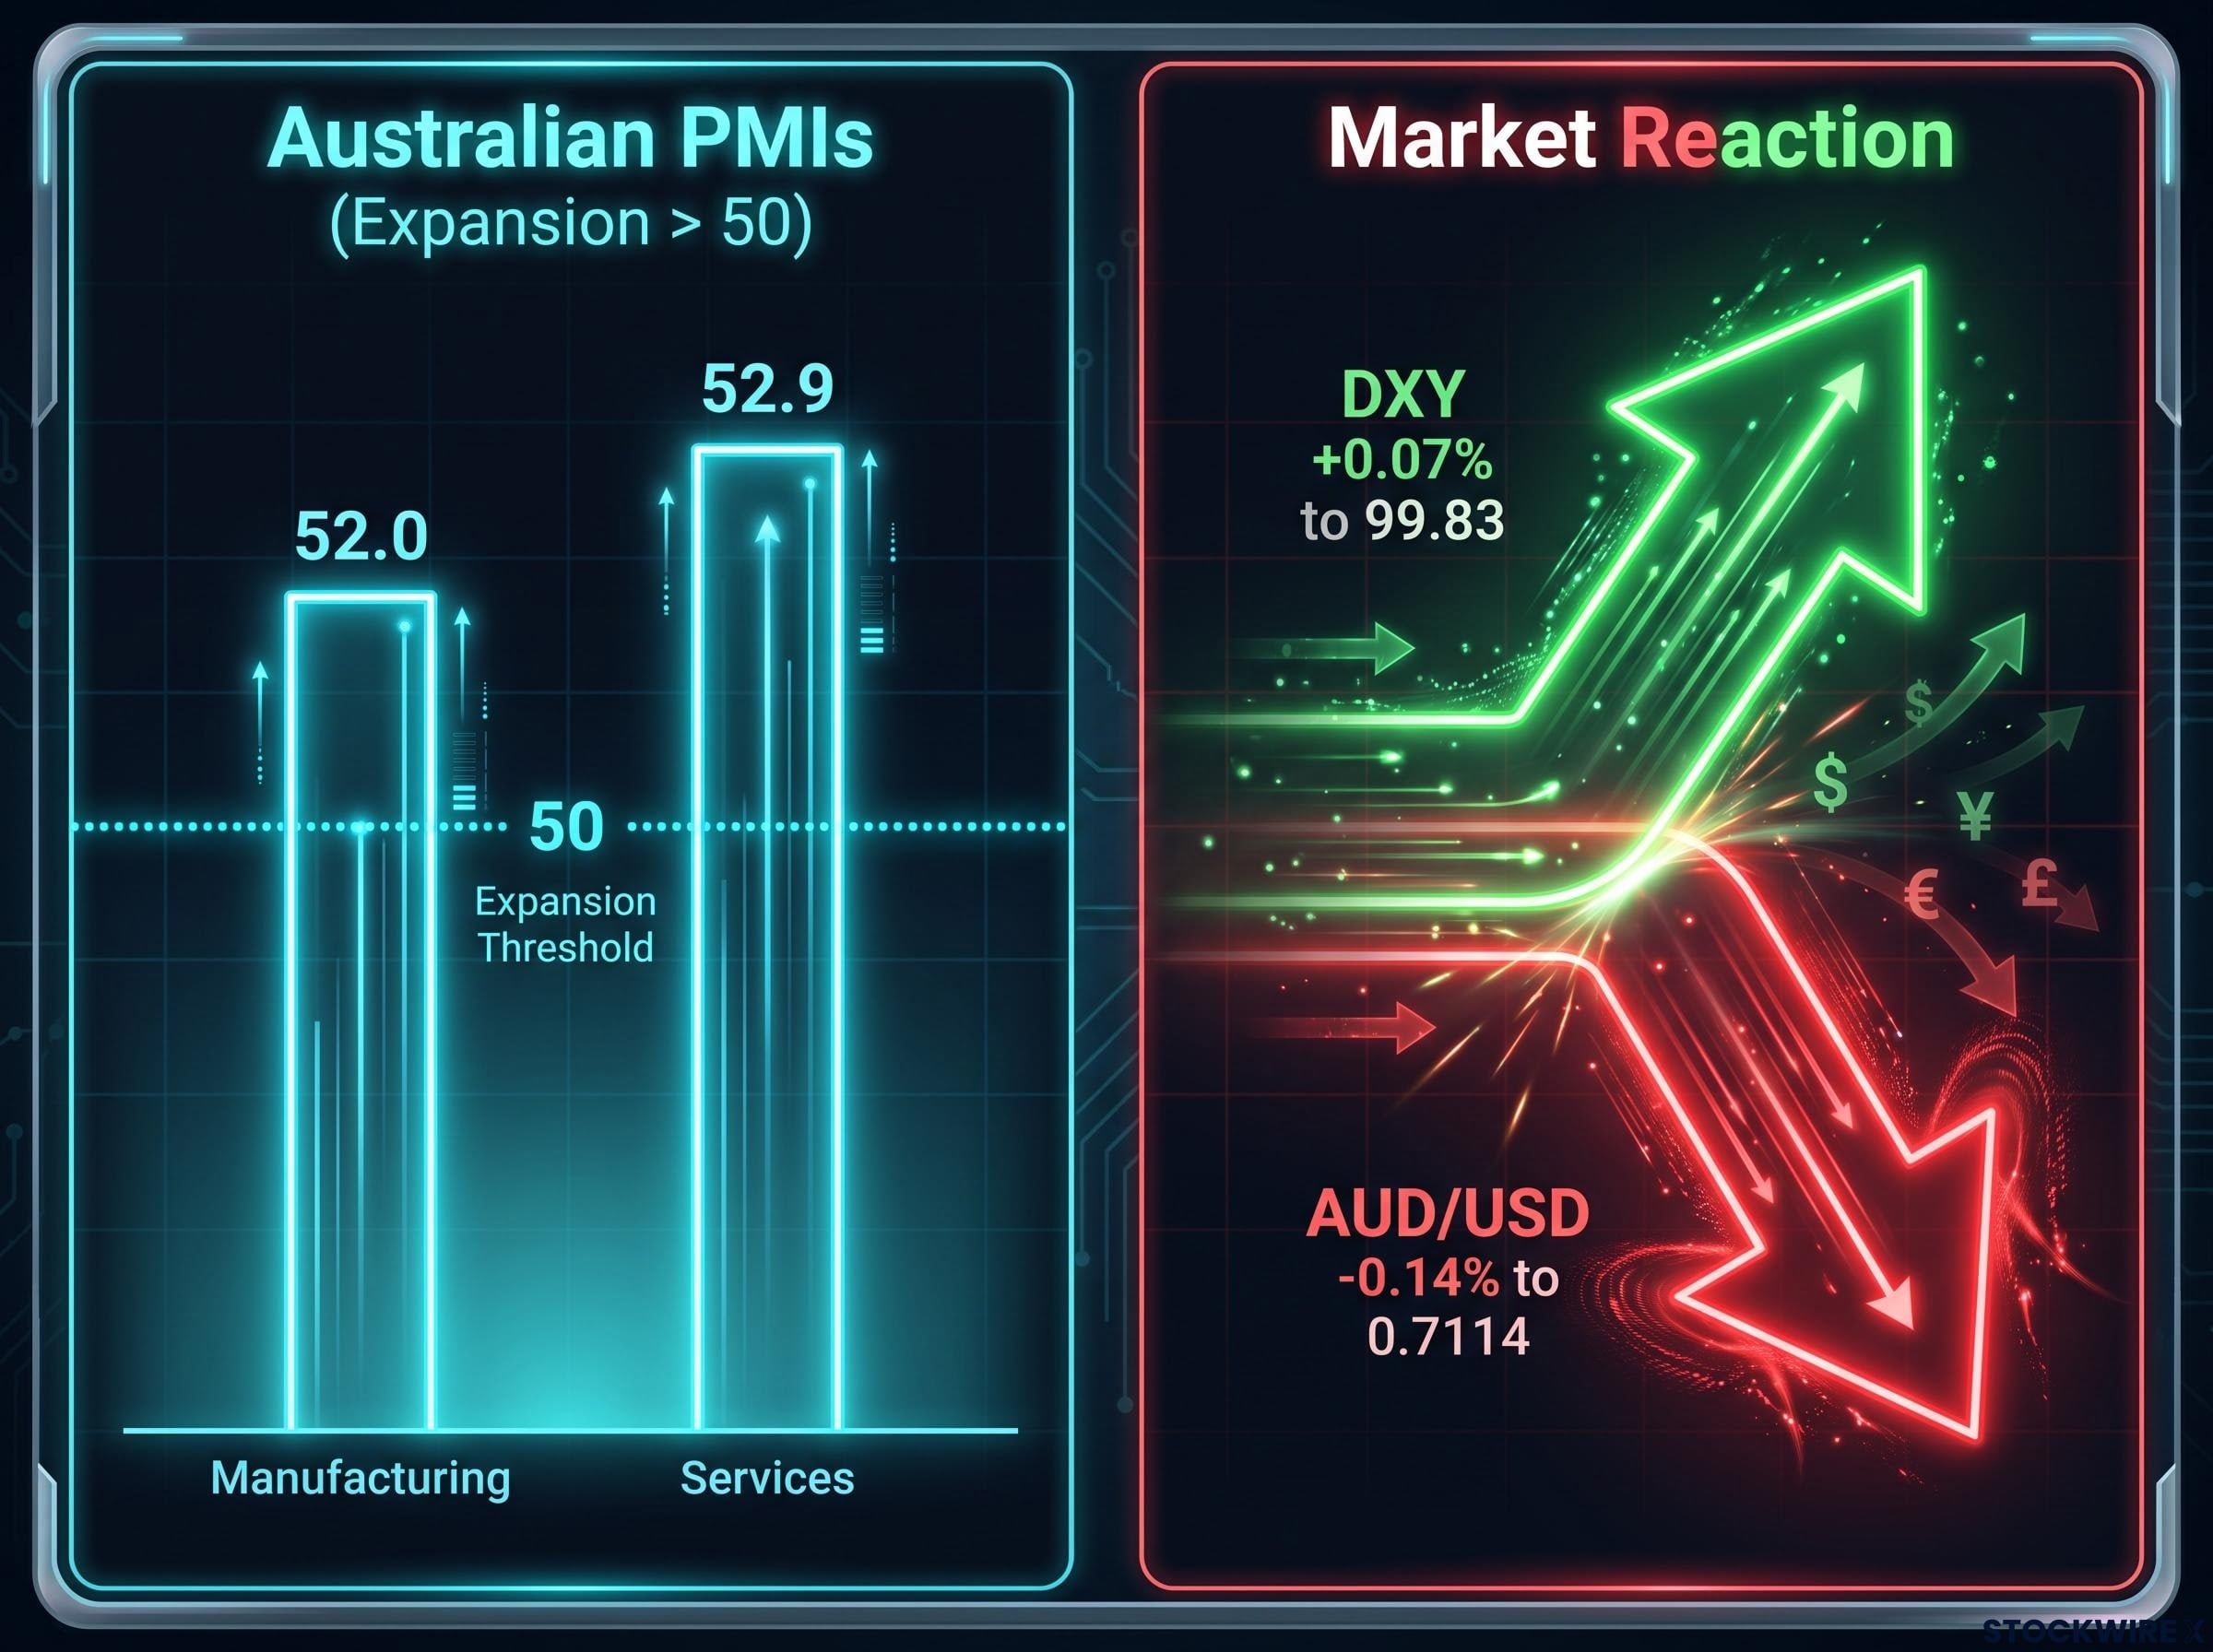
The session snapshot tells the story. AUD/USD was trading at 0.7114 on 20 August 2026, retreating from a weekly high of 0.7132 as rising US Treasury yields firmed the US Dollar Index (DXI) by 0.07% to 99.83. Australian manufacturing PMI held at 52.0 and services came in at 52.9, both above the expansion threshold, yet neither could provide directional lift against a strengthening greenback.
Here is the framework for understanding exactly what this pullback means technically, which price levels define the pair’s structure right now, where momentum sits, and how to evaluate whether today’s retreat is a buying opportunity or an early warning that deserves caution.
When good data is not enough: what drove AUD/USD lower today
Start with the Australian numbers, because on their own they look constructive. The S&P Global Manufacturing PMI held steady at 52.0 in August, unchanged from July, with new order volumes reaching their highest point since January (though a modest dip in output resulted from supply chain difficulties and cost pressures). The S&P Global Services PMI came in at 52.9, down from 53.6 in July, with the pace of growth in both business activity and incoming orders easing somewhat relative to the prior month. Both readings sit comfortably above 50, the line separating expansion from contraction.
PMI market pricing dynamics help explain this session’s apparent paradox: equity and currency markets pre-price economic survey trends months in advance, so the market-moving content of any PMI print is concentrated in its surprise component relative to consensus, not its absolute level above or below 50.
Then the US side reasserted itself. The DXY edged up 0.07% to 99.83 on the session. That sounds small. But when a pair is already pressing against short-term highs, even a marginal dollar firming is enough to cap upside and invite profit-taking. AUD/USD touched 0.7132, then slid back to settle near 0.7114, a decline of 0.14% on the day.
With DXY near the 100 level, a mechanically loaded threshold that concentrates option strikes, stop-loss clusters, and algorithmic triggers, even a marginal firming carries amplified market impact, which explains why a 0.07% DXY gain was sufficient to cap AUD/USD at its weekly high and invite profit-taking.
AUD-positive factors this session:
- Manufacturing PMI at 52.0, expansion territory with strong new orders
- Services PMI at 52.9, softer but still growing
- Both readings above the 50-point threshold
USD headwinds this session:
- DXY up 0.07% to 99.83, capping the pair at short-term highs
- US Treasury yields pushing higher, reviving dollar demand
- AUD/USD reversed from 0.7132, settling 0.14% lower
Manufacturing PMI at 52.0. Services PMI at 52.9. The pair still fell 0.14%. The US side of the equation overrode positive domestic data entirely.
What this tells you is straightforward: watching Australian economic releases in isolation is not enough. In USD pairs, the US yield and dollar environment typically carries more weight than the non-US currency’s domestic data. Monitoring both sides is non-negotiable.
When big ASX news breaks, our subscribers know first
Reading the chart: the support and resistance levels that define AUD/USD right now
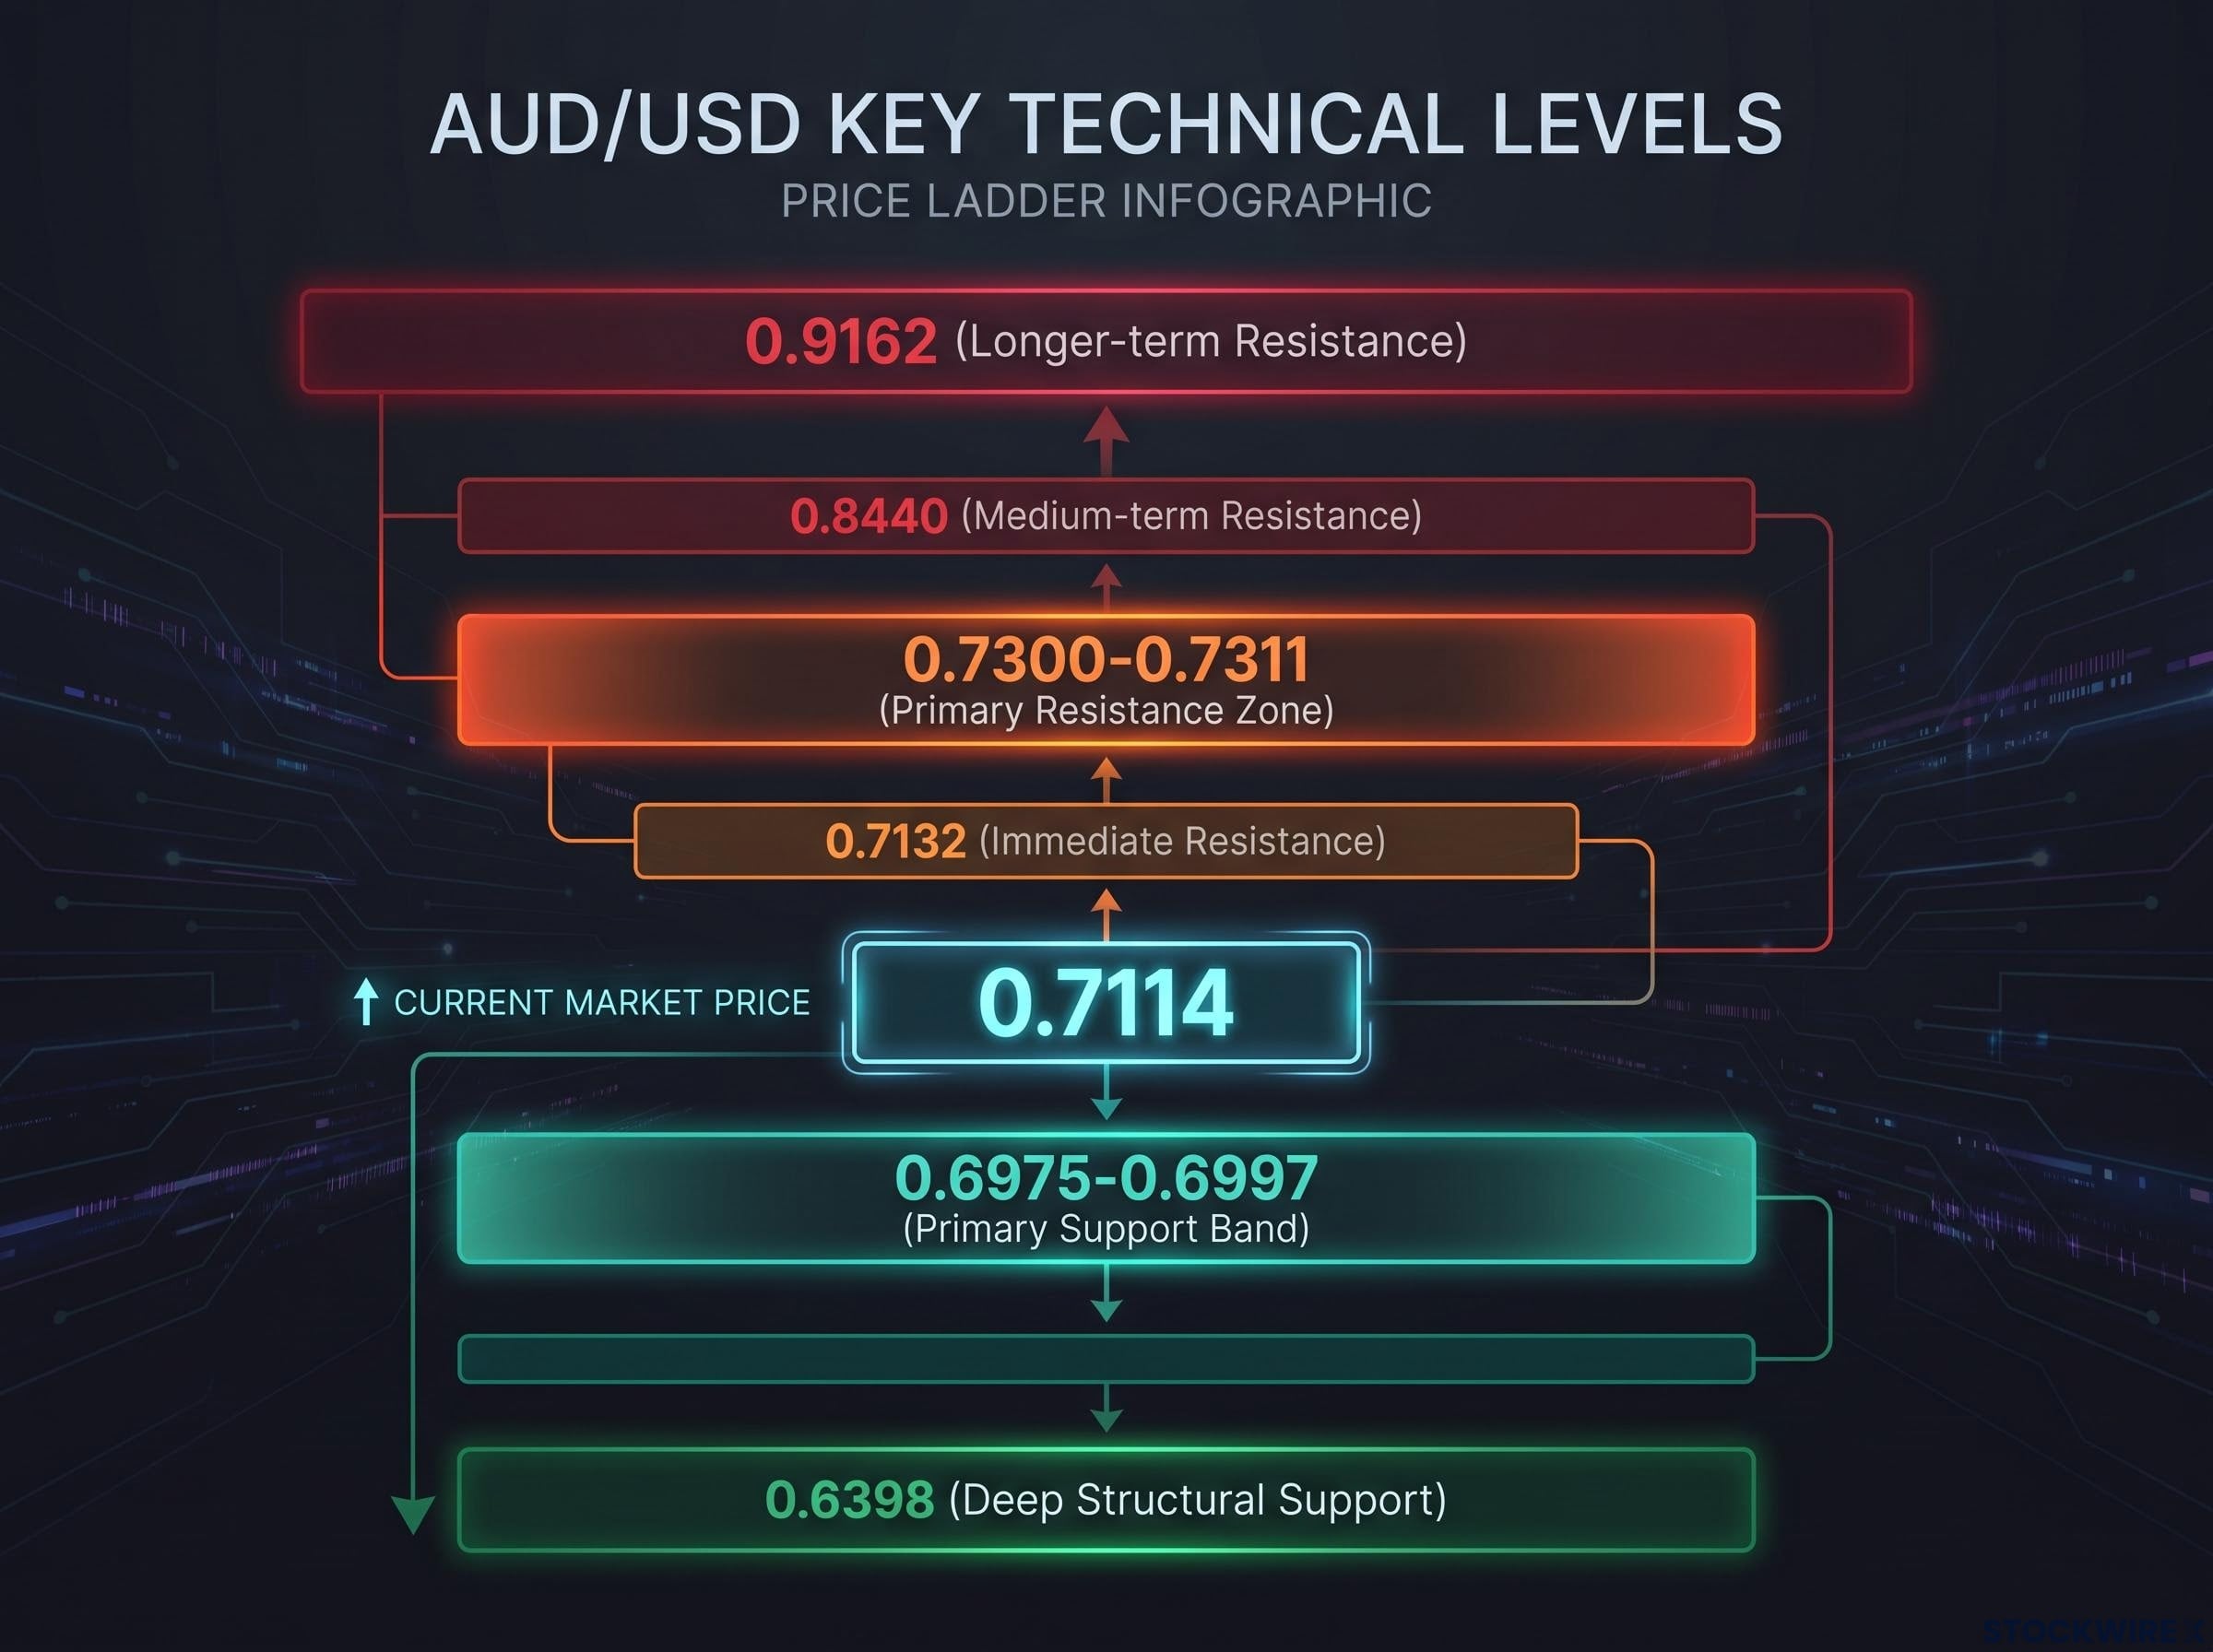
The pair sits at 0.7114-0.7116, near the middle of its recent daily range, within a broader upward price structure. Before running through individual levels, anchor the spatial picture: price is well above primary support, has just been rejected at immediate resistance, and faces a significant supply zone overhead before medium-term projections come into play.
| Level | Price | Type | Significance |
|---|---|---|---|
| Weekly high | 0.7132 | Immediate resistance | Where sellers stepped in on 20 August; first level bulls need to reclaim |
| Supply zone | 0.7300-0.7311 | Primary resistance | Historical supply zone; daily close above 0.7311 confirms next bullish leg |
| Medium-term projection | 0.8440 | Extended resistance | Trend-line target if broader uptrend stays intact |
| Longer-term projection | 0.9162 | Extended resistance | Longer-term roadmap target, not a near-term call |
| SMA cluster / trend-line flip | 0.6975-0.6997 | Primary support band | Layered floor combining moving average confluence and broken trend-line support |
| Former breakpoint | 0.6398 | Deep structural support | Only relevant if 0.6975-0.6997 fails decisively in a risk-off environment |
Support levels: the floor the bulls need to hold
The 0.6975-0.6997 band is the most important zone on the chart right now. At 0.6997, a tight cluster of major simple moving averages (SMAs) creates a technical floor, the kind of confluence that typically attracts buyers on pullbacks. At 0.6975, a previously capping downward trend line, now broken, acts as support from below.
Together, these two levels form a defence band rather than a single line. The zone matters more than either individual level because it represents two different types of technical validation converging in the same area. A daily close below 0.6975 would be the technical signal that shifts the picture from a healthy pullback within an uptrend to a meaningful trend reversal.
Below that, 0.6398 marks the next significant floor on the chart, a prior resistance level whose breach converted it into structural support.
Resistance levels: the ceiling the pair needs to clear
0.7132 is the immediate hurdle, the exact level where sellers emerged during this session. Reclaiming it would reopen upside momentum.
Above that, 0.7300-0.7311 is the zone that would confirm the bullish case. This band has characteristics of a supply zone where previous rallies stalled, and a daily close above 0.7311 would strongly reinforce the view that a next leg higher is underway.
The extended projections at 0.8440 (medium-term) and 0.9162 (longer-term) are roadmap targets derived from the current trend-line structure. They are not near-term price calls; the pair would need to clear multiple resistance layers to reach them.
What RSI near 64 is telling you about momentum
The Relative Strength Index (RSI) is a momentum gauge that measures whether a price move is gaining or losing force, and whether a market is becoming technically stretched in one direction. It oscillates between 0 and 100, with readings above 70 traditionally signalling overbought conditions (where reversal risk rises) and readings below 30 signalling oversold conditions.
The 14-period RSI for AUD/USD sat near 64 as of 20 August 2026. That puts it in a specific position: the pair has real upward momentum, but it has not crossed into overbought territory. There are roughly 6 RSI points of runway before the 70 threshold would be reached on further upside.
RSI near 64: bullish momentum present, overbought threshold (70) not yet reached.
What this tells you practically:
- RSI at 64: The current uptrend still has mechanical support. No momentum-based sell signal is flashing. Buyers have room to push higher without the indicator itself arguing against them.
- RSI above 70 (hypothetically): Would signal the pair is becoming technically stretched, raising the probability of a pullback or consolidation. Not a guaranteed reversal, but a caution flag.
For anyone evaluating whether to position now or wait for a deeper pullback, RSI at this level suggests the move is not dangerously overextended. The momentum picture is constructive, not exhausted.
Two scenarios for where AUD/USD goes from here
Both paths ahead hinge on observable conditions, not predictions. The value of scenario mapping is knowing in advance what to watch, so the market tells you which path is unfolding rather than requiring you to guess.
Bullish scenario: dips bought, resistance cleared
- The 0.6975-0.6997 support band holds on any pullback, attracting buyers and confirming the floor remains intact.
- AUD/USD reclaims 0.7132, the level where sellers stepped in this session, re-establishing upward momentum.
- Price pushes into the 0.7300-0.7311 supply zone, the primary near-term ceiling where the bullish case faces its real test.
- A daily close above 0.7311 confirms the next leg higher, opening the path over time toward 0.8440 and eventually the longer-term 0.9162 projection, assuming global risk sentiment and commodity demand cooperate.
Bearish scenario: yields push higher, 0.6975 breaks
- US Treasury yields continue grinding higher, reinforcing dollar demand.
- The DXY strengthens further, potentially pushing through the 100 psychological level.
- AUD/USD breaks below 0.6975 on meaningful volume, the technical signal that the medium-term uptrend is deteriorating.
- Downside opens toward 0.6398, the deeper structural base, particularly in a more pronounced risk-off environment.
The key macro variable that will largely determine which scenario unfolds is the US Treasury yield trajectory. That is the external force with the most direct influence on dollar strength and, by extension, on how much upside room AUD/USD has.
The level to monitor as the decision point is 0.6975. You do not need to predict which path plays out. You need to know what price action at that level means when it happens.
The macro layer: why USD dynamics matter more than Australian data in this environment
The US Dollar is the global reserve currency, and US Treasury yields set the global risk-free rate. Shifts in the US yield environment do not just affect US assets; they affect every USD pair with outsized force. That structural reality creates an asymmetry that shapes AUD/USD more than any single Australian data release.
The US Treasury yield repricing that pushed the 30-year to 5.33% on 18 August, its highest level since 2007, is transmitting directly into dollar demand through four simultaneous channels: mortgage rates, corporate borrowing costs, equity discount rates, and overall financial conditions, each of which tightens the greenback’s grip on USD pairs without any additional Fed action required.
The current setup illustrates this clearly. Australia’s PMIs are in expansion (Manufacturing 52.0, Services 52.9), providing a supportive economic backdrop. But that support functions as a floor, not a catalyst. Positive domestic data can prevent AUD/USD from falling sharply; it cannot easily push the pair higher when the dollar is strengthening. The session on 20 August demonstrated this precisely: the pair hit its weekly high of 0.7132, then retreated as the DXY firmed to 99.83, just below the psychologically significant 100 level.
The RBA’s August Statement on Monetary Policy frames the domestic economic backdrop directly, outlining how expansion-level activity data feeds into the central bank’s assessment of inflation and financial conditions, including its own commentary on the Australian dollar’s trajectory.
Positive domestic data can support a floor. It cannot easily push a pair higher when the USD is strengthening.
For anyone tracking AUD/USD directional bias, three macro variables matter most right now:
- US Treasury yield direction: The primary driver of dollar demand and, therefore, the primary external force on the pair
- DXY trajectory: Its proximity to 100 makes it a reference point for near-term sentiment
- Global risk sentiment: Risk-on environments generally support commodity currencies like AUD; risk-off environments amplify dollar strength
What this means practically is that keeping a US economic calendar and yield monitor open alongside Australian data releases is not optional. When the two inputs conflict, the USD signal will frequently override the AUD signal.
For investors wanting to map the single most plausible near-term catalyst for a sustained directional move in the dollar, our dedicated guide to the Jackson Hole dollar catalyst examines why the Fed chair’s 27 August keynote carries more directional power for DXY than any regional economic data release.
What the current setup means for how you approach AUD/USD
The bias is cautiously constructive while the pair holds above 0.6975-0.6997. Price at 0.7114 sits within an intact medium-term uptrend, RSI near 64 shows momentum that is positive without being overextended, and Australian PMIs in expansion provide a supportive floor. The upside reference points are 0.7132 (immediate) and 0.7300-0.7311 (the zone that would confirm the next bullish leg).
The single most important level to monitor is 0.6975. A daily close below it is the signal that should cause any holder of a constructive view to reassess, because it would indicate the medium-term uptrend is under genuine threat.
Three conditions to watch going forward:
- Whether 0.6975-0.6997 holds on any pullback, confirming the support band remains intact
- Whether 0.7132 and then 0.7311 are cleared on a rally, confirming upside momentum
- Whether US yields and the DXY continue firming, which would pressure the pair regardless of Australian data
Above 0.6975, the bias remains constructive. Below it, reassess.
The US yield trajectory will largely determine which scenario unfolds. Watch the chart, but watch the macro inputs that are driving it.
This article is for informational purposes only and should not be considered financial advice. Investors should conduct their own research and consult with financial professionals before making investment decisions. Past performance does not guarantee future results, and currency trading involves significant risk.