
A government buying back its own debt does not, on its face, sound like an event that should weaken the dollar and send gold surging. Yet that is precisely what happened when the US Treasury expanded its buyback programme in early September 2026. Understanding why requires tracing a chain that most financial news coverage never fully maps.
The Treasury’s announcement was a debt management decision, not a monetary policy shift. It moved 30-year Treasury yields, the Dollar Index (DXY), two major currency pairs, and gold within a single trading session. The mechanics mattered as much as the magnitude, and separating the two is what turns a confusing headline into a readable market signal.
30-year Treasury yields have been functioning as an active policy pressure zone throughout 2026, simultaneously tightening mortgage rates, corporate borrowing costs, and federal debt servicing in ways that the S&P 500 alone no longer captures for Washington decision-makers.
What follows maps the full transmission chain step by step, so the next time a Treasury operation makes headlines, you know exactly which markets to watch and why they move in the direction they do.
What the Treasury actually announced, and what it did not
The US Treasury announced it would at least double its liquidity-support buyback operations for longer-dated nominal coupon securities, with each operation’s ceiling lifted from $2 billion to a floor of $4 billion. The expanded scope covered both the 10-to-20-year and 20-to-30-year segments of the nominal coupon market. The expanded programme took effect in early September 2026 and runs through early November 2026.
Stated purpose: The Treasury framed the expansion as a liquidity-support measure focused on secondary-market functioning and maturity profile management, not a change to net issuance or regular auction sizes.
That framing matters, because the three things this operation explicitly is not will determine whether you read the policy trajectory correctly:
- It is not quantitative easing. The Federal Reserve is not buying bonds to expand the money supply. The Treasury is repurchasing its own outstanding securities to improve market functioning.
- It is not a debt-reduction programme. Gross borrowing remains unchanged. Buying back old bonds does not reduce total debt outstanding; it reshuffles which maturities remain in the market.
- It is not a fiscal stance shift. Auction sizes and net issuance are unaltered. The government is not signalling a change in spending or taxation policy.
If you misread this as monetary stimulus, you will misread the policy trajectory and potentially misposition across rate-sensitive assets. The distinction between liquidity support and QE is not semantic; it is the difference between two entirely different investment thesis frameworks.
When big ASX news breaks, our subscribers know first
How Treasury buybacks work: the mechanism behind the market move
The logical chain from announcement to market reaction runs in four numbered steps, and each link follows directly from the one before it:
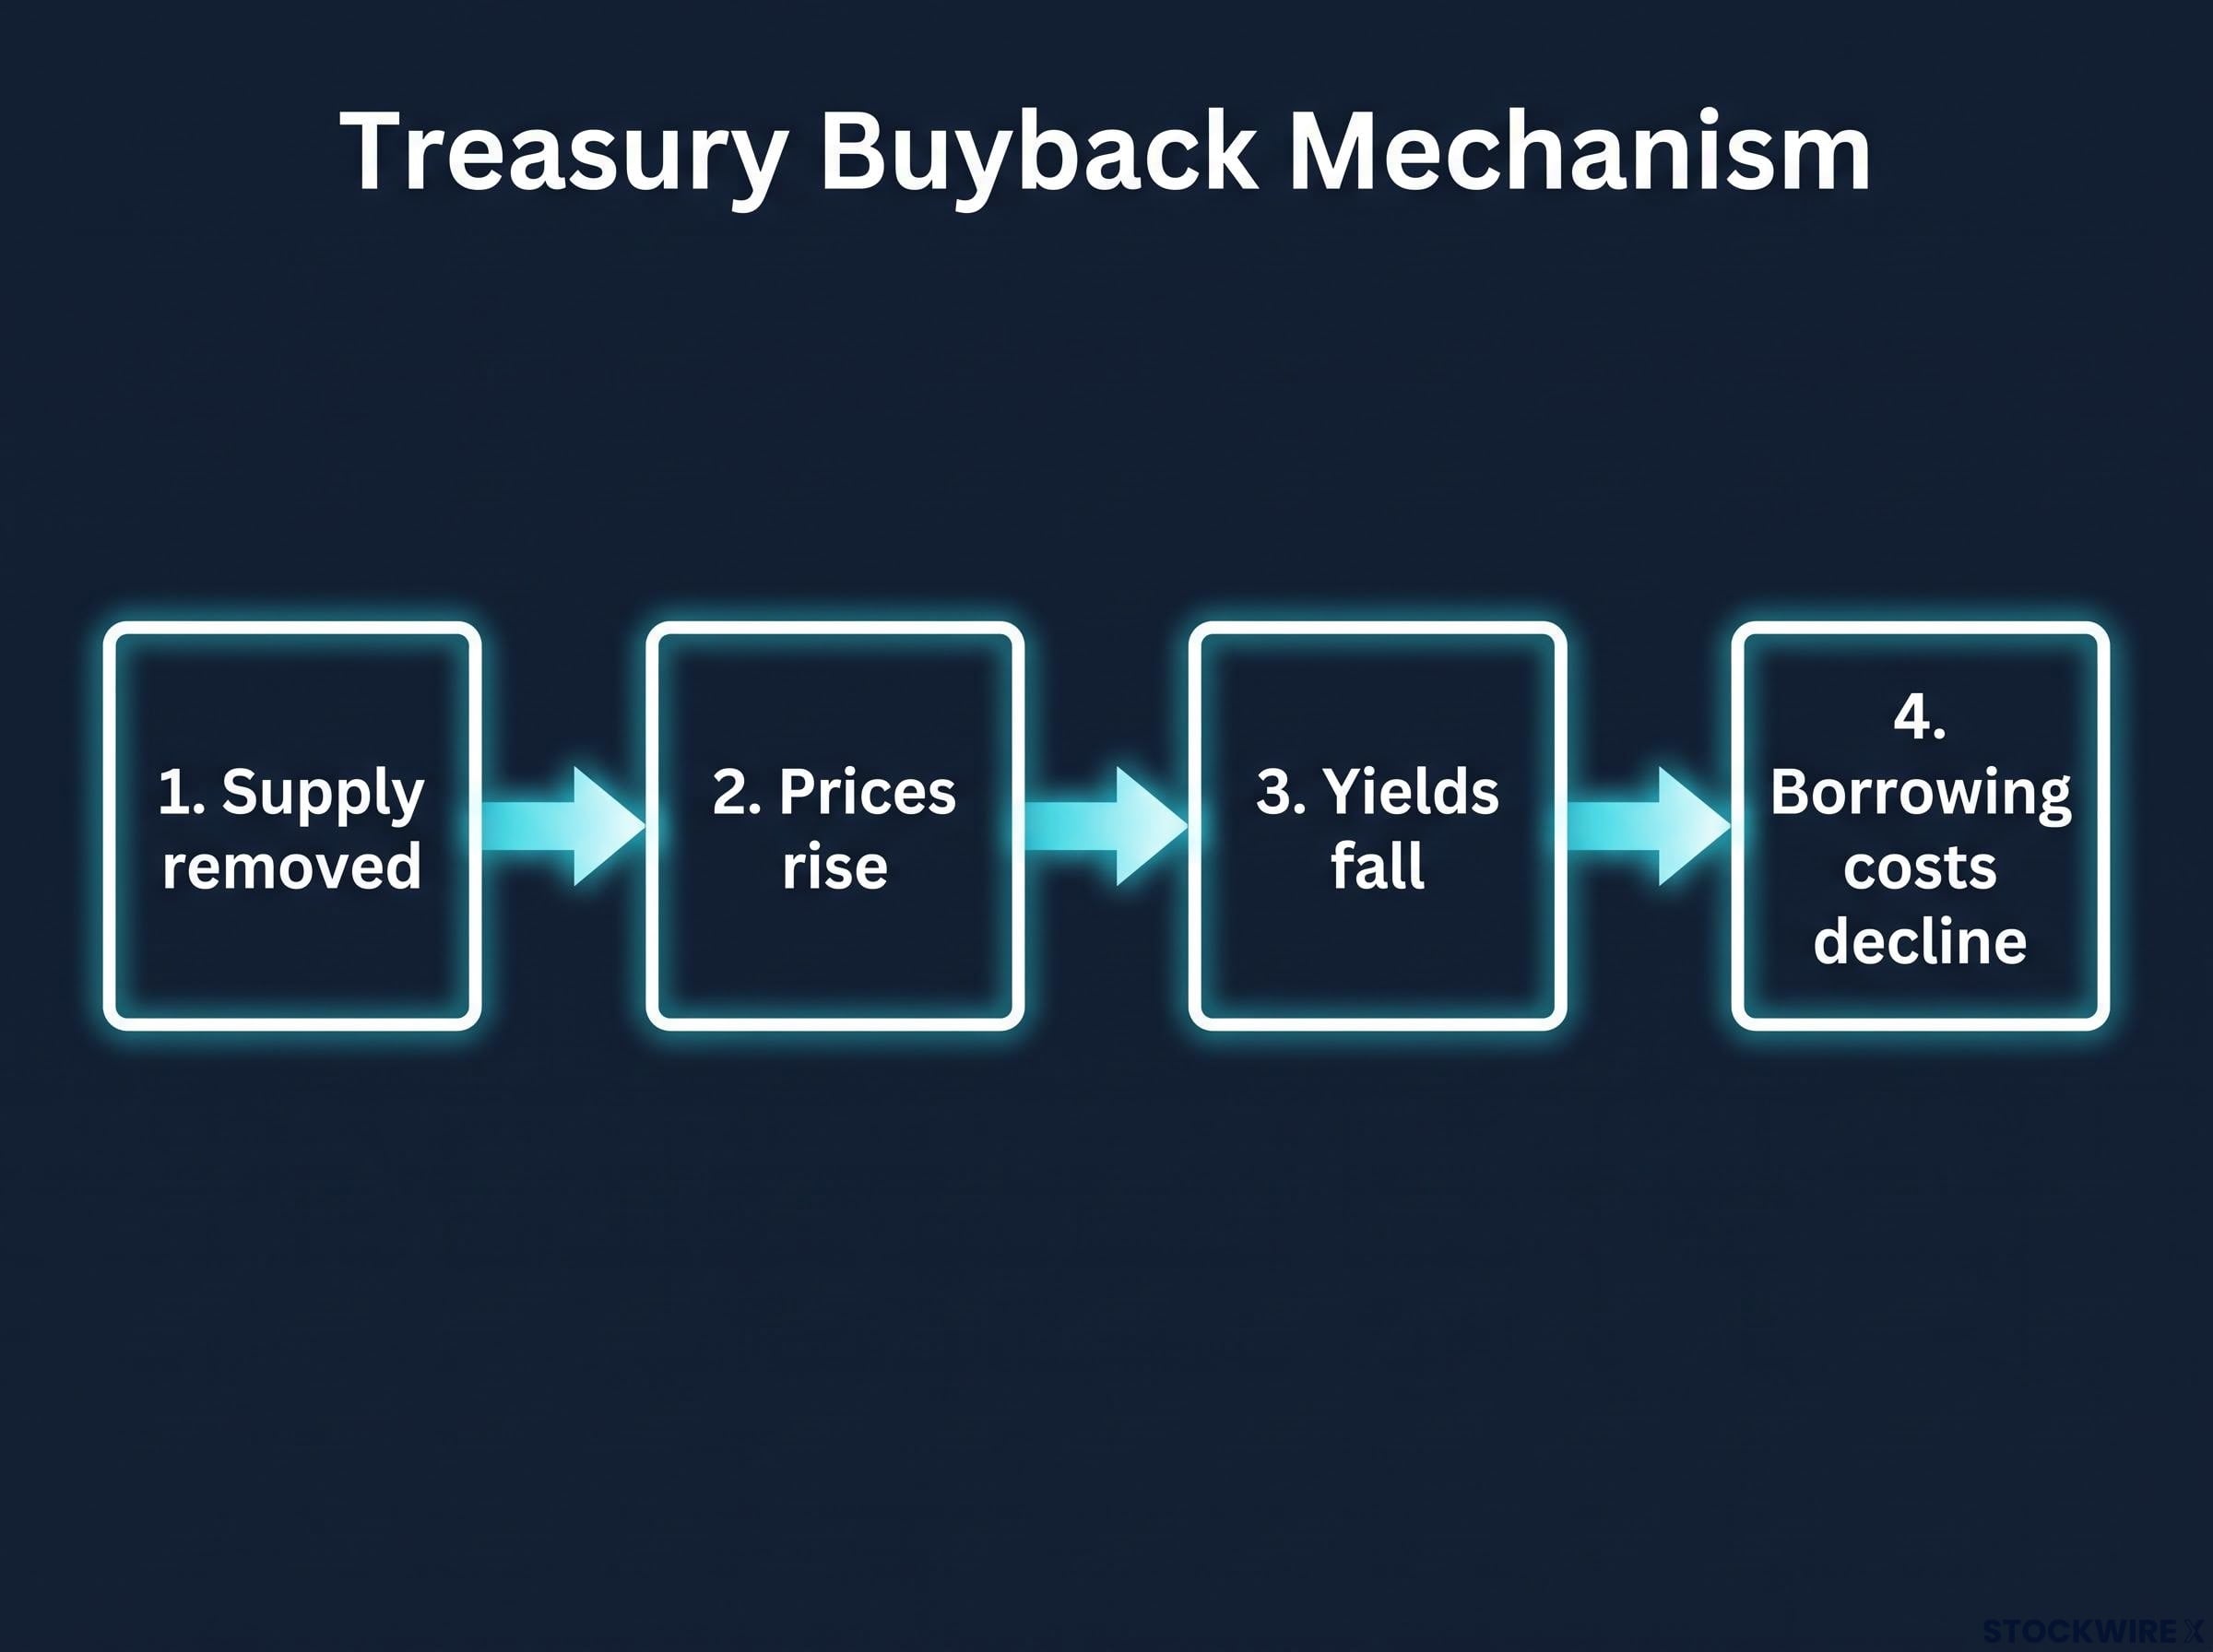
- Supply removed. The Treasury buys back outstanding long-dated bonds from the secondary market, reducing the quantity available to other investors.
- Prices rise. Fewer bonds available for purchase means buyers compete for a smaller pool, which pushes bond prices higher.
- Yields fall. When bond prices rise, yields fall. This is not a coincidence but a mathematical relationship baked into how fixed-income instruments work (explained below).
- Borrowing costs decline. Lower yields on 10-to-30-year Treasuries directly reduce the rate the government pays to borrow for decades, and that compression ripples into every asset priced off long-term rates.
On the day of the announcement, the 30-year Treasury yield shed roughly 9 basis points, settling near 5.20% (specifically around 5.196%). That represented a notable reversal from the 5.3% level reached the previous session, which had been the highest reading for 30-year yields in approximately two decades, last seen around 2007.
For context, the overall Treasury market is approximately $27 trillion in size, which makes the buyback programme’s mechanical footprint modest relative to total supply. That scale contrast becomes important later. But the 9-basis-point yield drop matters to you not as a number but as a signal: when the Treasury removes supply from the long end, it directly compresses the rate the government pays to borrow for decades, and that compression ripples into every asset priced off long-term rates.
Why bond prices and yields move in opposite directions
A bond pays a fixed coupon, a set dollar amount, at regular intervals. That payment does not change. So when the price you pay for the bond rises, the effective return you receive on your money (the yield) falls. When the price drops, the yield rises. This inverse relationship is a mathematical property of every fixed-income instrument, and it is the mechanism that connects the Treasury’s buyback to everything that happened next.
The inverse relationship between bond prices and bond yields is a mathematical property, not a market convention: because the coupon is fixed, any rise in the price you pay for a bond automatically compresses the return you receive on your capital.
The dollar under pressure: how a bond decision moved the Greenback
The Dollar Index, known as the DXY, measures the US dollar against six major currencies. It tracks how attractive dollar-denominated assets are to global capital relative to alternatives. That attractiveness is heavily influenced by interest-rate differentials: the gap between what US bonds pay and what comparable bonds in other economies pay.
When US long-term yields fall, that gap narrows. Global investors holding capital in dollars for the yield advantage start finding less reason to stay. Demand for the dollar itself weakens.
Market reaction: The DXY dropped around 0.65% on the session, slipping to near the 99 mark, its softest point since 1 June. (Note: This level and decline figure represent indicative intraday trading-platform data rather than official settlement closes.)
For investors wanting to understand the mechanical significance of the DXY’s proximity to 100 after the buyback-driven decline, our dedicated guide to DXY at the 100 level explains how option strikes, stop-loss clusters, and algorithmic triggers converge at that price, amplifying macro catalysts that arrive while the index trades there.
Prior to the buyback announcement, the dollar had already begun losing ground. Softer US economic readings in recent weeks had led market participants to pare back their expectations for further Federal Reserve rate hikes, and the Treasury’s announcement then reinforced a trend that was already in motion rather than reversing a stable one. The decline was broad-based USD weakness, not strength in any individual counterpart currency.
When US yields fall and the dollar weakens together, the interest-rate differential story is the explanation: global investors are repricing how attractive dollar assets are relative to alternatives, and that repricing shows up directly in currency markets. This is why watching the bond market gives you a leading indicator for FX moves, rather than treating currency and bond markets as separate stories.
EUR/USD, GBP/USD, and gold: three different stories from one announcement
The same catalyst produced three asset moves in the same direction, but driven by different mechanisms. Separating them is what FX desks actually do, and the distinction determines whether your read of the move survives the next data point.
| Asset | Market Move | Primary Driver |
|---|---|---|
| EUR/USD | ~1.1653, +~0.68% intraday | USD weakness only |
| GBP/USD | ~1.3600, highest since mid-May | USD weakness + UK CPI data |
| Gold (XAU/USD) | ~2% intraday gain | Lower yields + weaker USD |
(Note: FX and gold levels cited are indicative intraday trading-platform quotes, not official closing prices.)
EUR/USD was the purest dollar story. The pair pushed to a 10-week peak near 1.1653 on the back of broad USD selling pressure, with no independent European catalyst underpinning the move. There was no independent European catalyst driving the euro higher. If the dollar had strengthened the following session, this move would have reversed entirely because nothing on the euro side supported it.
GBP/USD had two components. The pound’s advance to around 1.3600, a level not seen since mid-May, was shaped by the same broad USD selling alongside a separate domestic UK catalyst. July UK CPI printed at 2.9% on an annual basis, meeting market forecasts, while UK core CPI climbed 2.6% year-over-year, nudging above the 2.5% consensus. That upside surprise on core inflation reduced the case for near-term Bank of England easing, giving sterling its own independent support.
Gold benefited from a dual-catalyst structure:
- Opportunity cost reduction: Lower Treasury yields mean you sacrifice less return by holding a non-yielding asset like gold. When yields fall, gold becomes comparatively more attractive.
- Foreign buyer demand increase: Gold is priced in US dollars. A weaker dollar makes gold cheaper for buyers using other currencies, expanding the buyer pool.
Both tailwinds worked simultaneously, pushing the metal to an intraday gain of roughly 2% through the American session and wiping out the losses recorded the day before.
The EUR/USD versus GBP/USD distinction is analytically important for you: it shows that even when assets move in the same direction, the reason can differ. Building a position on the wrong thesis means you will be wrong the next time conditions diverge.
Announcement effect versus structural effect: why the market moved more than the mechanics justify
You have just watched a single debt management decision cascade across bonds, currencies, and gold. The natural question is whether the moves were proportionate to what actually changed. The honest answer is that the market reaction significantly overshot the programme’s mechanical footprint.
- Announcement effect: Markets repriced immediately based on the signal value of the policy change and the positioning response it triggered. Traders repositioned on the news, not on an arithmetic calculation of bonds removed from circulation. The reaction was about what the decision meant, not what it mechanically did.
- Structural effect: Even at $4 billion per operation, the buyback programme is modest relative to the approximately $27 trillion Treasury market. The ongoing supply reduction across a market that large will have limited persistent impact on yields across the full curve.
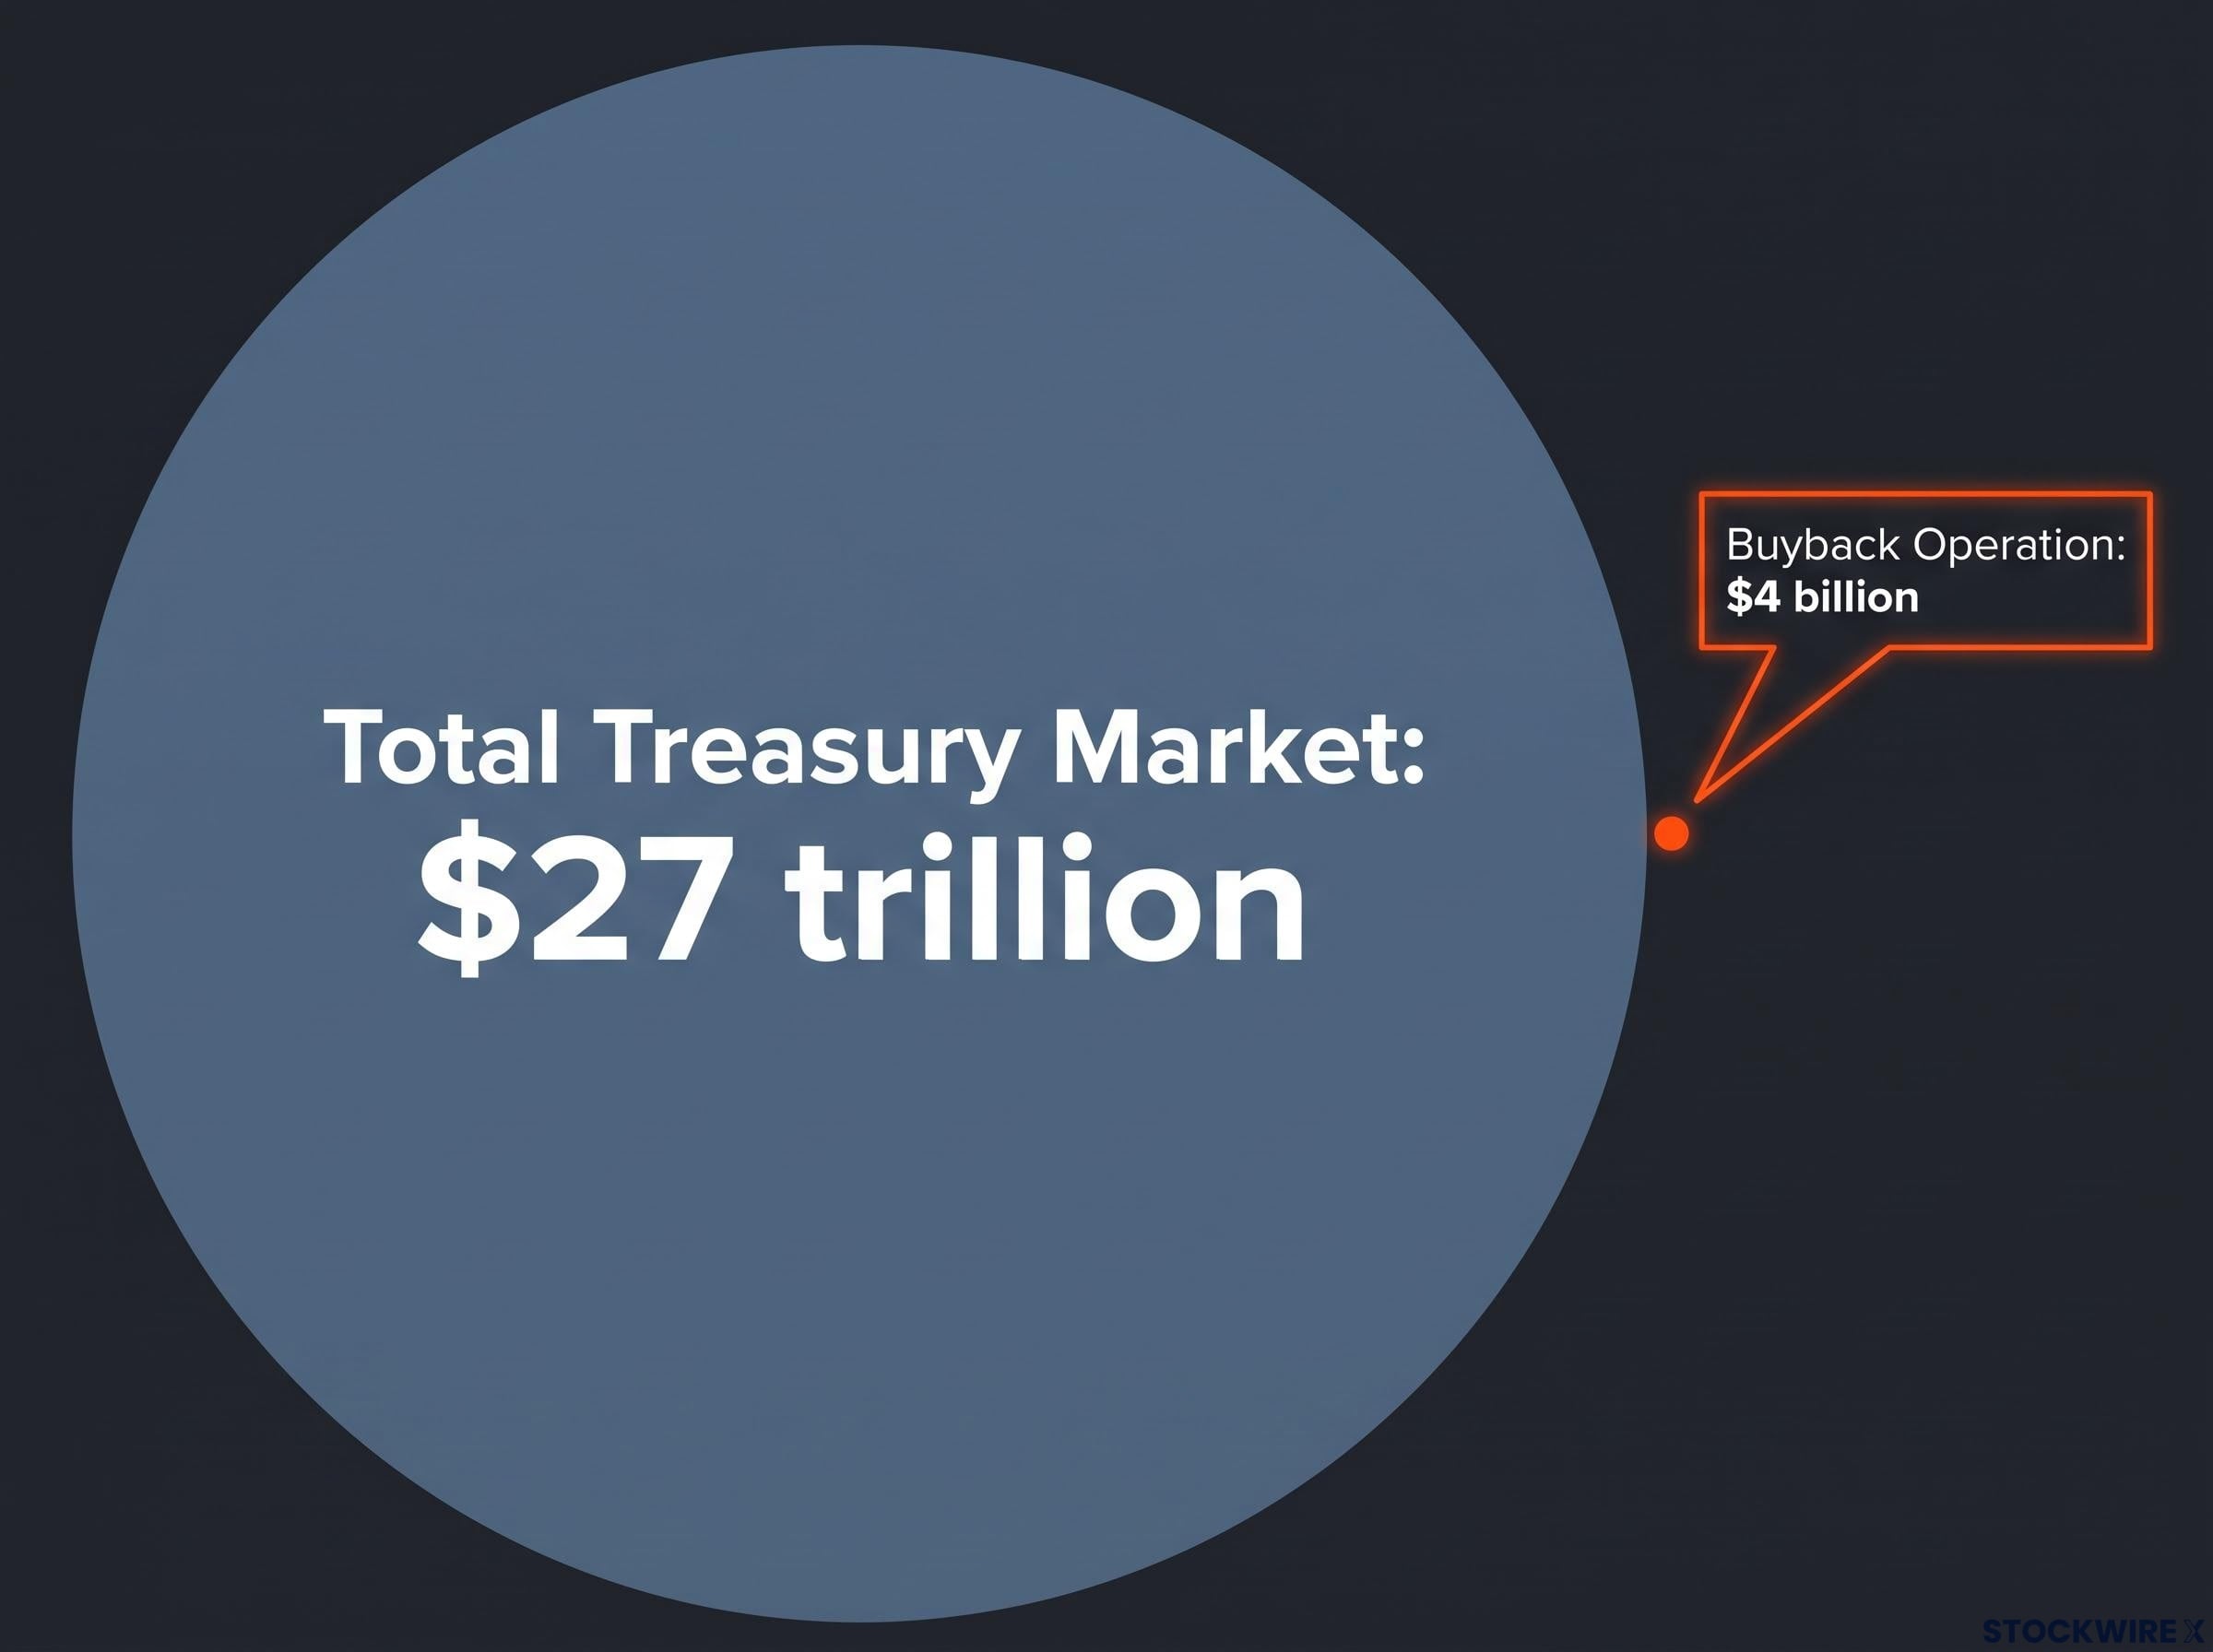
Scale contrast: $4 billion per operation against an approximately $27 trillion market.
Prior to the announcement, USD weakness was already developing, as a string of softer US economic releases had caused traders to scale back Federal Reserve rate-hike expectations. The buyback news arrived against that existing backdrop and gave it fresh momentum rather than being the sole origin of the move. The market was primed; the announcement was the catalyst, not the sole cause.
Fiscal-driven yield erosion has been capping dollar upside for much of 2026, with the DXY range-bound despite US rates above 4% for over a year, because the gross Treasury yield and the net return foreign investors actually receive after hedging costs and risk premium have diverged materially.
The gap between the announcement effect and the structural effect tells you something important: if you trade the initial market reaction and then hold through the period when the mechanics actually play out, you may be overestimating the persistence of the move. Sharp announcement-day moves in a market this large often mean-revert once the signal is absorbed and the positioning adjusts.
What this episode teaches about reading Treasury operations going forward
The full cross-asset transmission chain, documented step by step in this episode, functions as a reusable checklist for the next debt management announcement:
- Treasury announces a buyback expansion (or contraction).
- Supply of targeted maturities changes in the secondary market.
- Bond prices adjust; yields move in the opposite direction.
- Interest-rate differentials shift relative to other economies.
- The dollar reprices based on the new differential.
- FX pairs respond, each filtered through their own domestic drivers.
- Commodities priced in dollars (gold, oil) adjust for both the yield shift and the currency move.
This is not a mechanical rule that fires identically every time. It is a starting structure for asking the right questions when the next headline arrives: which link in the chain is activated, how large is the signal relative to the structural effect, and which assets have independent drivers that will filter or amplify the move.
Three distinctions that change how you read the next announcement
- Liquidity support versus QE: If the Treasury is managing market functioning, the signal is about secondary-market conditions. If the Fed is buying bonds, the signal is about monetary policy. The investment implications differ entirely.
- Announcement effect versus structural effect: The initial market reaction reflects signal value and positioning. The persistent effect reflects actual supply mechanics. Sizing a position for one while expecting the duration of the other is a common and costly mismatch.
- Dollar-driven versus domestically-driven FX moves: A currency pair rising on dollar weakness alone will reverse when the dollar stabilises. A pair rising on domestic data has independent support. Knowing which story applies determines whether you hold or fade the move.
What the next Treasury debt management headline will demand from you
A single debt management decision cascaded across bonds, currencies, and gold in a sequence that was logically predictable once the mechanism was understood, but opaque to anyone who lacked the framework to trace it. In September 2026, the buyback expansion drove a 9-basis-point drop in the 30-year yield, sent the DXY down 0.65%, lifted EUR/USD to its highest point in ten weeks, carried GBP/USD to its best level in three months, and saw gold recoup all of its prior session decline, each of these within a single trading day.
The three-part distinction framework you now carry, liquidity support versus QE, announcement effect versus structural effect, and dollar-driven versus domestically-driven FX moves, applies to every future Treasury operation. These operations are a recurring feature of bond market management, not one-off events.
The next announcement is your opportunity to apply the transmission chain before the commentary arrives. You now know which link to watch first and why each subsequent market moves in the direction it does.
This article is for informational purposes only and should not be considered financial advice. Investors should conduct their own research and consult with financial professionals before making investment decisions.