Equity valuations sit at or near record highs by one of the most widely followed measures in finance, and the options market is pricing one of the quietest months in years.
Those two facts should not coexist comfortably. Ray Dalio has drawn explicit parallels between today’s environment and the market collapses of 1929 and 2000. Warren Buffett has characterised the current market as little more than a gambling hall. The Buffett Indicator, the ratio of total US equity market capitalisation to GDP, is sitting at readings Buffett himself has flagged as extreme risk territory. And yet the VIX is in the mid-teens, with options markets implying roughly 4.3% of total price movement across the entire month ahead. If you are trying to decide what to do with loud bearish macro information while the volatility market shrugs, you have an interpretive problem that neither signal alone can solve.
Here is what each signal is actually measuring, why the answer is not as simple as “the options market is wrong” or “the bears are crying wolf,” and the one metric that tells you when the two are about to converge.
The valuation case the bears are making, and why the numbers are harder to dismiss than usual
The Buffett Indicator registered an official reading of approximately 218-219% in Q1 2026. By mid-August, market-close estimates have pushed that figure to approximately 238.8-243%. For context, Buffett himself has written that readings above 200% place investors in genuinely dangerous territory.
Buffett’s own stated threshold: readings above 200% indicate extreme risk. The indicator currently sits 38 to 43 percentage points above that line.
Three high-profile investors have staked visible positions on the bearish side:
- Ray Dalio has drawn direct parallels between current conditions and the crashes of 1929 and 2000, citing similar valuation dynamics and speculative excess.
- Warren Buffett has characterised the market as resembling a casino, while sitting on a record cash position at Berkshire Hathaway.
- Michael Burry has taken short positions against Oracle, Micron, and Nebius, framing these as obvious opportunities in a market he regards as dangerously stretched.
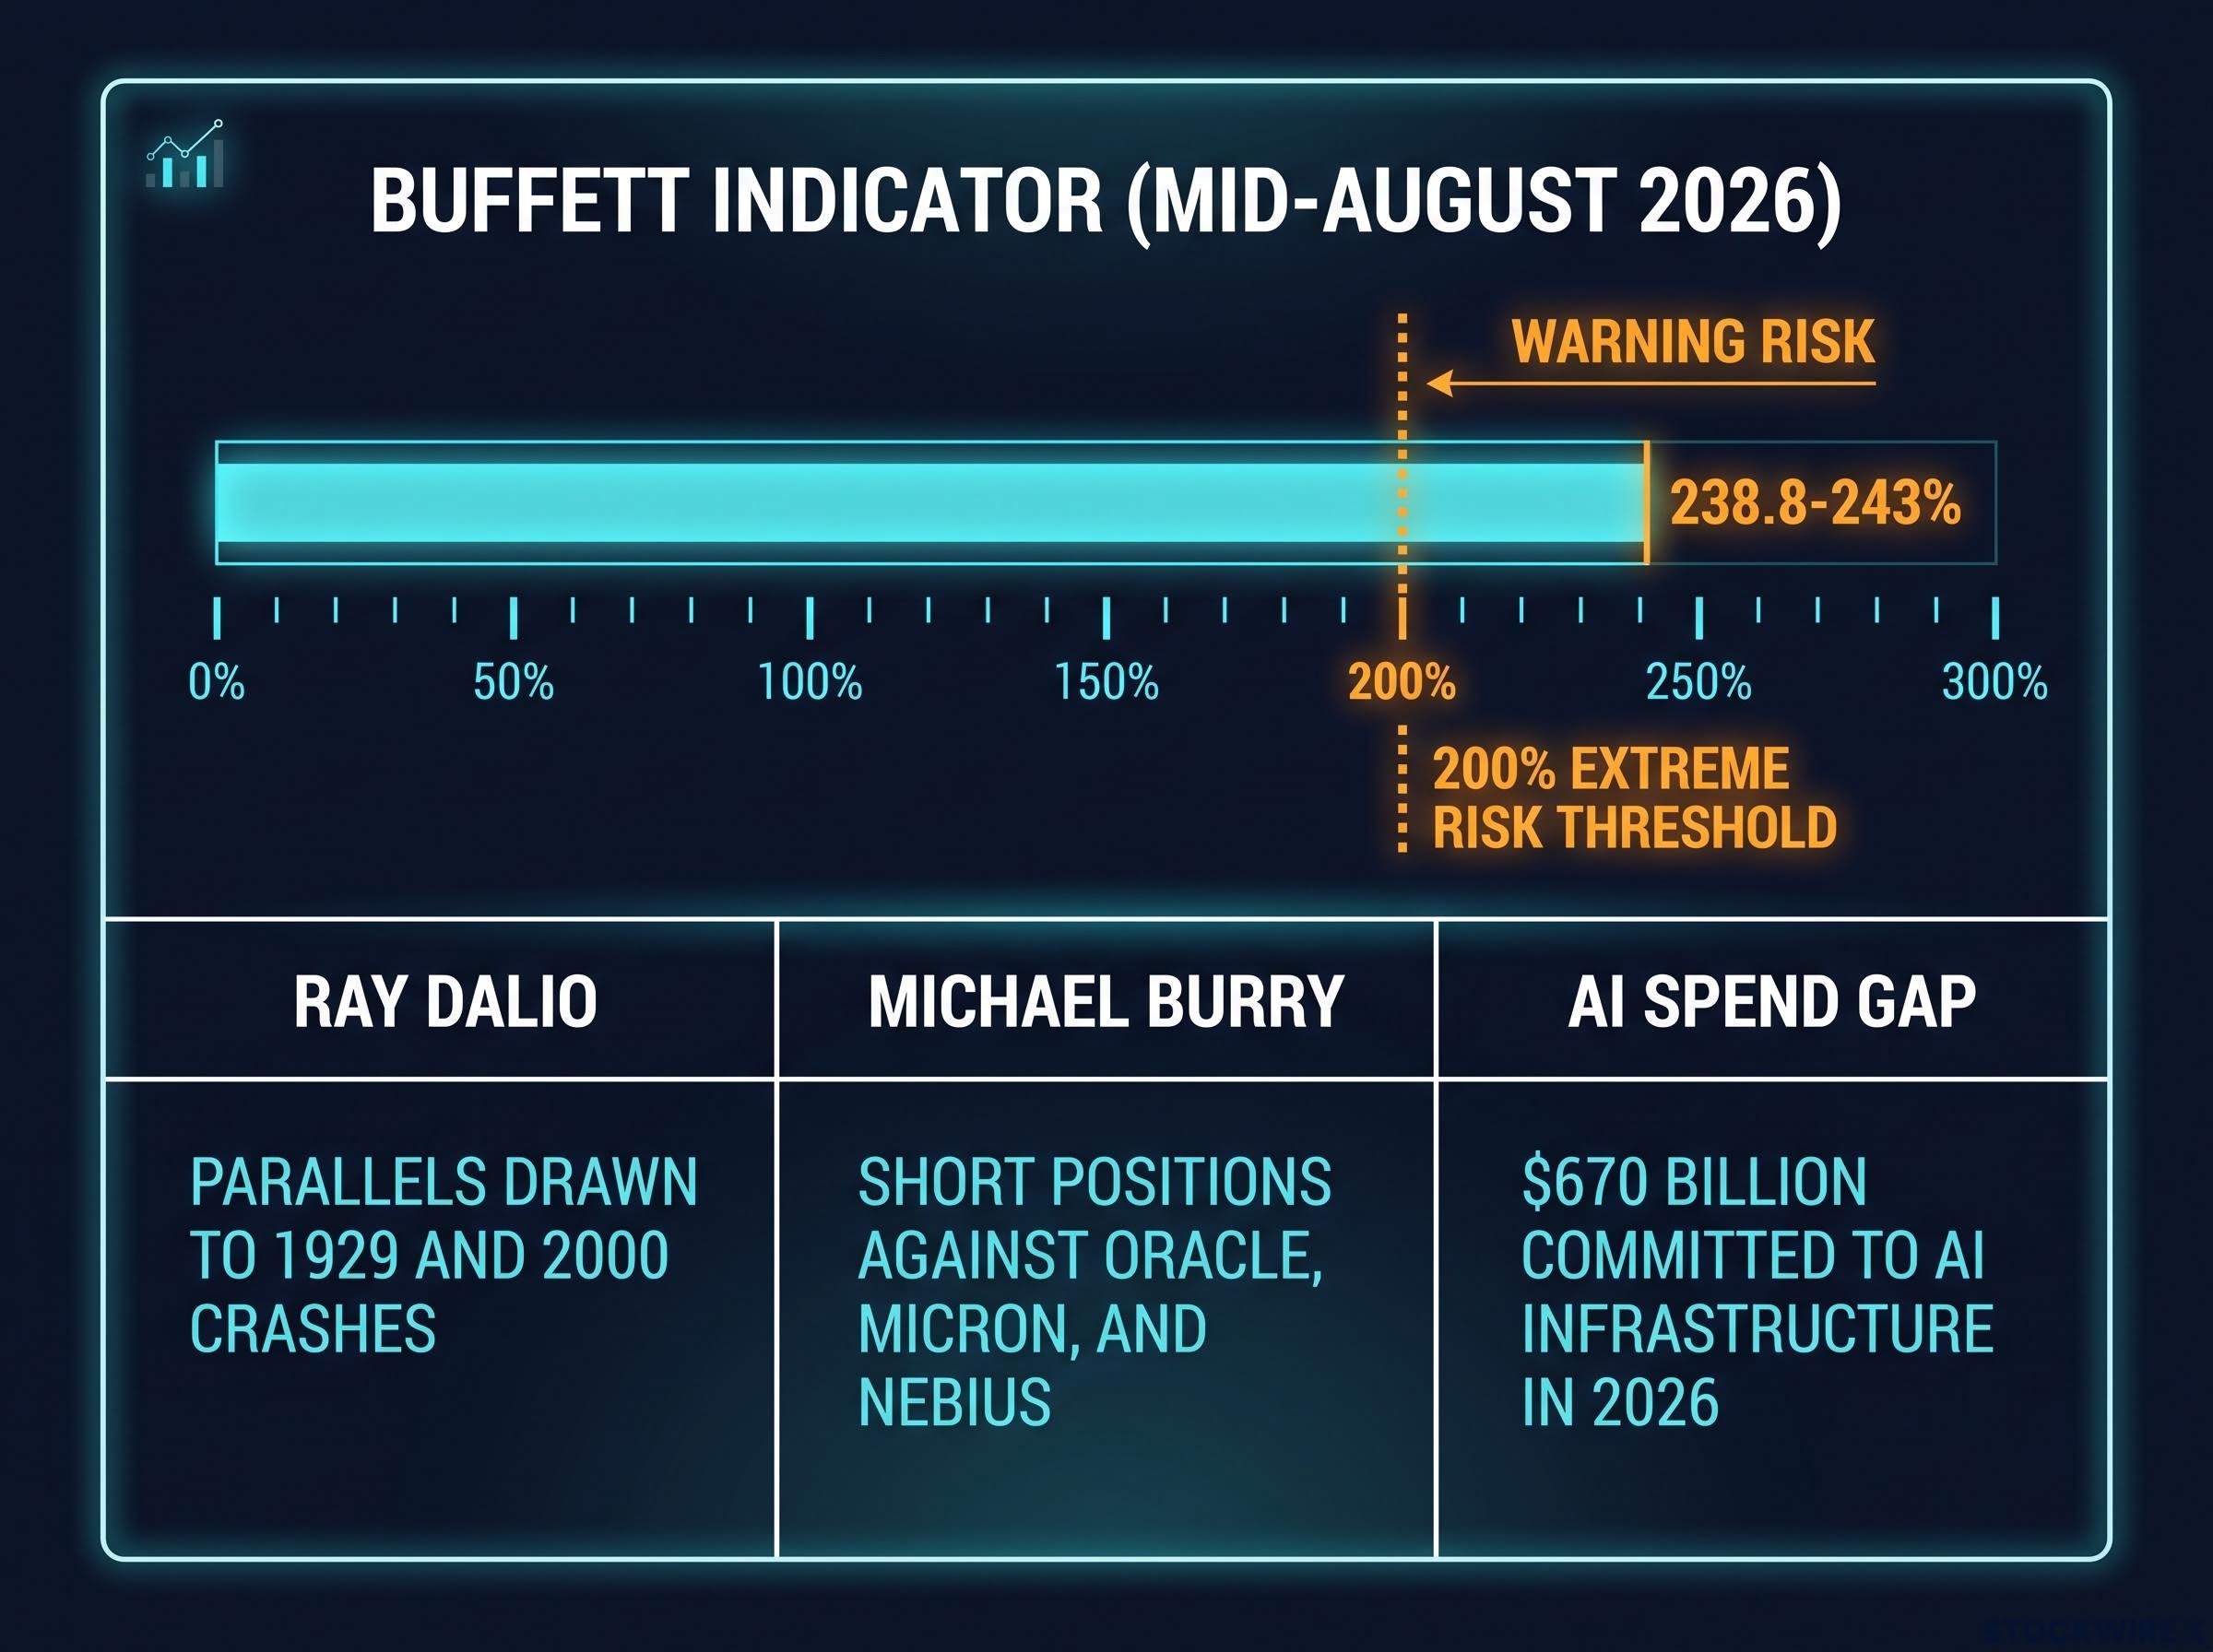
The specific structural concern underpinning the tech overvaluation argument is the AI spending-to-revenue gap. Hyperscaler companies are collectively on track to commit roughly $670 billion toward AI infrastructure in 2026, against AI-related revenues that represent only a small fraction of that outlay.
A Buffett Indicator at 238-243% does not tell you when a correction happens. What it does tell you is that the margin of safety long-term investors traditionally rely on has, by this measure, been substantially eroded. That is the risk you are carrying today whether or not the options market is pricing it.
Three independent valuation signals are now aligned simultaneously, with the Buffett Indicator sitting approximately 2.4 standard deviations above its long-run historical trend, a configuration that has historically preceded periods of substantially below-average forward returns.
When big ASX news breaks, our subscribers know first
What the VIX is actually pricing right now
On the session referenced in recent analysis, the VIX settled at around 14.90, marking its softest close since the start of January. As of mid-August 2026, spot VIX is tracking at approximately 15.2-15.8. Options markets are implying roughly 4.3% of price movement across the full month ahead, a historically modest figure.
The number alone is worth sitting with. A VIX in the mid-teens tells you the options market expects daily moves measured in fractions of a percent, not the kind of price action that accompanies the corrections Dalio and Buffett are warning about.
But the spot reading is only the front page. The VIX futures curve tells a more layered story.
| Contract | Approximate level | What it signals |
|---|---|---|
| Q (front) | ~15 | Near-term calm; market expects muted moves over the next 30 days |
| U (next) | ~18-23 | A meaningful step up; market prices more uncertainty 2-3 months out |
| V onward (outer curve) | Low-to-mid 20s | Medium-term risk acknowledged; higher volatility expected 6-18 months out |
The December SPX options data sharpens the picture further. A put struck near the 7,235 level, sitting some 460-470 points below the current price, carries a premium of around $12,000 for the December cycle. A call positioned a comparable distance above the market, near 8,170, fetches a premium of around $9,400. The gap between the two reflects the additional call-side cost attributable to prevailing interest rate conditions, but the put pricing carries its own message.
Pricing the December options out implies roughly a 30% chance that the SPX finishes the year beneath its June low near 7,235.
That 30% figure is where you should pause. The options market is not dismissing a significant drawdown. It is simply not pricing that drawdown as something that happens in the next few weeks.
Why realised volatility, not macro fear, drives near-term implied volatility
The disconnect between extreme valuations and a calm VIX is not a mystery once you understand the mechanism. Four structural factors explain it, and none of them require the options market to be either wrong or complacent.
- Realised volatility anchors implied volatility. Options market makers set implied volatility partly based on how much the market has actually been moving. When intraday ranges compress, as they have in recent weeks, implied volatility follows mechanically, pulling down the VIX regardless of what macro conditions look like on a spreadsheet.
- The time horizons do not match. The VIX measures expected volatility over approximately the next 30 days (as defined by Cboe methodology). Valuation-based bear arguments, citing the Buffett Indicator and AI spending ratios, operate on multi-year cycles. This mismatch structurally produces situations where long-term risk looks extreme while near-term expectations stay modest.
- Institutional hedging is partly invisible. The VIX is calculated from listed S&P 500 options only. Large institutions frequently hedge via OTC derivatives, futures, or structured products that do not appear in the VIX calculation. Significant hedging activity may be happening without moving the quoted number.
- Contango is the baseline, not a warning signal (see below).
Realised volatility anchors implied volatility because options market makers are pricing what the market has actually been doing, not what macro conditions suggest it should do; when intraday ranges compress, the VIX follows mechanically regardless of the fundamental backdrop.
Contango is the baseline, not the exception
VIX futures are in contango, meaning front-month contracts trade below longer-dated contracts, for the majority of historically observed periods. An upward-sloping curve is the default state, not a distress signal.
What matters is not whether the curve is in contango, but whether the slope is steepening or flattening. A steepening curve means the market is pushing risk further out in time. A flattening curve means the gap between “calm now” and “uncertain later” is narrowing. That distinction is far more informative than the contango label alone.
The core point for you: a low VIX does not mean the options market has concluded everything is fine. It means the options market is priced for what is likely to happen in the next 30 days given current realised conditions, and that is a structurally different question from whether equities are overvalued on a three-year view.
What the curve’s shape is quietly acknowledging
The contango structure is not silent on the bears’ thesis. It is deferring to their timeline.
The spread between spot VIX in the mid-15s and outer-curve futures in the low-to-mid 20s represents a 5-7 point gap. That gap is the market embedding a volatility premium for the medium-term horizon, even as it stays calm on the 30-day view. Research characterises the current structure as “compressed contango”: the slope is present but somewhat flatter than long-term historical norms, suggesting the market is acknowledging medium-term risk without becoming alarmed about it.
The options market is effectively saying: not yet, but the risk is being priced further out.
Reading the curve in two steps makes the signal legible:
- The front of the curve (spot VIX mid-15s, Q contract at approximately 15) tells you the market expects relatively muted moves over the next month, based on current realised volatility and positioning.
- The back of the curve (outer contracts in the low-to-mid 20s) tells you the market is implicitly pricing materially higher volatility for the 6-18 month horizon, consistent with the risk the macro bears are describing.
The outer-curve elevation does not contradict the Buffett Indicator readings at 238-243%. It defers to them. For you, that spread between front and back is more informative than the spot VIX headline alone, because it tells you the market is distributing risk across time rather than ignoring it.
The one signal that tells you when the options market starts agreeing with the bears
The most actionable metric in this entire framework is not the spot VIX level. It is the shape of the VIX curve, specifically whether it begins to flatten or invert.
Right now, the front VIX contract (Q) sits at approximately 15, while the U contract trades at approximately 18-23, a gap of 3-8 points. That spread represents the difference between “calm now” and “uncertain later.” The signal to watch is what happens to that gap.
| Curve regime | What it looks like | What it means for near-term risk |
|---|---|---|
| Contango (current) | Front contracts below back contracts | Near-term calm; risk deferred to medium-term horizon |
| Flattening | Front contracts rising toward back contracts; spread narrowing | Transition zone; market beginning to price near-term uncertainty |
| Backwardation | Front contracts above back contracts | Acute near-term fear; historically associated with market stress periods |
A narrowing spread between the front and outer contracts means the market is beginning to price the bears’ thesis as a near-term event rather than an eventual one. Backwardation, where front contracts trade above back contracts, signals acute fear: investors buying immediate protection, not deferred protection.
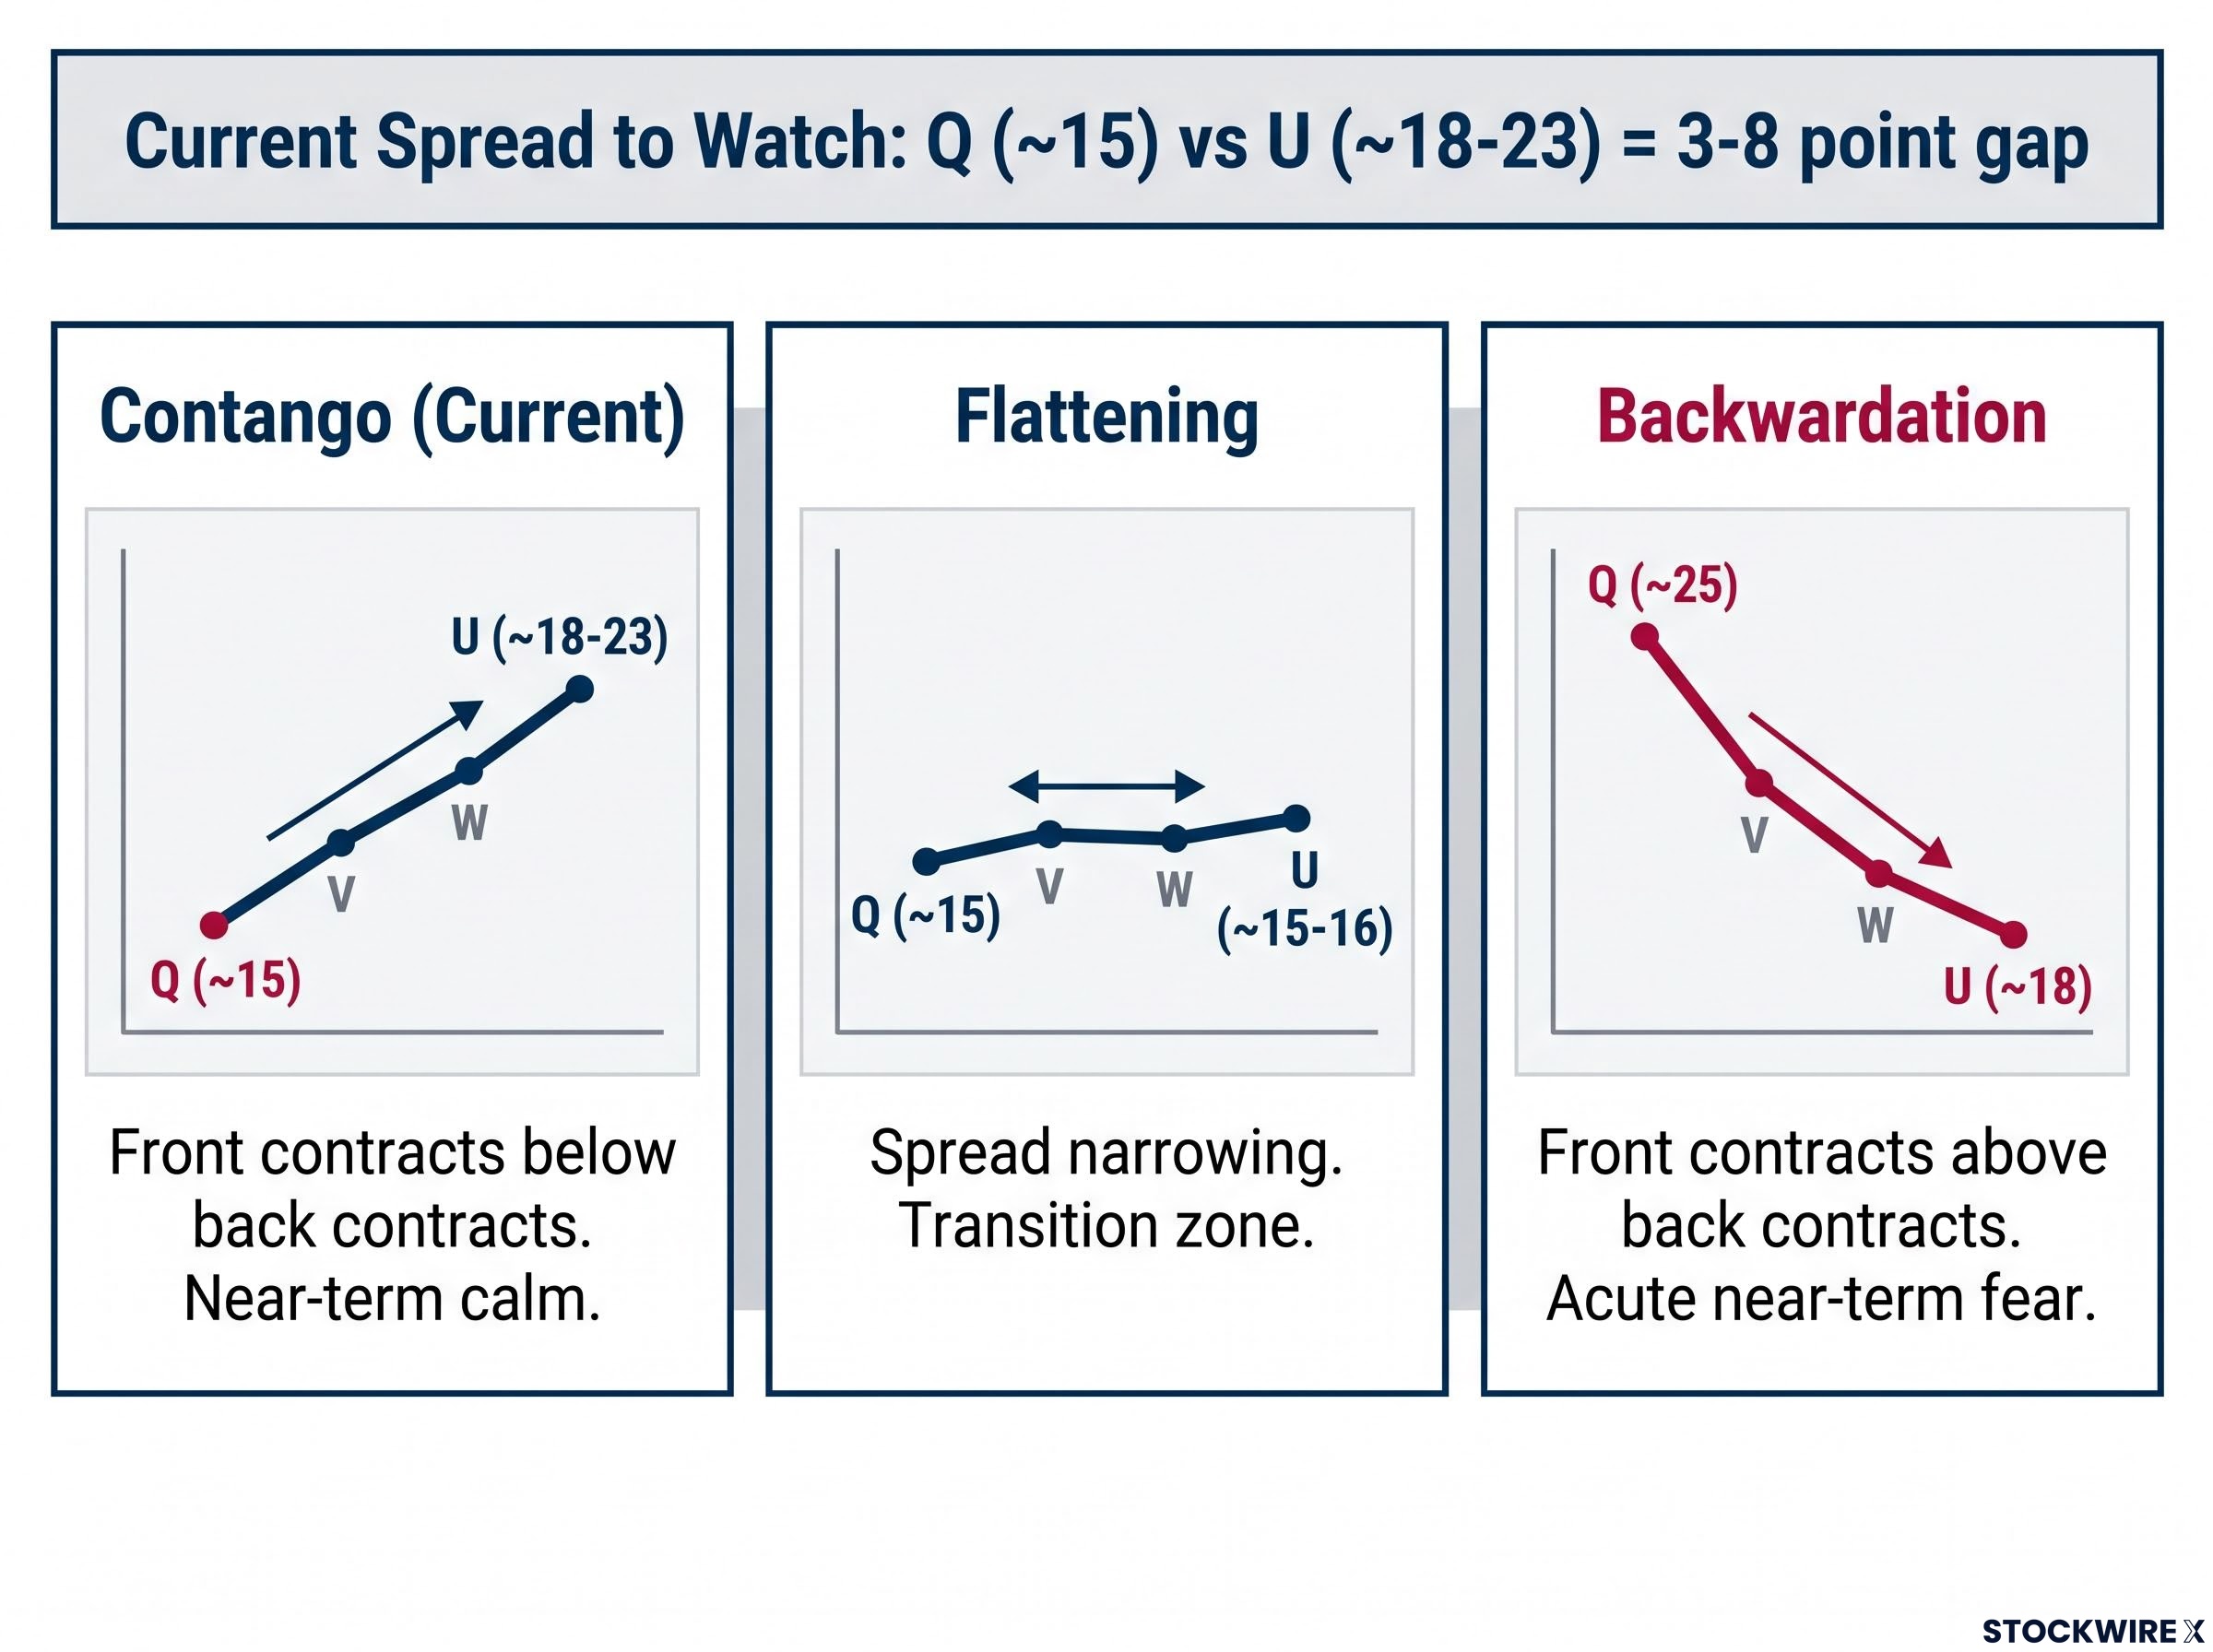
Valuations tell you the risk exists. The VIX curve shape tells you when the market is beginning to price that risk as imminent. Monitoring this spread is more useful than watching the spot VIX in isolation, because it separates “the market is generally nervous about something later” from “the market thinks something is happening right now.”
What the disconnect actually means for how you position now
Extreme valuations by the Buffett Indicator (238-243% as of mid-August 2026) plus subdued near-term implied volatility (spot VIX mid-15s) does not mean one signal is wrong. It means they are measuring different things on different time horizons.
The practical framework for holding both signals simultaneously comes down to three points:
- What the valuation signal tells you: the margin of safety has been substantially eroded by historical standards. What it does not tell you: when the correction arrives.
- What the near-term VIX reading tells you: the options market expects relatively quiet price action over the next 30 days. What it does not tell you: whether that calm persists beyond that window. The approximately 30% year-end drawdown probability embedded in December options suggests it may not.
- What the curve shape tells you that neither signal alone can: the moment the front-to-back spread begins to narrow, the options market is converging with the macro bears on timing. That convergence point is when position-sizing decisions become most consequential.
The convergence point between valuation risk and near-term volatility pricing is also the moment when portfolio risk management decisions carry the most consequence, because position sizing calibrated only to dollar weights can hide extreme risk imbalances that only become visible during a drawdown.
When near-term implied volatility is low, the cost of purchasing downside protection is lower, even if the macro case for owning that protection is high. The disconnect, in other words, may actually be offering something useful: relatively cheap insurance at a time when the structural case for carrying it is strong.
The bears and the options market are not in contradiction so much as in a temporal argument. The VIX curve’s shape is the instrument that resolves that argument in real time. Watching it is more useful than choosing a side.
For investors wanting to translate the valuation argument into a concrete positioning framework, our dedicated guide to monitoring Berkshire deployment signals walks through how to track Greg Abel’s quarterly 13F filings as a deployment trigger and build a pre-researched watchlist with pre-calculated buy prices.
This article is for informational purposes only and should not be considered financial advice. Investors should conduct their own research and consult with financial professionals before making investment decisions. Past performance does not guarantee future results. Financial projections are subject to market conditions and various risk factors.