

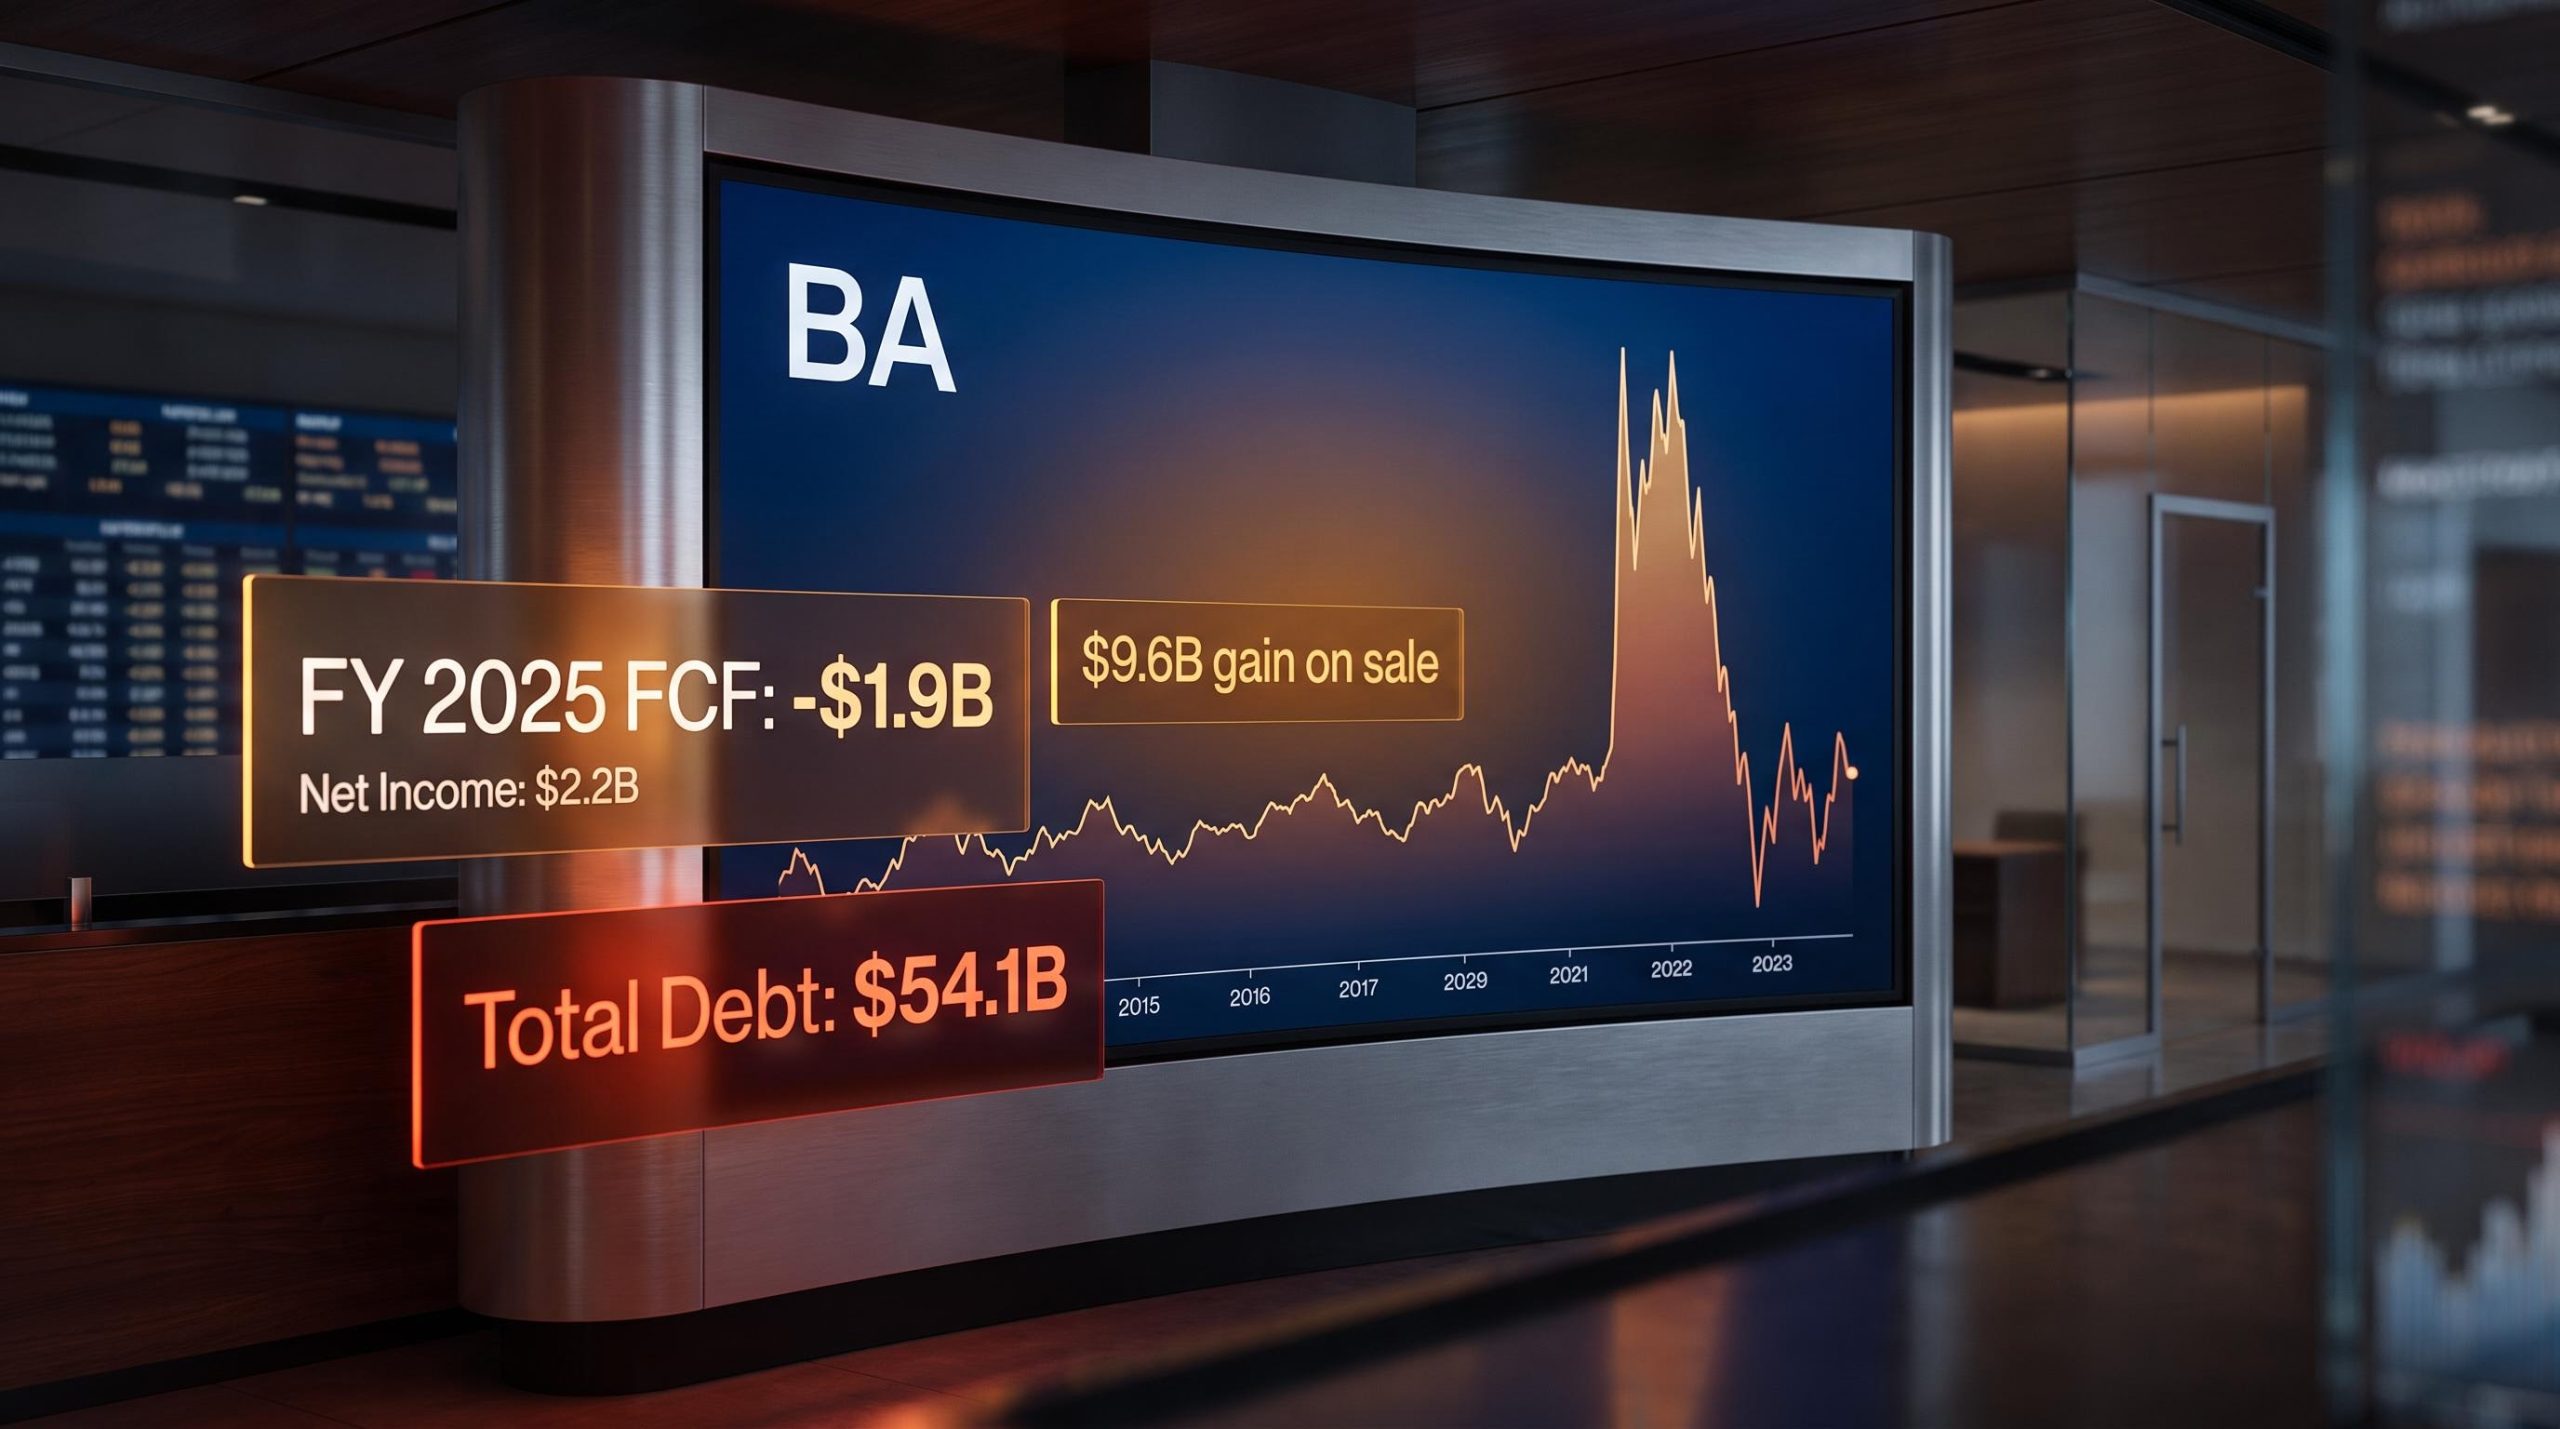
Boeing reported positive net income for 2025. That headline is technically accurate and almost entirely misleading.
A single $9.6 billion gain from the sale of its Digital Aviation Solutions business drove the apparent earnings turnaround. Strip that out, and Boeing’s core operations are still grinding through a recovery that began in 2018 and has not yet produced a single full year of positive free cash flow. For investors trying to evaluate BA stock, the surface-level numbers actively obscure what is happening underneath.
After working through five distinct analytical layers, from net income distortion through to valuation, you will have a clear framework for separating genuine operational progress from accounting noise, and a grounded basis for assessing whether Boeing’s current share price reflects reality or assumes a recovery the company has not yet demonstrated.
Why Boeing’s 2025 net income figure requires an immediate asterisk
Start with what the headline said. For FY 2025, Boeing reported GAAP net income of $2.2 billion, a 2.5% net margin. After FY 2024’s -17.8% net margin and FY 2023’s -2.9%, a positive figure looked like a turning point.
Then look at where the profit came from. In Q4 2025, Boeing closed the sale of its Digital Aviation Solutions business for $10.55 billion and recorded a $9.6 billion gain on the transaction. That single gain contributed $11.83 to earnings per share. The reported Q4 GAAP EPS was $10.23; core (non-GAAP) EPS came in at $9.92.
The $9.6 billion gain on sale inflated a single reporting period into apparent profitability. Because that transaction cannot be repeated, the 2.5% net margin it produced tells you nothing reliable about the ongoing earning capacity of the business.
Here is what the Q4 EPS actually breaks down to:
- Reported GAAP EPS: $10.23
- Per-share contribution from the Digital Aviation Solutions gain: $11.83
- Implied EPS excluding the transaction: deeply negative
A reader who sees “Boeing returned to profitability in 2025” without this adjustment is evaluating the stock on a figure that will not repeat. Every forward assumption built on that headline number, from price-to-earnings ratios to earnings growth projections, starts from a flawed foundation.
When big ASX news breaks, our subscribers know first
What two decades of Boeing margins reveal about the crash and the comeback
Through most of its recent commercial history, Boeing’s operating margins settled into a band of roughly 6-8%. That range reflects the normal economics of a large, capital-intensive aerospace manufacturer and provides the reference point against which any recovery should be assessed.
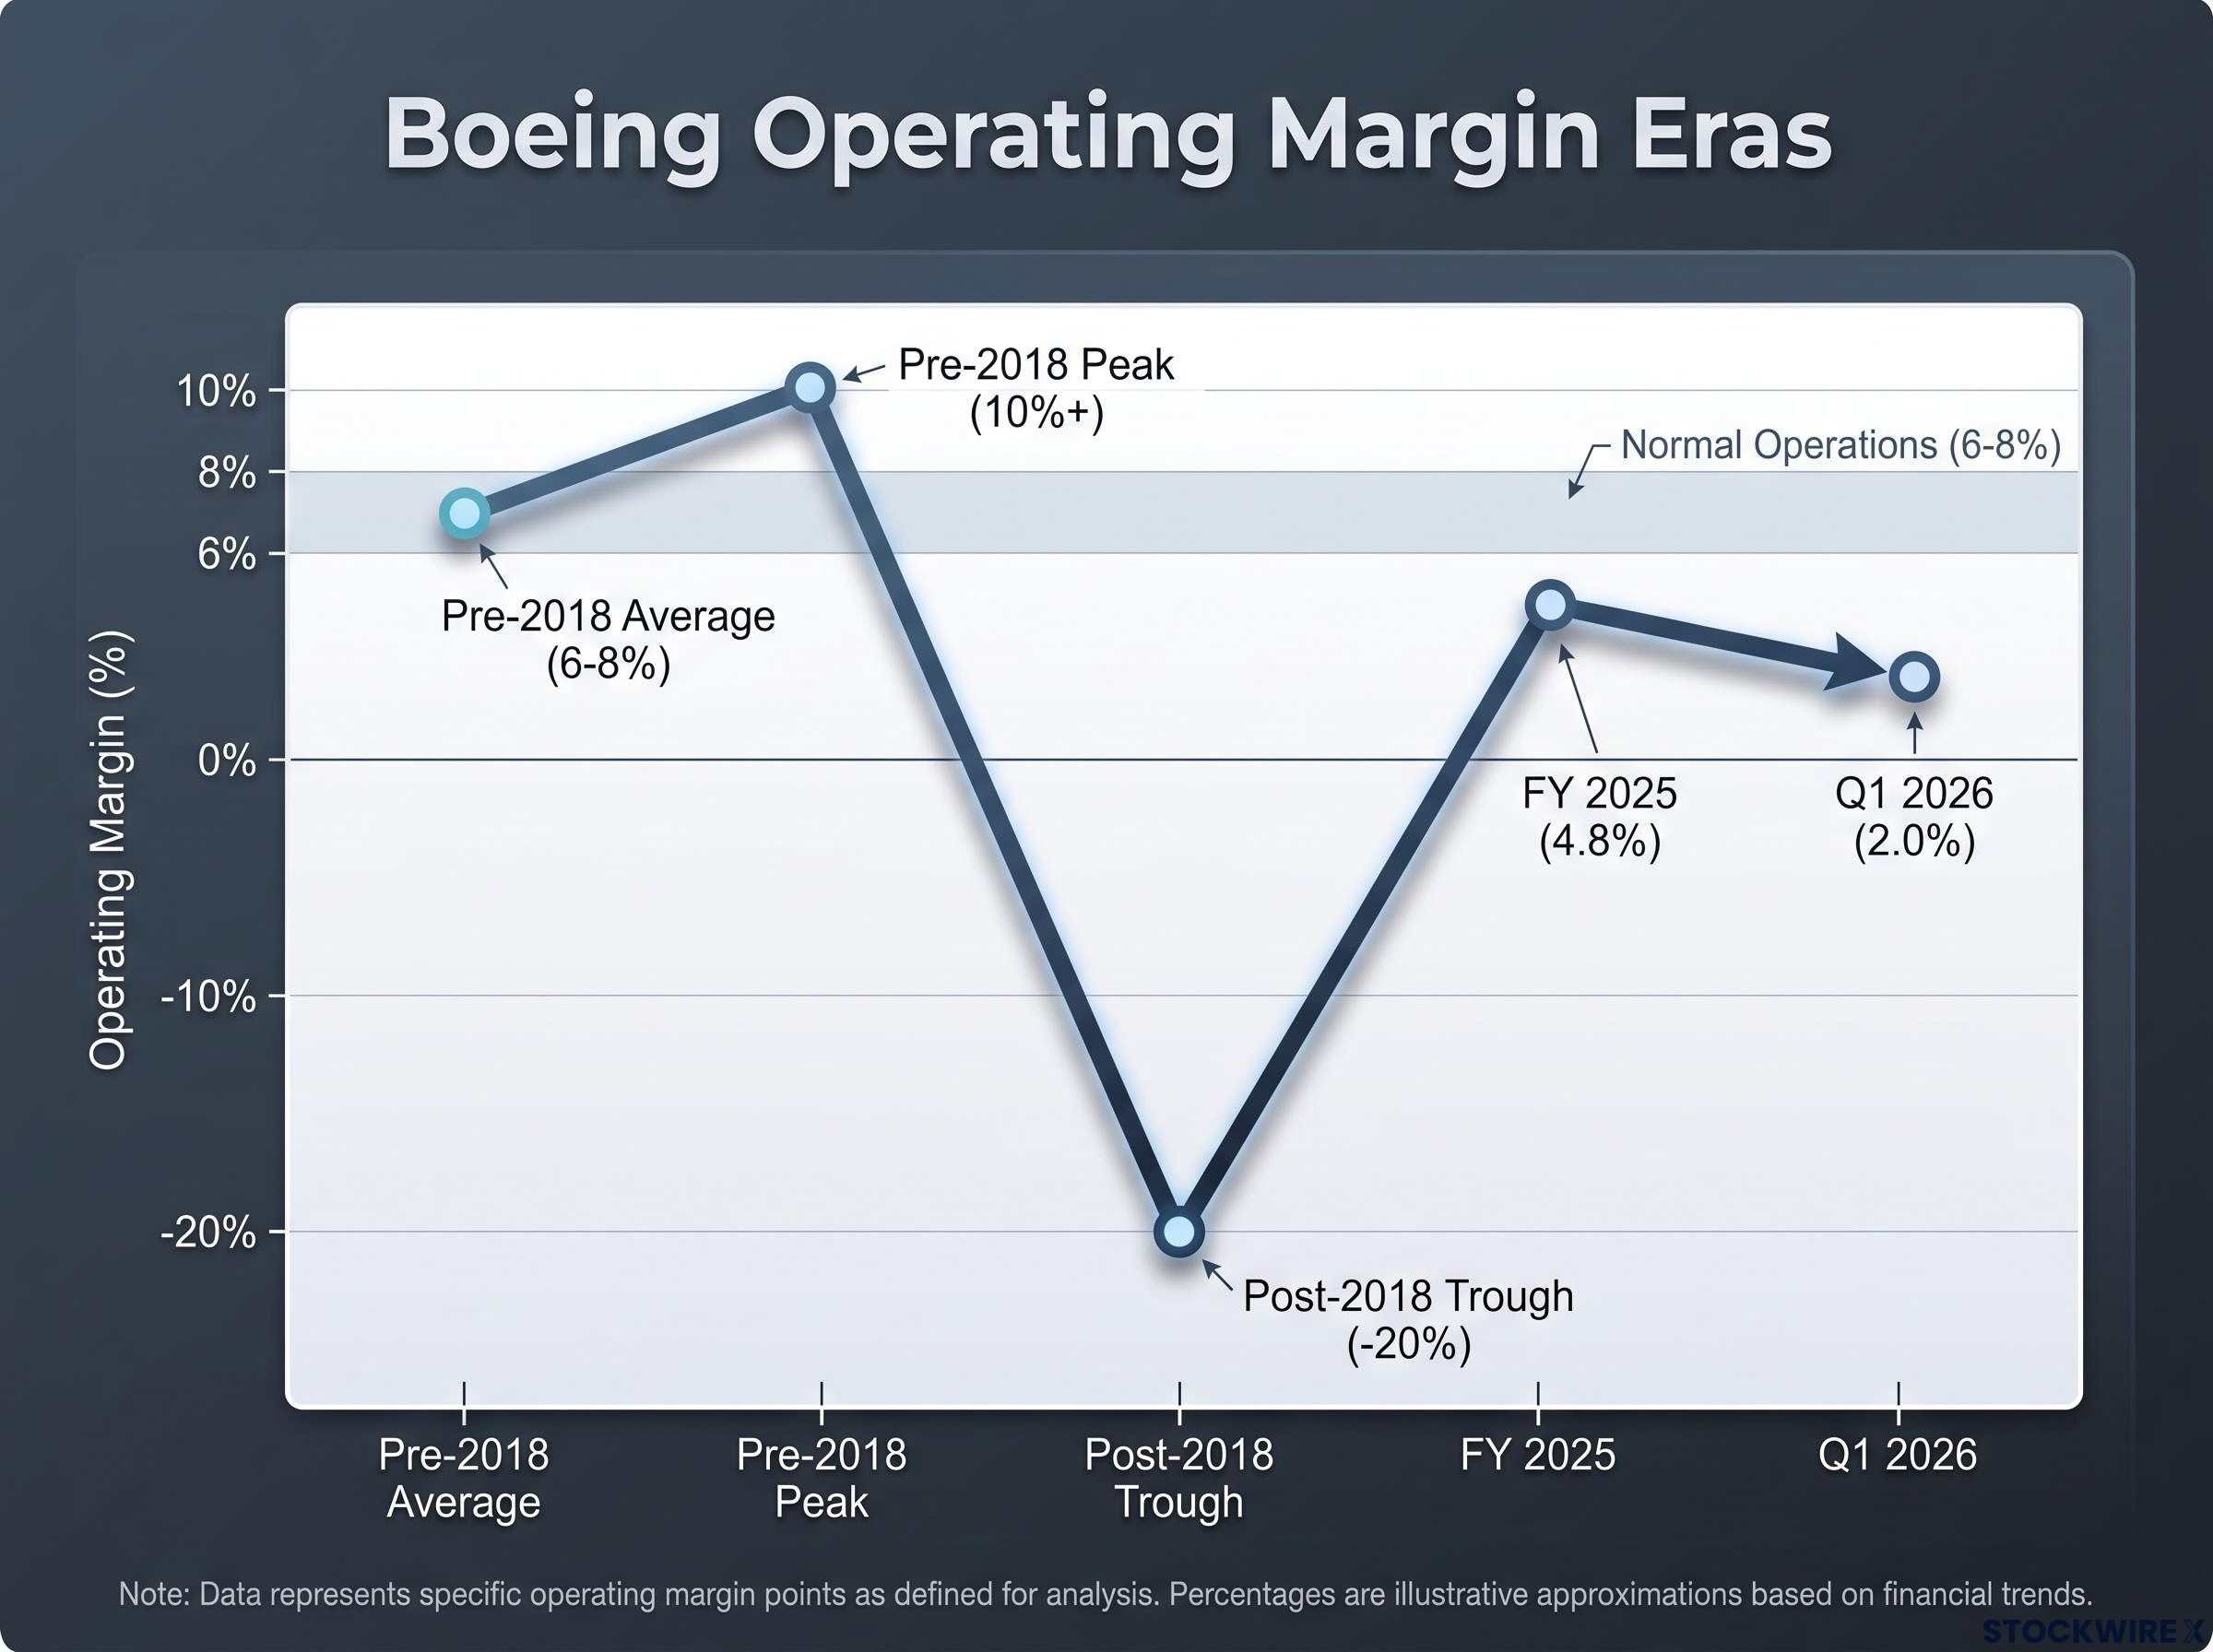
In the years before 2018, margins pushed above that band, approaching or exceeding 10% in some periods. The drivers were not structural gains in pricing power or verifiable efficiency improvements. They came from faster production schedules, heavy cost-cutting, and, as investigations and subsequent reporting made clear, a pullback in quality and safety investment. The margin expansion and the safety failures that followed are two sides of the same story: rising margins do not automatically signal a healthier business.
After the 737 MAX grounding, pandemic disruptions, 777X delays, and quality investigations, operating margins collapsed into deeply negative territory, reaching approximately -20% in parts of the recovery period.
Aerospace and defence sector dynamics, including multi-year government appropriations cycles and the separation between structural and cyclical industrial names, provide the macro backdrop against which Boeing’s recovery trajectory should be assessed, particularly given that defence contract charges continue to compete directly with the company’s debt reduction capacity.
| Era | Approximate Margin Range | Key Driver | Investor Signal |
|---|---|---|---|
| Pre-2018 historical average | 6-8% | Stable production, normal cost structure | Healthy baseline |
| Pre-2018 peak period | Approaching 10%+ | Cost-cutting, production speed, reduced safety investment | Warrant scepticism |
| Post-2018 crisis trough | Approximately -20% | Grounding, charges, quality failures | Structural impairment |
| FY 2025 partial recovery | 4.8% | Delivery ramp, cost normalisation | Progress, not completion |
| Q1 2026 | 2.0% | Quarter-to-quarter volatility | Recovery still uneven |
Reading the recovery: what margin trajectory tells you now
A slow grind back toward 6-8% is more credible than a rapid return to 10%-plus. The FY 2025 annual operating margin of 4.8% represents genuine improvement from the crisis trough, but it remains below the historical normal band. Q1 2026 at roughly 2.0% operating margin (revenue of $22.2 billion, operating income of $448 million) shows the recovery path is not a straight line.
Re-entering the 6-8% band on a sustained basis is the meaningful stabilisation marker. If margins were to climb rapidly back above 10%, that would warrant serious scrutiny, because the pre-crisis period showed exactly what margin expansion driven by cost-cutting and speed can lead to.
The one metric the asset sale could not inflate
FCF (free cash flow), calculated as operating cash flow minus capital expenditures, is analytically insulated from the distortions above. Under GAAP, the proceeds from the Digital Aviation Solutions sale flow through investing cash flows rather than operating cash flows, which means they are excluded from the FCF calculation. An asset disposal can flatter net income; it cannot flatter FCF.
| Period | FCF (billions) | FCF Margin | Interpretation |
|---|---|---|---|
| FY 2024 | -$14.3 | -21.5% | Deep cash burn |
| FY 2025 | -$1.9 | -2.1% | ~87% improvement, still negative |
| Q4 2025 | +$0.4 | Positive | Genuine operational improvement |
| Q1 2026 | -$1.5 | Negative | Immediate reversal, volatility persists |
Net income was positive in FY 2025, driven by the asset sale. Full-year free cash flow was still negative at -$1.9 billion. These two figures tell entirely different stories about operational health.
The structural gap between free cash flow vs EPS is not unique to Boeing; Morgan Stanley’s analysis of S&P 500 earnings season found that stocks where EPS beat but FCF estimates fell actually underperformed peers, while those with upward revisions to both metrics outperformed by 1.6%.
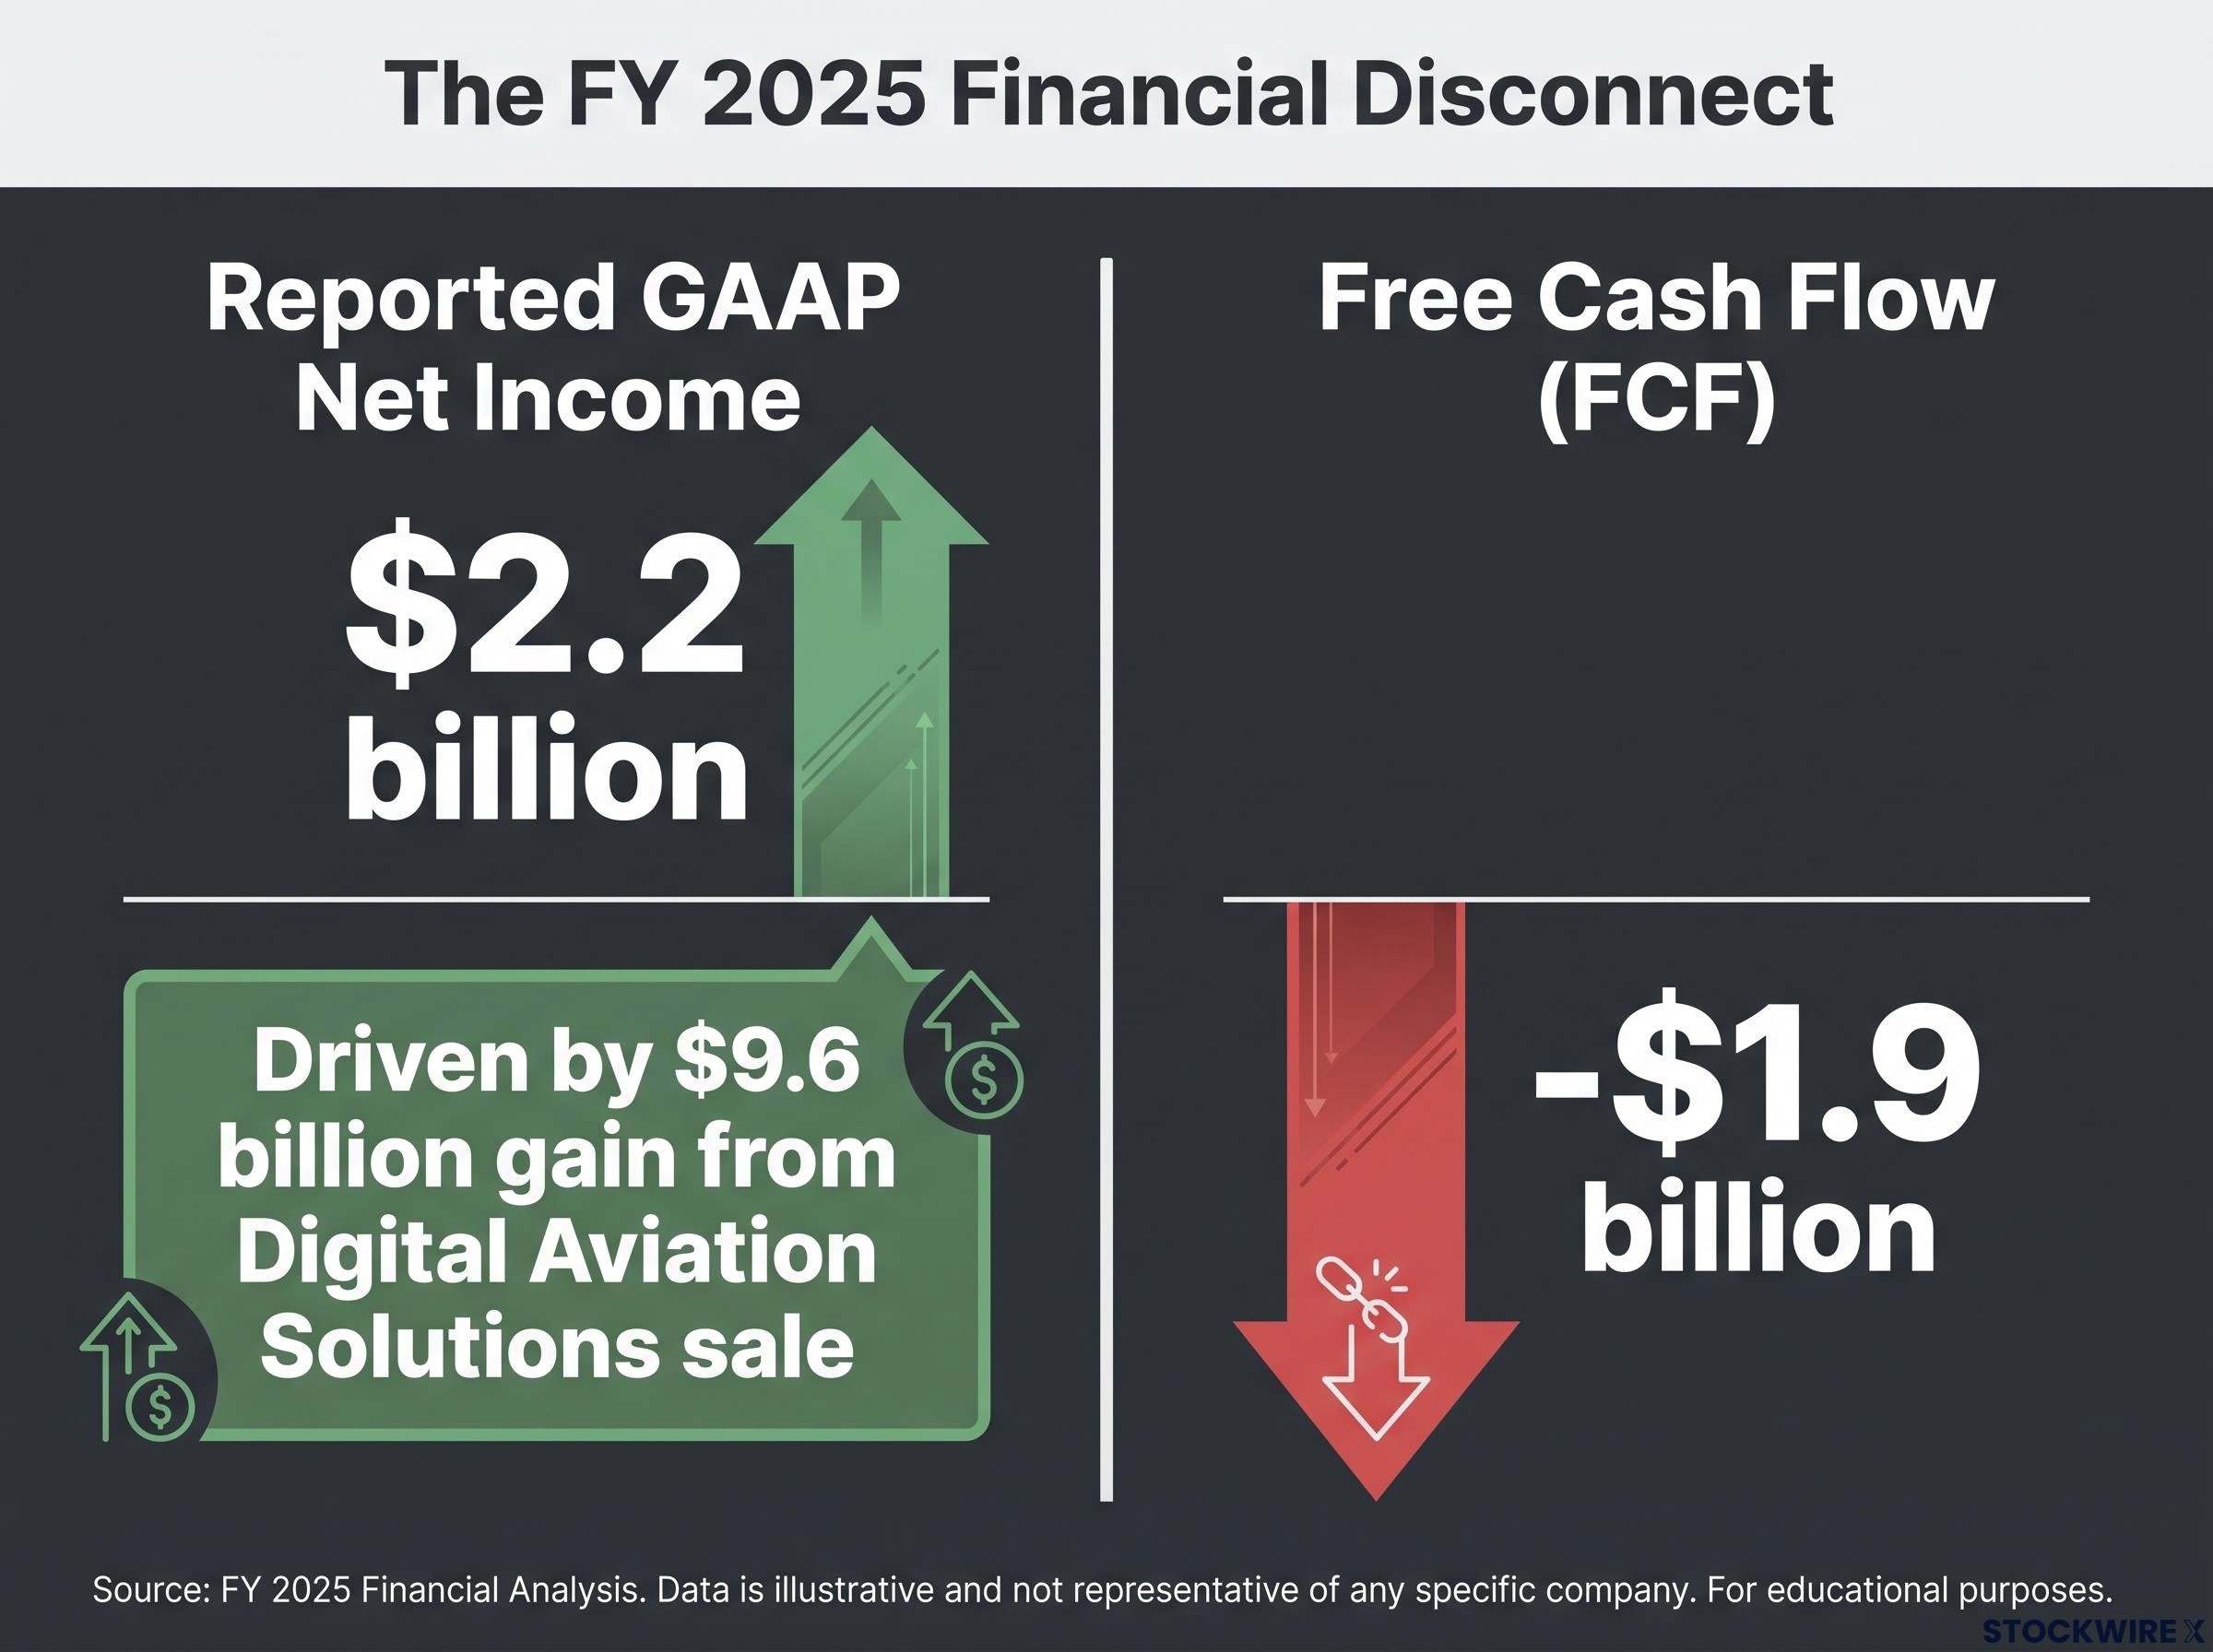
Q4 2025’s positive FCF of approximately $0.4 billion reflected improved deliveries and working capital management, not the asset sale. It is one of the few recent numbers that captures genuine operational progress. But Q1 2026 immediately reversed it, with FCF of -$1.5 billion on operating cash flow of -$0.2 billion.
One quarter does not confirm a trend. For any BA stock thesis, FCF is the anchor. Long-run equity value depends on Boeing converting intermittent positive FCF into durable, multi-year positive cash generation. That is a different and more demanding standard than the earnings recovery that headlines tend to celebrate.
How to build a reusable checklist for reading any turnaround balance sheet
The four analytical layers this article has examined apply beyond Boeing. Here is a structured checklist, anchored to specific Boeing data, that works for any complex industrial turnaround:
- Net income: strip the one-time items. Identify asset sale gains, tax credits, or fair value adjustments in the footnotes and MD&A. For Boeing, the $9.6 billion gain on sale produced a headline profit in a year when the underlying business remained loss-making. Because that gain is non-recurring, any earnings figure incorporating it cannot be used as a starting point for forward projections. The forward question: is reported net income repeatable without extraordinary items?
- Operating margins: compare to the historical band. Establish the company’s long-run normal margin range and measure current margins against it. For Boeing, the 6-8% band is the appropriate reference; the 4.8% recorded in FY 2025 shows directional progress but is not yet recovery. Margin improvement also needs to be interrogated for its source: gains built on sustainable operational improvement are categorically different from those achieved through cost reductions that introduce quality risk. The forward question: are margin improvements coming from sustainable operational changes or from cuts that carry hidden risk?
- Free cash flow: verify classification and definition. Distinguish between cash generated by operations and cash received from asset disposals or other investing activities. Because the Digital Aviation Solutions proceeds were classified as investing cash flows, they do not appear in FCF, which is why FY 2025’s FCF of -$1.9 billion captures something that net income does not: the core business is still consuming cash. When reviewing Boeing’s disclosures, note that the company reports “free cash flow (non-GAAP)” and the specific definition should be confirmed before use. The forward question: is FCF trending toward durably positive across multiple consecutive periods?
- Balance sheet: track debt, equity, and share count. Boeing carried approximately $54.1 billion in total debt at year-end 2025 following the Spirit AeroSystems acquisition. Shareholders’ equity turned positive post-transaction after previously sitting around -$8 billion. The share count trajectory has also shifted: the gradual reduction through buybacks that characterised the pre-crisis period went into reverse after 2018, with equity issuance diluting per-share metrics. The forward question: is net debt declining meaningfully, and has the share count stabilised?
Boeing’s balance sheet carries enough leverage that any new operational setback, whether a quality event, programme delay, or macro shock, lands on a structure with limited additional cushion. For anyone holding BA stock, monitoring these debt metrics is not optional.
This article is for informational purposes only and should not be considered financial advice. Investors should conduct their own research and consult with financial professionals before making investment decisions.
What a DCF framework says about BA stock’s current risk-reward
A discounted cash flow (DCF) model, which estimates a company’s value by projecting its future cash flows and discounting them back to today’s dollars, is a directional tool for Boeing rather than a precise forecast. Too many variables remain unresolved to pretend otherwise.
A set of inputs broadly consistent with analyst modelling for this company would include: near-term FCF growth in the region of 15% per year as the business continues to normalise, a terminal perpetual growth rate of 2-2.5% reflecting the long-run economics of a mature industrial company, and a projection horizon of around 10 years.
Estimates of Boeing’s intrinsic value using conservative DCF inputs place the company in the low-to-mid $200s per share, with a 45-50% increase in shares outstanding since 2019 acting as a structural headwind that reduces per-share FCF at any recovery level by roughly 30-45% relative to what pre-crisis shareholders experienced.
Under those inputs, some models suggest Boeing may be modestly undervalued at current prices. The margin of safety is thin, though, given the risk profile:
- Ongoing quality and regulatory exposure with no guarantee against further incidents
- $54.1 billion in total debt, with interest expense and maturities consuming cash flow
- FCF still volatile, swinging between positive and negative on a quarterly basis
- Operating margin at 4.8%, still below the 6-8% historical normal band
- A history of repeated negative surprises since 2018 that has eroded investor confidence
Across one-year, three-year, and five-year measurement periods, Boeing shareholders have seen returns close to zero. The share price has largely moved sideways even as the market has repeatedly anticipated an operational recovery that the underlying results have not yet confirmed.
At current prices, the BA stock thesis requires a smooth, uninterrupted multi-year recovery in both margins and FCF. That is precisely the execution track record Boeing has not yet established since 2018.
What would change the thesis
Three forward indicators would shift the risk-reward: operating margin sustained above 6% across multiple reporting periods, FCF durably positive for several consecutive quarters (not just one), and meaningful net debt reduction from the current $54.1 billion level.
Share prices in the $100-$120 range have been highlighted by value-oriented analysis as a level where the risk-reward becomes more compelling relative to the operational and reputational uncertainty still surrounding the business. Current holders can reasonably monitor progress against those three indicators. New entry at today’s prices requires either higher conviction or a willingness to accept a recovery timeline that may extend well beyond current consensus expectations.
Past performance does not guarantee future results. Financial projections are subject to market conditions and various risk factors.
What genuine stabilisation looks like, and what Boeing has not yet shown
The analysis across these five layers converges on a specific set of forward markers. Genuine stabilisation for Boeing does not look like a headline EPS beat or a single quarter of positive cash flow. It looks like three things happening simultaneously over a sustained period.
| Metric | Current Level | Stabilisation Signal |
|---|---|---|
| Operating Margin | 4.8% (FY 2025) | Sustained above 6-8% band |
| Free Cash Flow | -$1.9B (FY 2025) | Positive across multiple consecutive periods |
| Net Debt | ~$54.1B (year-end 2025) | Meaningful and sustained reduction |
Boeing has demonstrated improvement on each metric. Operating margins are off the crisis floor. FCF improved 87% year-over-year in FY 2025. Shareholders’ equity has turned positive. None of these improvements have yet crossed the threshold into confirmed stabilisation, and Q1 2026’s FCF reversal to -$1.5 billion is a reminder of how uneven the path remains.
The gap between where Boeing sits today and those stabilisation thresholds is the risk embedded in the current share price. Closing that gap is what the next two to three years of results will determine. For existing holders, these three metrics in each quarterly release matter far more than headline EPS. For prospective investors, the question is whether the current price already assumes a recovery Boeing has not yet proven it can deliver.
For investors wanting to evaluate whether the production controls are genuinely embedded or still rhetorical, our full explainer on Boeing’s Q2 2026 delivery results examines the 787 programme’s restoration of delivery authority and the six to eight quarters of evidence analysts say are needed before the rate ramp can be considered validated.






