
Westpac’s share price fell after its Q3 2026 trading update, but the headline that moved the market, a 20% slump in mortgage applications since the May 2026 federal budget, tells income investors less about the next dividend than they might assume.
For shareholders holding Westpac primarily for its fully franked distributions, the relevant question is not whether mortgage volumes are falling (they are) but whether the earnings machinery funding the dividend is materially impaired today, or merely facing headwinds that may build over the next year or two. The answer requires looking at the Q3 numbers directly: profit growth, payout ratio, capital, and the actual lag between application declines and earnings impact.
Here is a structured read of the Q3 2026 data as it relates specifically to dividend capacity, so income investors have a clear evidence base for whatever decision they make next. The article does not offer personalised financial advice; it offers the analytical scaffolding to think the question through properly.
What the Q3 profit numbers actually say about dividend capacity
The share price reaction suggested distress. The profit line does not.
The Q3 2026 results showed Westpac recording statutory net profit of A$1.8 billion, a 3% increase over the prior two-quarter average. On an underlying basis, stripping out notable items, net profit came in at the same A$1.8 billion figure, representing 2% growth relative to the first-half FY2026 quarterly average. That is modest growth, but it is growth, and a shrinking earnings base would be the first mechanical sign that a dividend is under pressure.
Revenue composition tells a steadier story
Net interest income rose 2% in the quarter, while non-interest income fell 3%. The net interest margin (NIM), the spread between what Westpac earns on loans and pays on deposits, held at 1.89%, unchanged from the 1H FY2026 quarterly average. Total loans and customer deposits grew 2%, with business lending up 4% and institutional lending up 3%.
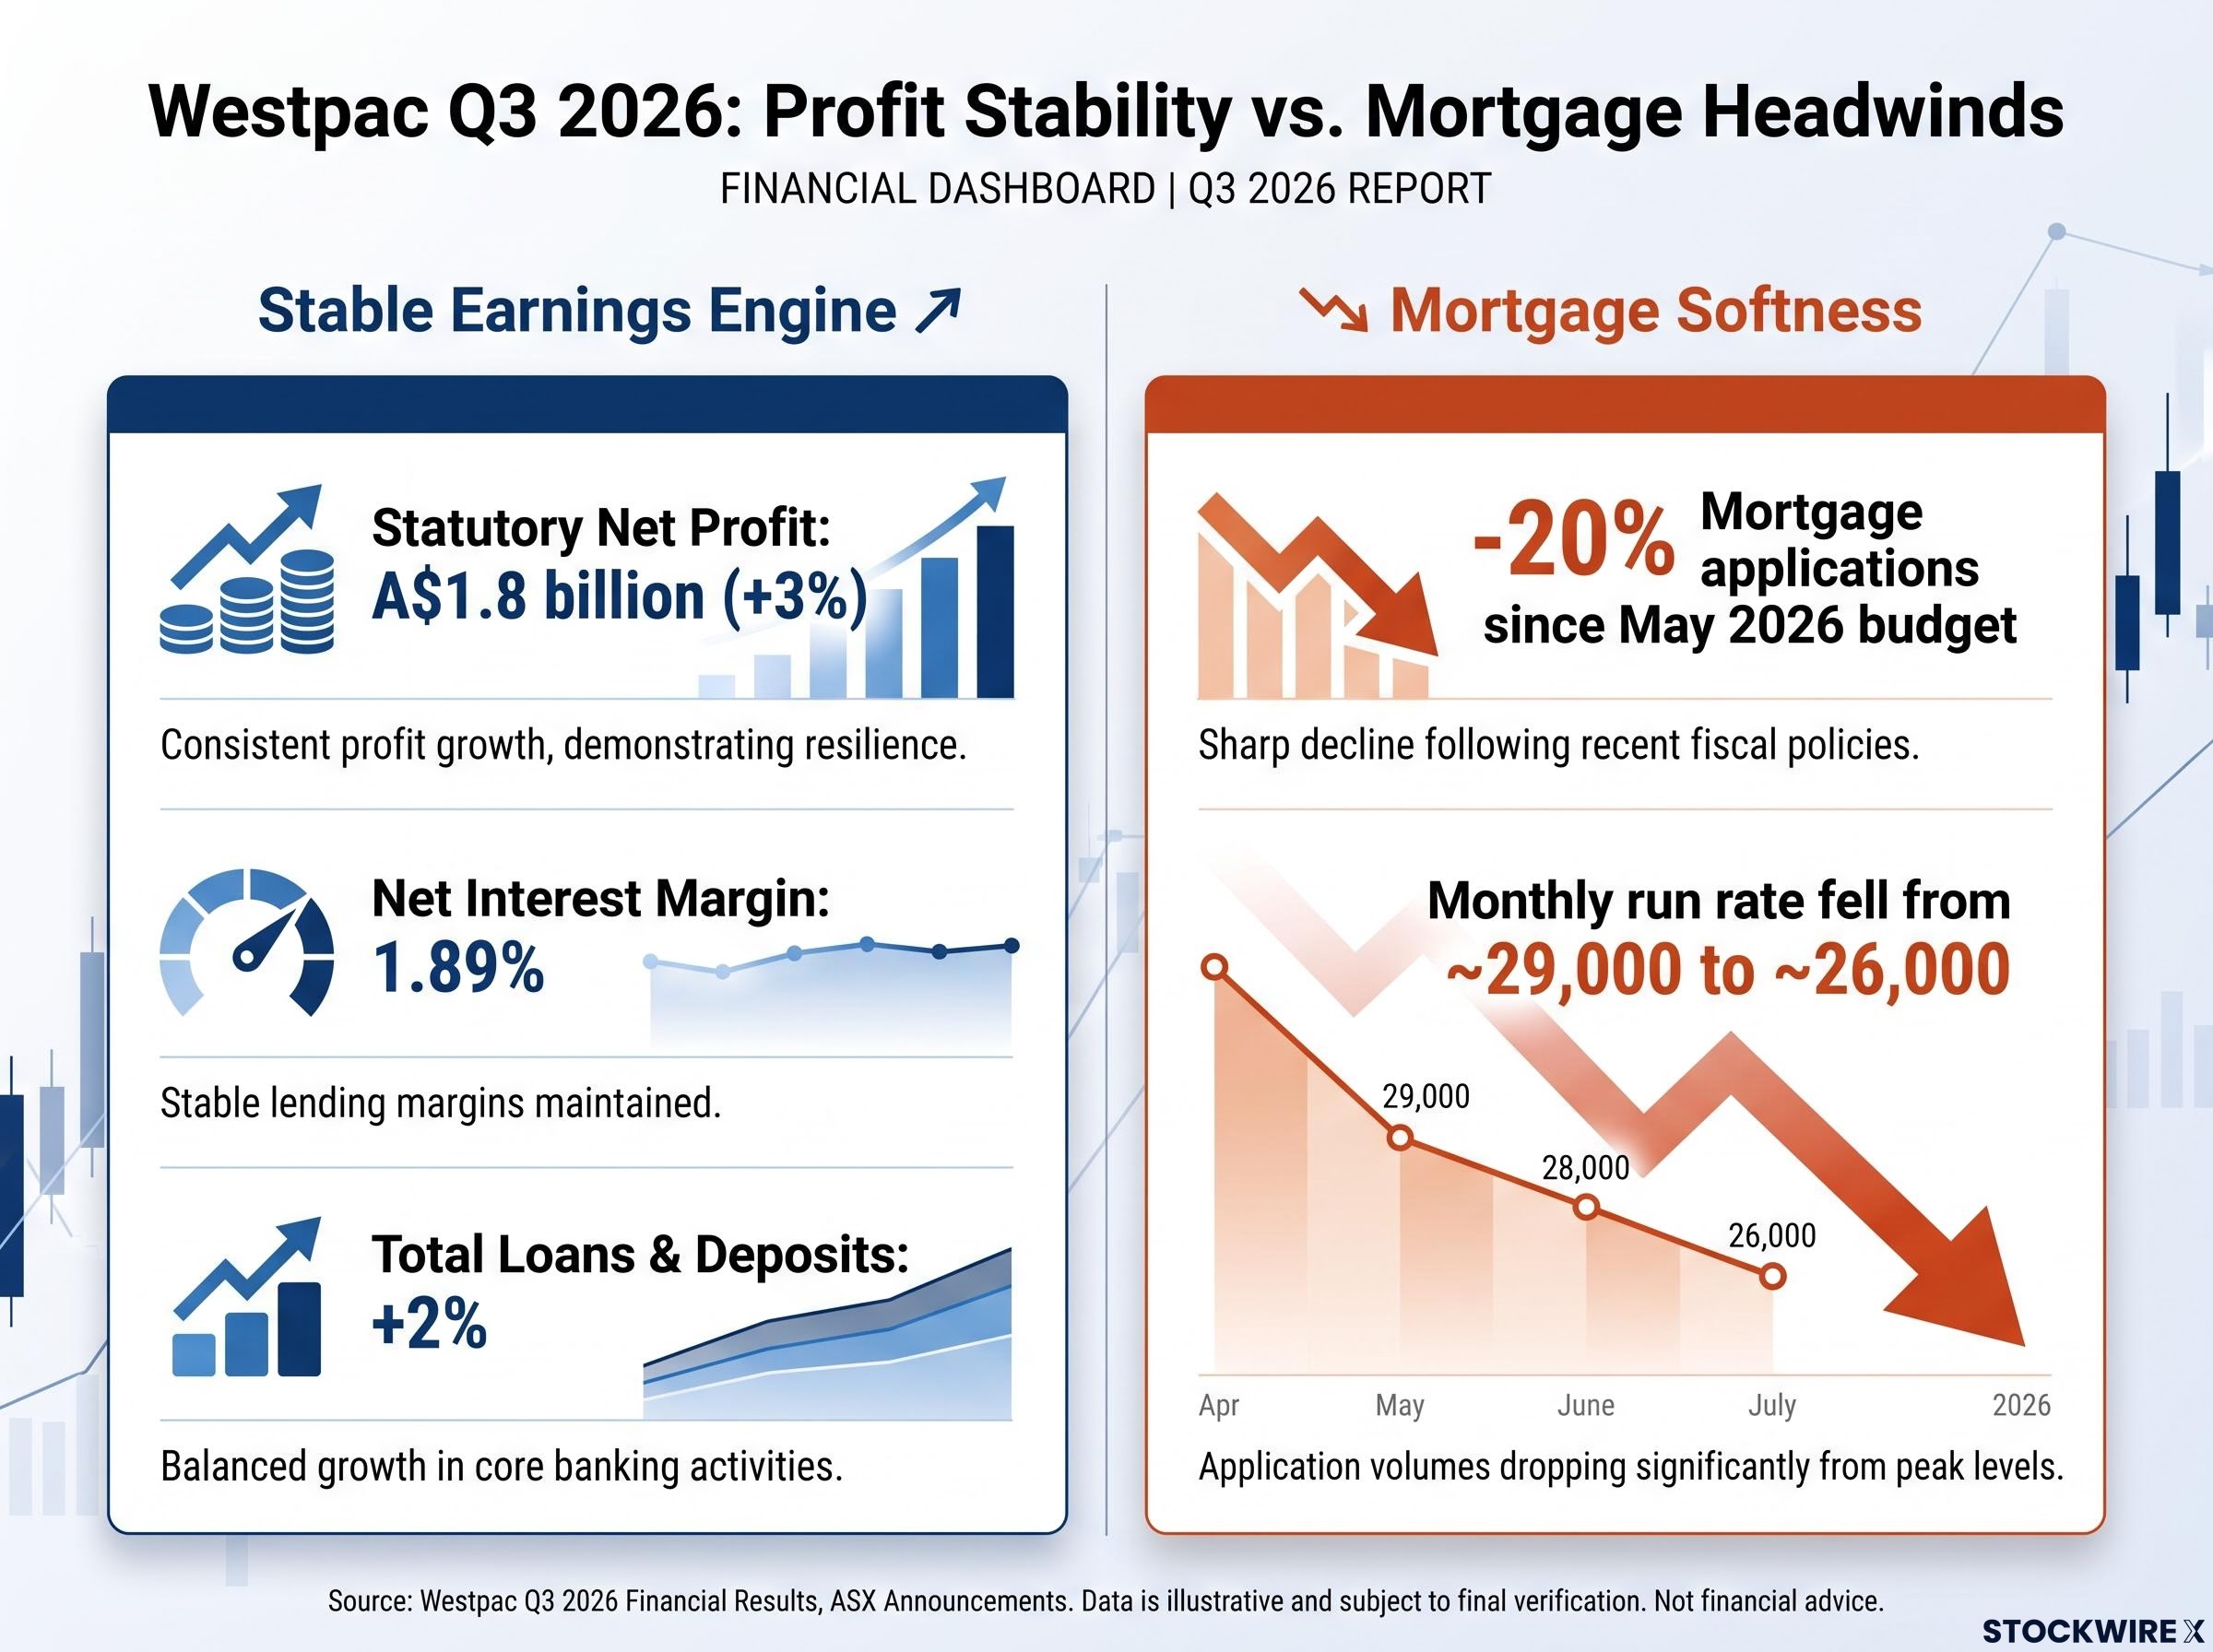
| Metric | Q3 2026 Value | Change |
|---|---|---|
| Statutory net profit | A$1.8 billion | +3% vs prior two-quarter avg |
| Net profit (excl. notable items) | A$1.8 billion | +2% vs prior two-quarter avg |
| Net interest income | — | +2% |
| Non-interest income | — | -3% |
| Net interest margin | 1.89% | Unchanged |
| Total loans and deposits | — | +2% |
A bank with growing profit and a stable NIM is not a bank whose dividend is under immediate mechanical pressure. That is the fact to hold clearly before engaging with the mortgage risk story.
The three core ASX bank valuation metrics, net interest margin, return on equity, and CET1 capital adequacy, interact in ways that make each ratio more meaningful when read in sequence rather than in isolation; a stable NIM paired with adequate CET1 tells a materially different story from a stable NIM accompanied by a declining capital buffer.
When big ASX news breaks, our subscribers know first
Reading the payout ratio: how much buffer does 75% actually give?
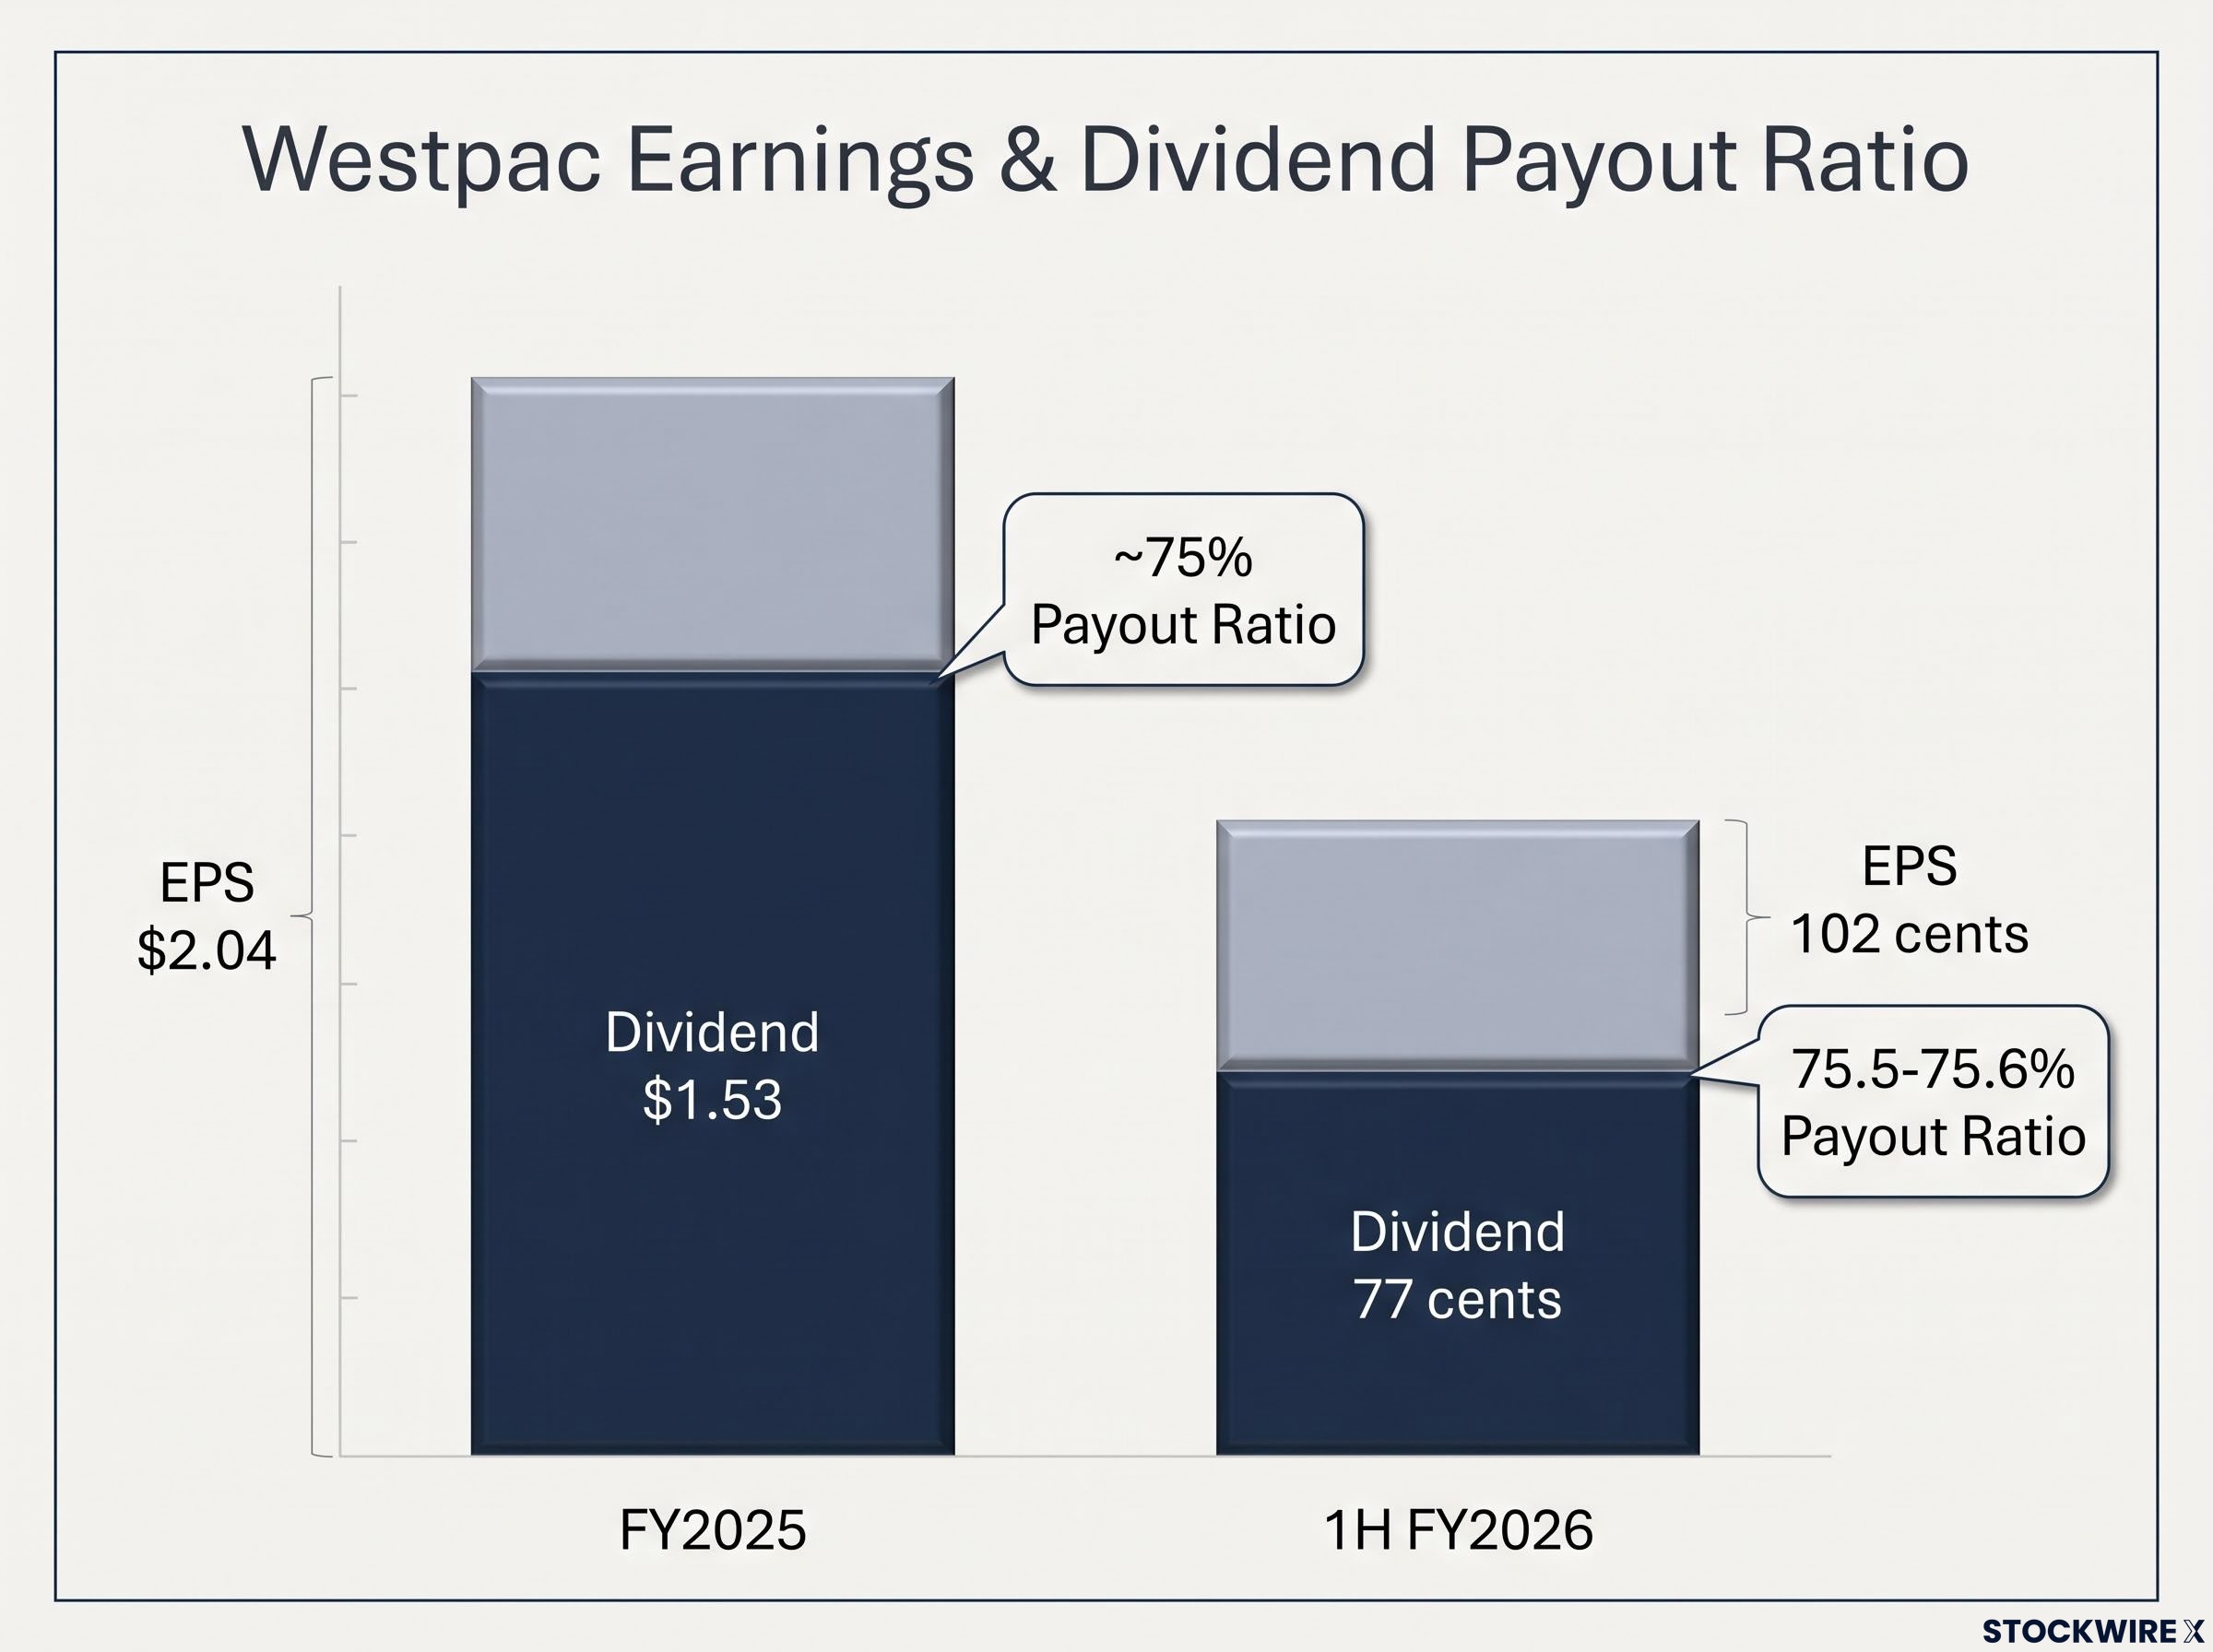
A payout ratio is the share of earnings a company pays out as dividends. At roughly 75%, Westpac retains about 25 cents of every dollar it earns. The dollar dividend only becomes mechanically difficult to sustain if earnings fall by more than that retained buffer can absorb.
The consistency across recent reporting periods is what matters here:
- 1H FY2026: Earnings per share (EPS) of 102 cents, interim dividend of 77 cents (fully franked), payout ratio of 75.5-75.6% excluding notable items (77.1% statutory)
- FY2025: EPS of $2.04, full-year dividend of $1.53, payout ratio of approximately 75%
- Estimated dividend yield as at 10 August 2026: 4.26%
At a 75% payout ratio and a 4.26% cash yield, the grossed-up yields available to Australian resident shareholders who can fully utilise franking credits sit materially higher than the headline figure, shifting the income comparison against term deposits and bonds in ways that the raw yield number alone does not capture.
Dividend yield: 4.26% At current pricing, this yield reflects a market that is pricing in some uncertainty but has not priced in a cut. A yield well above 5% on a Big Four bank typically signals the market expects a reduction.
The Big Four convention also matters. Australian major bank boards typically adjust the payout ratio percentage before cutting the dollar dividend outright. That gives shareholders a warning signal, a lower ratio in one period, before any nominal reduction arrives. Westpac’s board is not stretching to pay more than earnings justify. A 75% ratio with stable EPS is a structurally healthier position than a 90%-plus ratio would represent, because it leaves room to absorb a moderate earnings decline without touching the per-share distribution.
Why mortgage application declines are a lagged threat, not an immediate one
The mortgage numbers are genuinely weak. There is no way around the scale:
- Mortgage applications fell 11% sequentially (quarter on quarter)
- Applications dropped 20% since the May 2026 federal budget
- Investor applications fell 26% post-budget
- Owner-occupier applications fell 18% post-budget
Across Q3 as a whole, Westpac was processing roughly 29,000 home loan applications each month on average. That monthly run rate slipped to around 26,000 over the 15 May to 31 July 2026 window. The underlying drivers are structural: the May federal budget introduced changes to capital gains tax and negative gearing arrangements, compounding pressure from three separate RBA rate increases already delivered through 2026. Demand weakness rooted in policy shifts typically proves more durable than softness driven by cyclical factors alone.
Morgan Stanley’s post-downgrade analysis of housing cycle exposure across the Big Four ranks ANZ ahead of CBA precisely because CBA’s dominant mortgage market share creates the greatest differential risk from a sustained volume decline, a structural observation that applies to any bank carrying significant residential lending concentration.
Why the timing matters for income investors
The approval-to-settlement-to-earnings lag is the detail that separates the mortgage story from the dividend story, at least for now. Applications that fell in Q3 do not immediately reduce the loan book or net interest income. Existing loans continue to accrue interest. New settlements from applications lodged in prior quarters continue to land.
The proof is in the Q3 numbers themselves: total loan growth was still +2% despite the application slowdown. Business and institutional lending growth of 4% and 3% respectively is providing a partial offset, giving income investors a second variable to track alongside mortgage trends.
The 12-18 month lag between application trends and earnings impact means investors watching Q3 results should be asking what the Q4 2026 and 1H FY2027 numbers will look like. That is a meaningfully different question from whether today’s dividend is at risk.
The capital position and what it tells you about APRA risk
Westpac’s Common Equity Tier 1 (CET1) capital ratio, the key measure of a bank’s loss-absorbing capital that regulators use to assess financial strength, stood at 12.1% at 30 June 2026, down slightly from 12.4% in March 2026.
APRA’s APS 110 capital adequacy standard sets the minimum CET1 ratio at 4.5% for authorised deposit-taking institutions, with an additional 2.5% capital conservation buffer and a further 1.0% surcharge for domestic systemically important banks, placing the effective floor for major banks well below Westpac’s current 12.1%.
CET1 ratio: 12.1% The most historically reliable trigger for forced Big Four dividend cuts is a capital shortfall requiring APRA intervention. In 2020, APRA guidance during COVID-related uncertainty drove widespread dividend cuts across the sector. Today’s 12.1% sits well above regulatory minimums, and no system-wide credit crisis is evident in the current data.
The small sequential decline from 12.4% to 12.1% is worth tracking in Q4 disclosures, but it does not, on its own, signal stress. Credit quality metrics reinforce the picture:
- Credit impairment charges: 10 basis points of average gross loans (Q3 2026)
- Total expected credit loss (ECL) provisions: A$5.30 billion (58 bps of gross loans) at 30 June 2026, up from A$5.20 billion at March 2026
- The provisions increase reflects more severe downside scenarios in Westpac’s models, not a spike in actual arrears
For income investors, this separates two different risk vectors: whether Westpac can afford to pay the dividend (yes, based on earnings and capital) versus whether it will be instructed not to (not under current conditions). Each requires different monitoring.
Four scenarios that would change the dividend picture
Not all risks are equally likely. The following scenarios are ordered from the current base case through to the most structurally disruptive outcome.
| Scenario | Trigger condition | Dividend impact mechanism | Current evidence |
|---|---|---|---|
| Base case: Earnings broadly flat | Mortgage weakness proves transitory; business and institutional segments sustain growth | ~75% payout ratio maintained; dollar dividend steady | Q3 profit up 2-3%; FY2025-1H FY2026 EPS range intact |
| Medium risk: Prolonged mortgage weakness | 11-20% application decline persists through Q4 2026 and into FY2027 | Housing loan growth slows; potential margin concessions reduce EPS over 12-18 months | Application decline is real but loan book still growing +2% |
| Medium risk: Credit quality deterioration | Impairment charges rise materially above 10 bps; arrears increase | Provisions flow directly through income statement, hitting earnings faster than volume trends alone | No material deterioration in Q3; provisions increase reflects modelling, not realised stress |
| Structural risk: APRA capital action | Regulator tightens capital rules for mortgage-heavy banks | Forced earnings retention above current CET1 of 12.1%, constraining distributions even if profits hold | No indication of imminent rule changes in Q3 materials |
The conditions that would make dividend risk acute, sustained application declines plus rising impairments, have not yet appeared together in the data. That is the precise answer to the question this analysis is addressing. The risk is real but conditional, and the conditions are not yet met.
What income investors should actually be watching in Q4 and beyond
The preceding analysis points to four specific metrics that will move first if the dividend picture is deteriorating. Ordered by how quickly each reflects changing conditions:
- Mortgage volumes and housing credit demand: The earliest-moving indicator. Track monthly application trends and housing credit growth in Q4 disclosures. A further leg down below 26,000 monthly applications would signal the weakness is deepening, not stabilising.
- Net interest margin trends: NIM compression below 1.89% would indicate pricing pressure on the core lending business. Watch for margin concessions as banks compete for a shrinking pool of borrowers.
- Credit impairment charges and arrears data: A step-change above the current 10 basis points would signal actual borrower stress, not modelled scenarios. This hits earnings directly and quickly.
- CET1 ratio relative to APRA expectations: A further decline below 12.1% would narrow the buffer above regulatory minimums. Watch for any APRA commentary on mortgage-heavy bank capital adequacy.
Business and institutional lending growth (4% and 3% in Q3) is the partial offset to monitor for continuation or reversal. If that growth fades while mortgage volumes remain weak, the earnings diversification story weakens.
Big Four banks in Australia have a long track record of dividend stability outside systemic shocks. The monitoring activity here is about detecting the early signal of a genuine inflection, not reacting to share price moves. Investors who know which metrics to track are better positioned than those responding to headlines.
The evidence base for a hold decision in August 2026
The supportive factors are specific and current:
- Q3 profit of A$1.8 billion, up 2-3% on prior averages
- NIM stable at 1.89% with continuing loan and deposit growth
- Payout ratio of approximately 75%, consistent across FY2025 and 1H FY2026
- CET1 at 12.1%, well above regulatory minimums
- Business and institutional lending providing partial offset to housing softness
The genuine risks are equally specific:
- Mortgage applications down 20% since the May 2026 budget, with investor applications down 26%
- Three RBA rate rises in 2026 increasing debt-servicing pressure across the mortgage book
- Potential for credit quality weakness if housing conditions soften further
- Margin pressure possible as competition intensifies for a smaller borrower pool
The evidence as it stands in August 2026 supports a dividend that is funded by real earnings growth and protected by adequate capital. “Reasonably safe today with medium-term risks to monitor” is a more precise and actionable conclusion than either “safe” or “at risk” alone. The dividend yield of 4.26% reflects a market that has incorporated uncertainty without pricing in a cut.
For investors wanting to stress-test the earnings assumptions underlying Westpac’s payout ratio before acting on the hold conclusion, our dedicated guide to valuing bank shares covers the qualitative checklist, including loan growth mix, credit loss provision trends, and funding composition, that determines whether any bank’s reported earnings are genuinely repeatable.
This article is for informational purposes only and should not be considered financial advice. Investors should conduct their own research and consult with financial professionals before making investment decisions. Past performance does not guarantee future results. Financial projections are subject to market conditions and various risk factors.