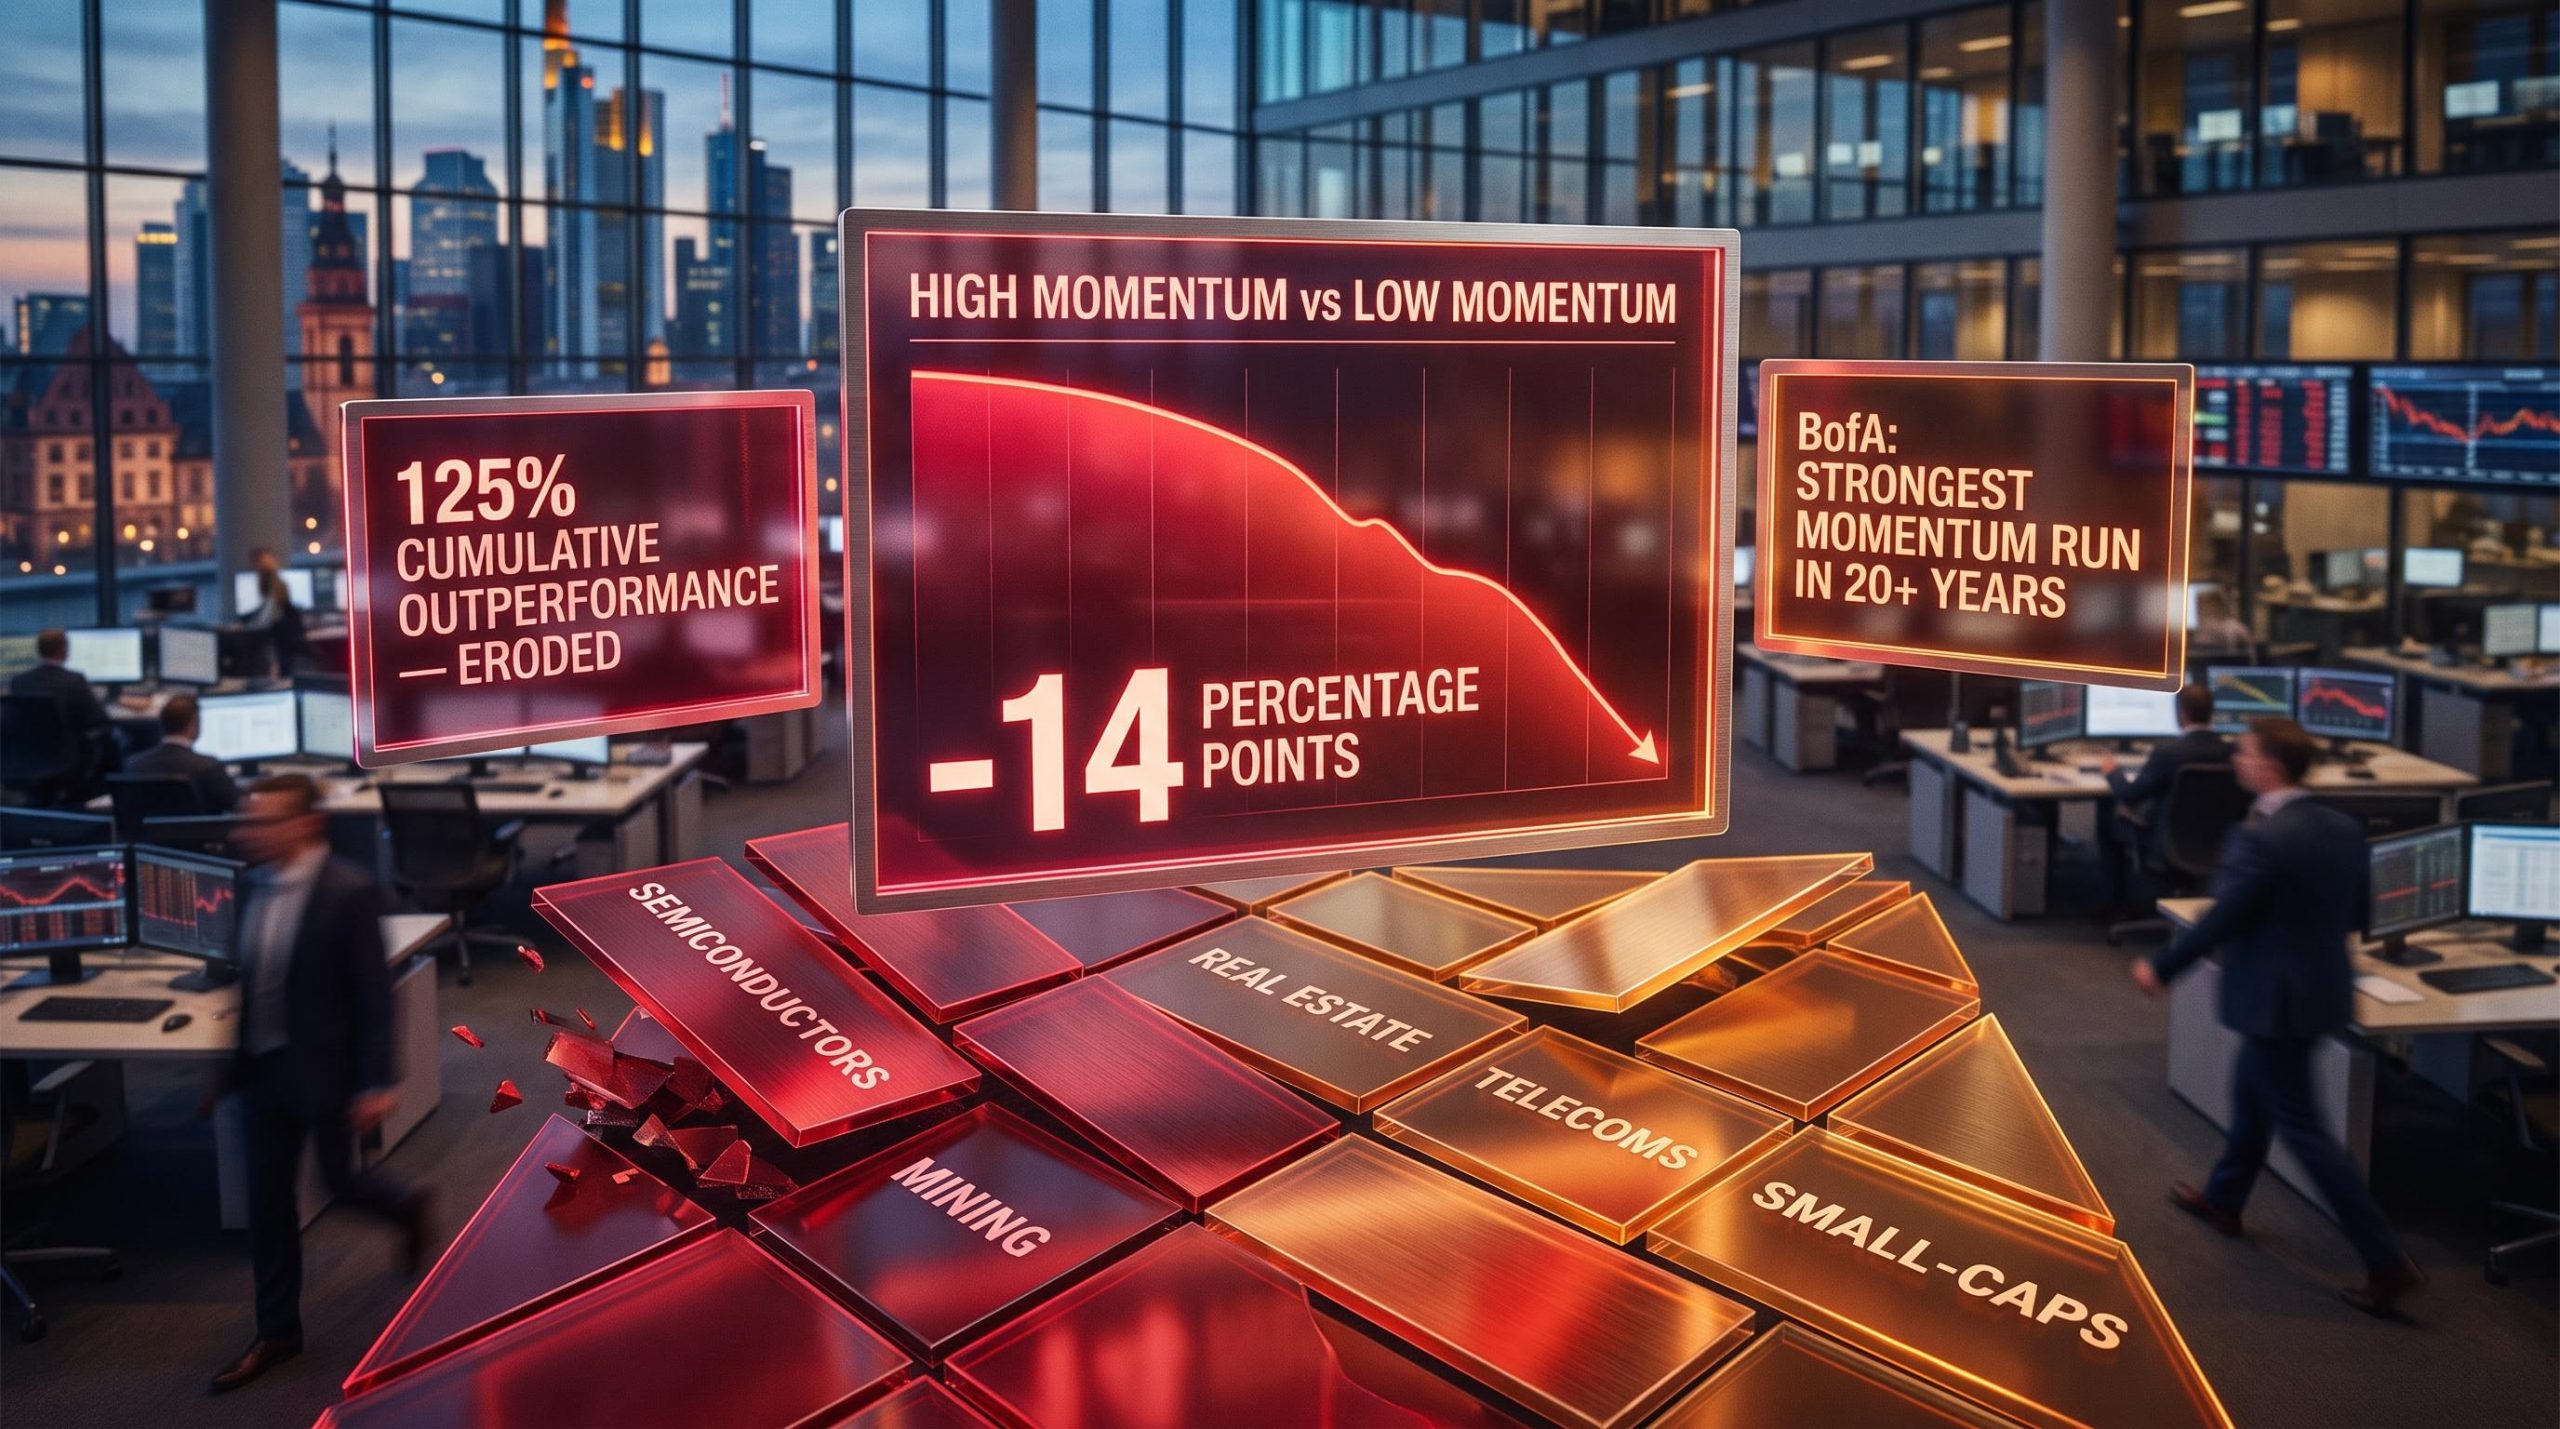
Since mid-June 2026, European high-momentum stocks have given back ground at a striking pace, logging a 14-percentage-point shortfall against their low-momentum peers in under two months, according to BofA Global Research. That reversal has eroded part of the 125% cumulative lead these names had accumulated over laggards from early 2023 through to June 2026.
The swing is not a routine sector wobble. It is the unwinding of what BofA described as the most powerful momentum-driven rally seen in more than twenty years, a trade whose gains were concentrated almost entirely in AI-linked and cyclically exposed sectors. Two forces are now working in tandem to pull it apart: growing doubts about whether AI capital expenditure will deliver adequate returns, and a macro recovery across Europe that is redirecting capital toward the cheapest, most neglected corners of the market. Neither force alone would be sufficient. Together, they have created the conditions for a structural rotation.
What follows maps the mechanics of how a momentum reversal unfolds in real time, which sectors are absorbing the rotated capital, and what the data says about whether this is a temporary correction or a more durable shift in leadership. Treat this as a live case study for assessing your own positioning, not an abstract exercise.
How three years of momentum built a crowded trade
The escalation was steady, then it accelerated. The momentum factor, a strategy that buys recent winners and avoids recent losers, outperformed by approximately 20% in 2024, roughly 30% in 2025, and an annualised 40% in early 2026. Each year surpassed the last.
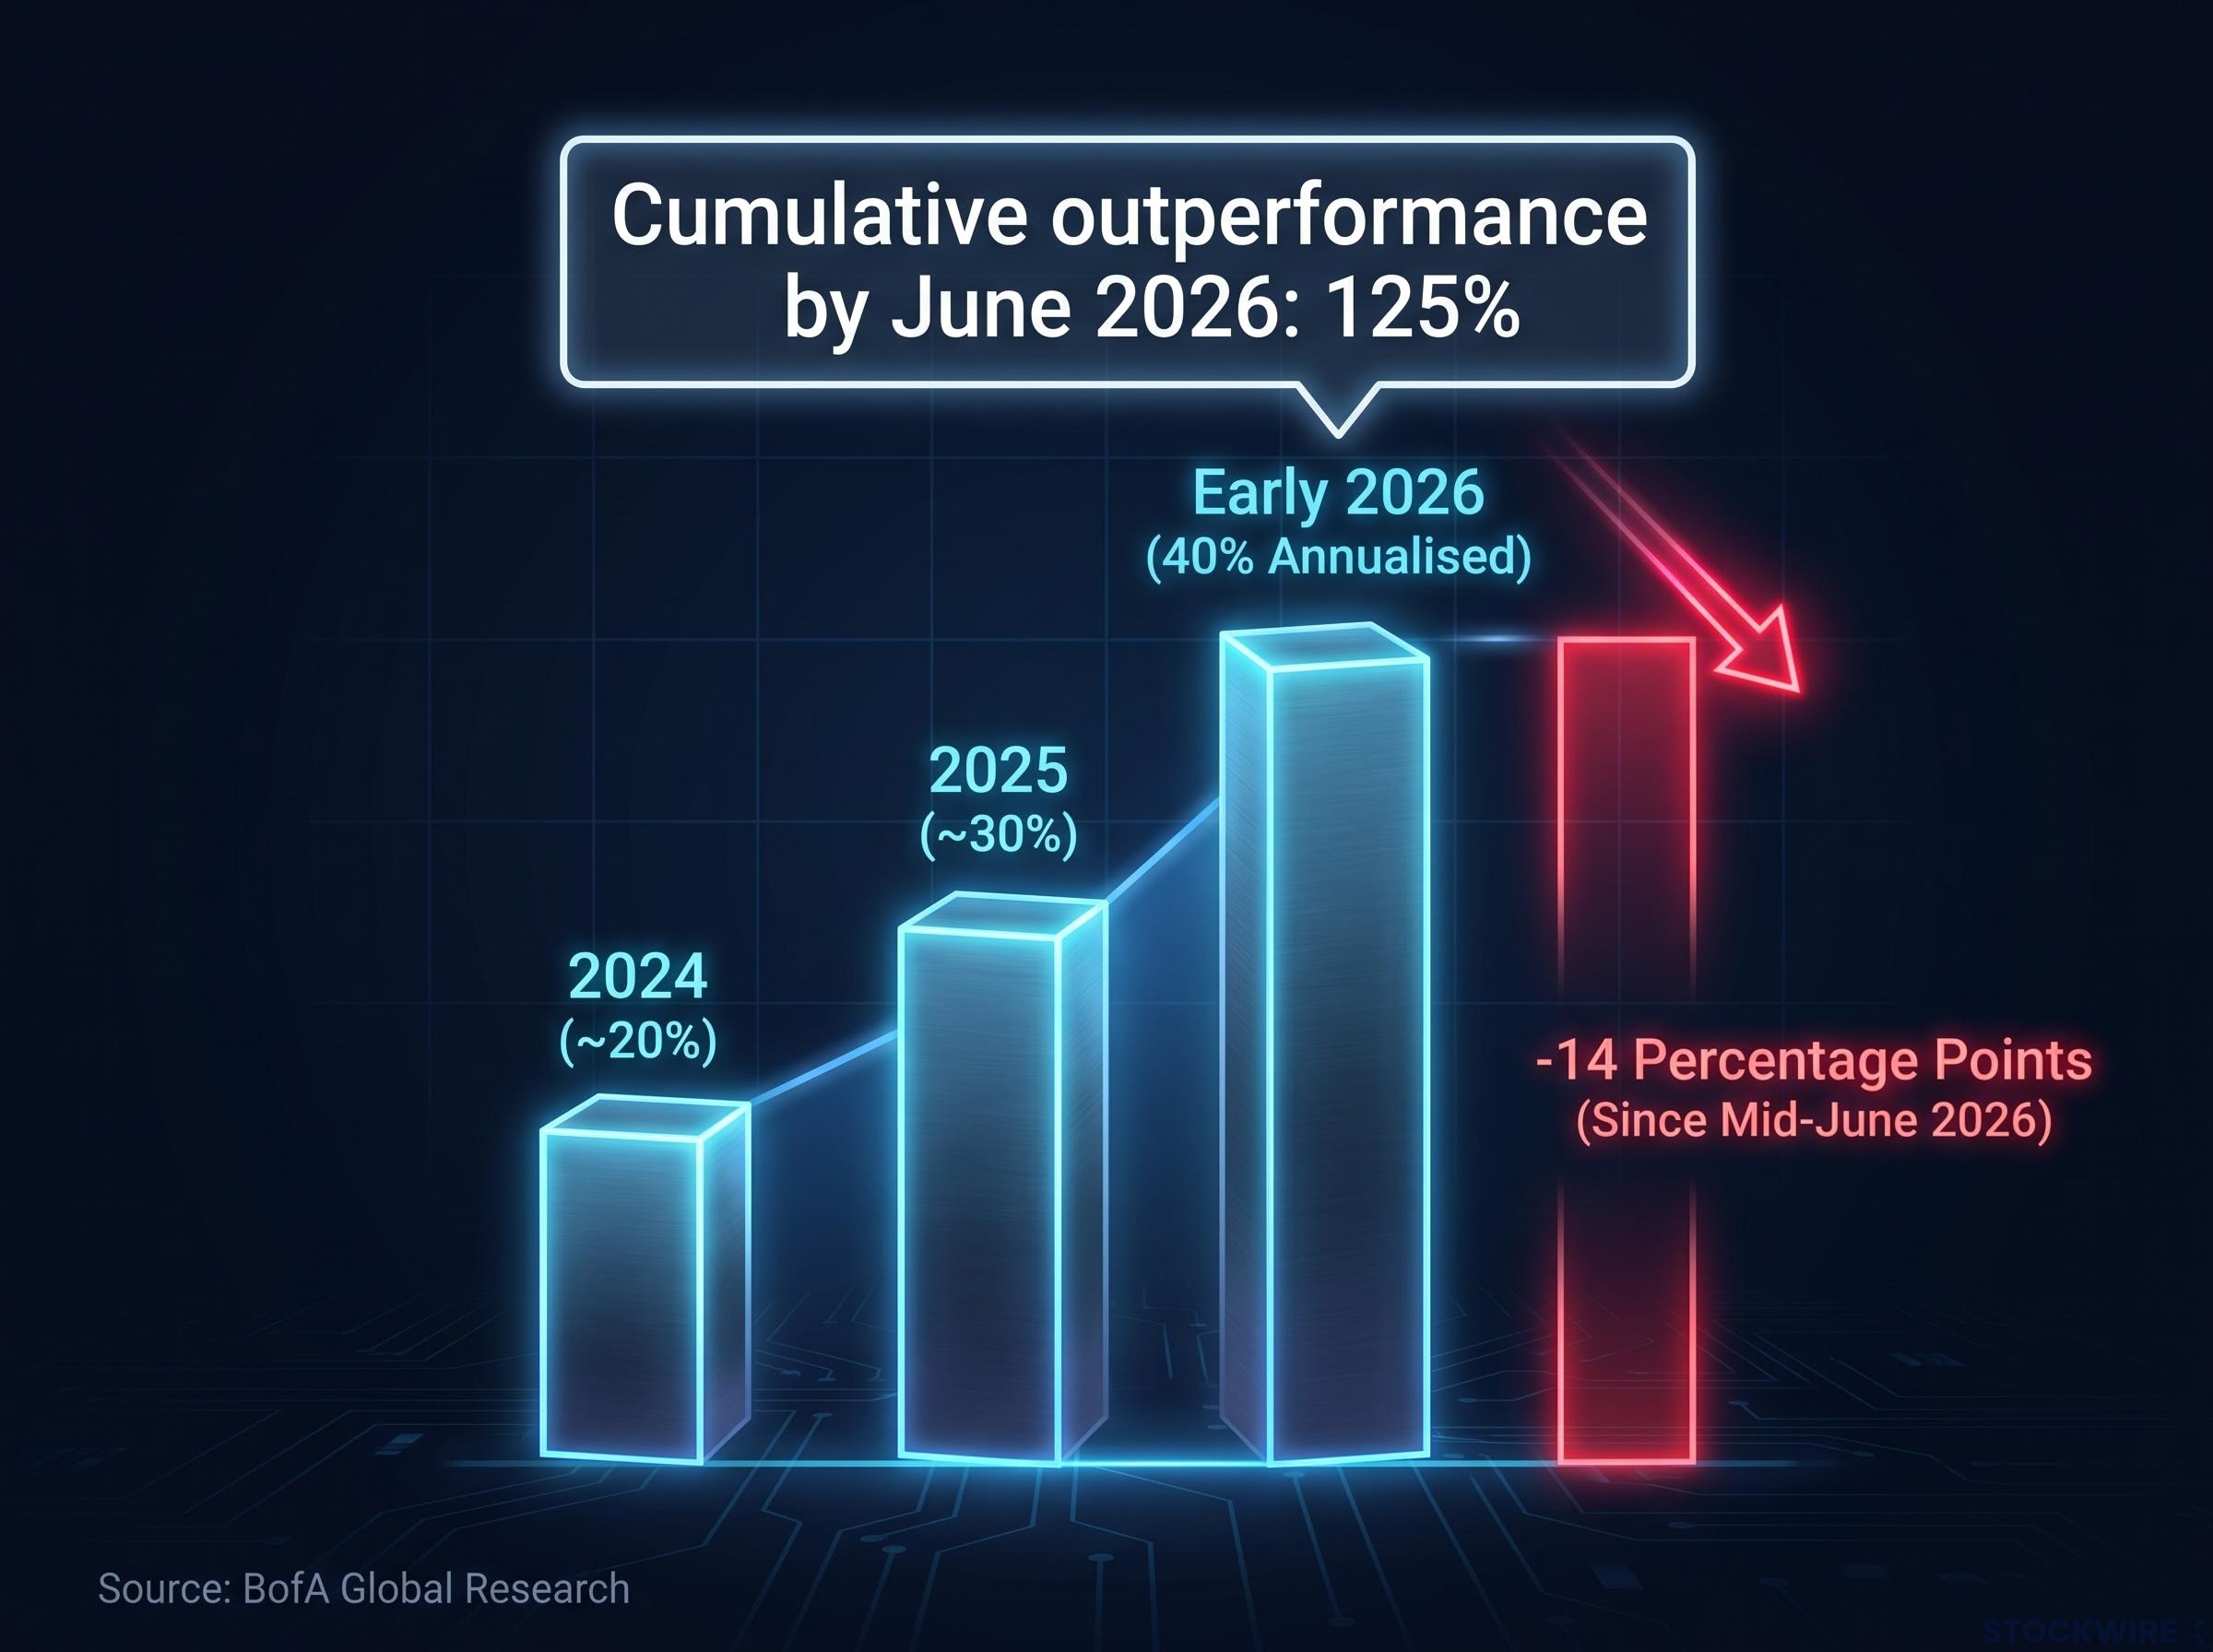
By June 2026, the cumulative gap between high-momentum and low-momentum European names had reached 125%. That is not just a performance number; it is a positioning imbalance. When the same trade works for three consecutive years and keeps accelerating, capital concentrates. Funds overweight the winners, risk models increase allocations, and fewer participants sit on the other side of the trade. The very success of the strategy plants the seed of its eventual reversal.
Goldman Sachs flagged crowded momentum positioning in May 2026 as one of only 11 comparable episodes since 1980, each of which reversed within roughly one month of peaking; with hedge fund gross leverage and net momentum exposure near five-year highs at the time, the subsequent unwind carried amplification beyond what fundamentals alone would have produced.
BofA Global Research characterised this as the strongest momentum-driven rally in over two decades.
The rally was powered by a narrow cluster of sectors at the core of the AI and commodity investment cycle:
- Semiconductors
- Capital goods
- Miners
Accelerating factor performance of this kind historically signals the crowding that eventually collapses under its own weight. That context is what makes the reversal that followed intelligible rather than surprising.
When big ASX news breaks, our subscribers know first
What momentum reversals actually are, and why they hit so hard
A momentum reversal is the simultaneous unwind of crowded long positions in winners and the re-entry of capital into neglected laggards, often compressed into a narrow window. It is not just a bad week for popular stocks. It is a mechanical process where the selling itself generates more selling, and the buying of forgotten names accelerates as capital needs somewhere to go.
The core number: high-momentum European stocks have underperformed low-momentum stocks by roughly 14 percentage points since mid-June 2026, according to BofA Global Research.
The partial recovery of approximately 5% from the worst underperformance point is worth understanding properly. It does not signal that the reversal is finished. Factor reversals include phases of counter-trend stabilisation that can mislead directional assessment. Treating a short-term recovery as evidence that momentum leadership has returned would be premature.
Why the reversal feeds on itself
The feedback loop is what makes reversals so violent. When a heavily owned factor starts losing, institutional risk managers across multiple funds reduce exposure at the same time. That coordinated selling compresses the sell-off window, pushing prices lower, which triggers further risk-management reductions.
The more successful and concentrated the prior trade, the more severe the initial unwind, because there are fewer natural buyers on the other side. A 125% cumulative outperformance over three-plus years means the pool of capital willing to catch the falling trade is thin. The ferocity of the reversal is a feature of the trade’s prior success, not a separate shock applied from outside.
The momentum factor unwind that hit US high-beta equities in early June 2026, erasing roughly 9.5%-10% in a single session, preceded the European rotation by days and illustrates how factor-specific collapses can detach entirely from broad index performance, with the S&P 500 remaining firmly positive throughout.
AI capex doubts as the catalyst that lit the fuse
AI capital-expenditure expectations were the central pillar of Europe’s momentum trade. The most heavily owned names, particularly in semiconductors and capital goods, were priced on the assumption that AI-related spending would translate into sustained, high-return cash flows. When that assumption wobbled, the most crowded positions absorbed the sharpest impact.
In a July 2026 update, BofA warned that AI models increasingly risk becoming commoditised, which could call into question the return-on-capital assumptions underpinning the most expensive names in the trade. This is not a collapse in the long-term AI thesis. It is a downgrade of near-term earnings visibility, a repricing from a certain AI future to an uncertain one. Uncertain futures carry higher risk premia, and higher risk premia compress valuations on the names most exposed to the build-out.
The commoditisation warning matters not because it signals the end of AI, but because it tells you the market has shifted from pricing certainty to pricing probability, and probability-weighted valuations are structurally lower.
AI capex concentration risk extends beyond European semiconductors: the four largest US hyperscalers are collectively guiding toward combined capital expenditure well above $600 billion annually, a scale of commitment that has pushed AI-related technology spending as a share of GDP past the late-1990s dot-com peak, a threshold Goldman Sachs identified as historically significant for capital cycle analysis.
| Sector | Relative performance since June 2026 | Prior role in momentum trade |
|---|---|---|
| Semiconductors | −20% | Core AI-exposed, most heavily owned |
| Mining | −15% | Commodity-cycle beneficiary, AI infrastructure demand |
| Construction | −10% | Infrastructure-spending narrative beneficiary |
Where the rotated capital is landing, and why those sectors specifically
The five sectors now outperforming share a common logic: each was punished during the prior regime for the same macro conditions that are now reversing. Their recovery is a coordinated response to changing fundamentals, not a coincidence of sector-specific catalysts.
The eurozone’s composite PMI has advanced by more than four points since April 2026, reaching 52 and returning to expansion territory. Separately, Q2 2026 GDP growth came in at an annualised rate of 1.8%.
That macro improvement, combined with a partial stabilisation of the energy disruption stemming from the Iran war, has reduced the headwinds that initially pressured rate-sensitive and domestically exposed sectors. Capital rotating out of crowded momentum trades now has macro justification to move into the names it previously avoided.
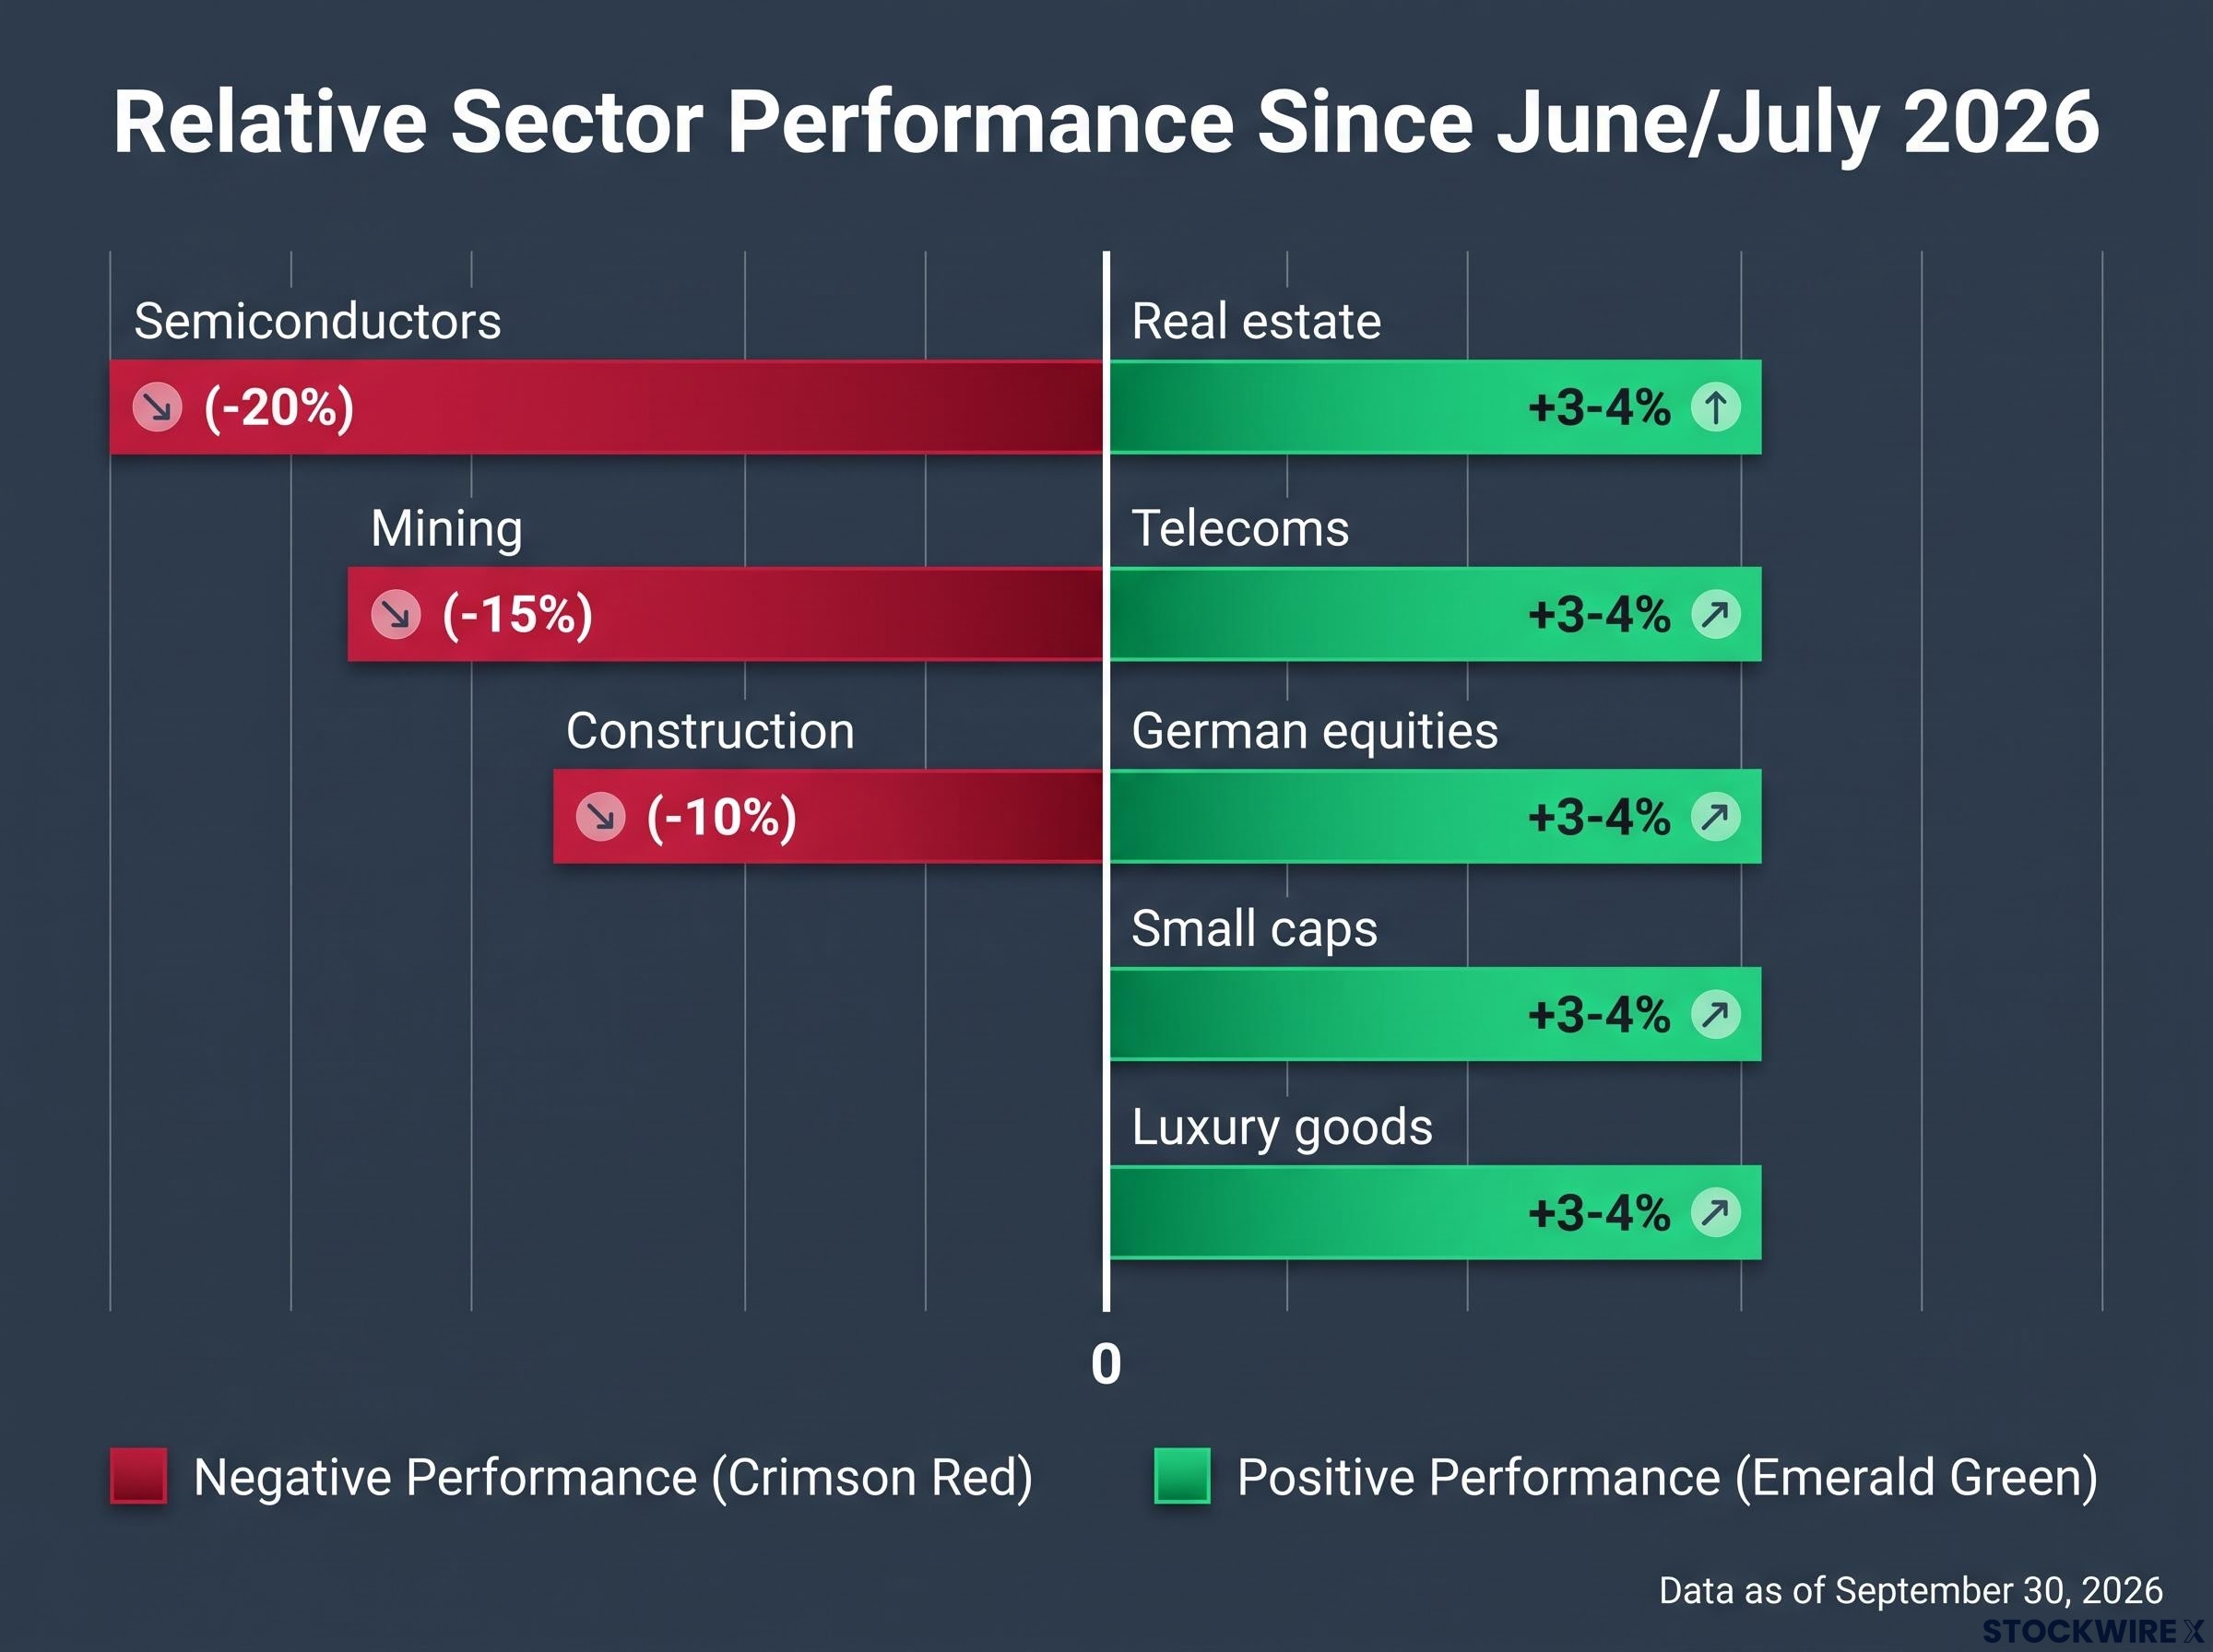
| Sector | Relative outperformance since June/July 2026 | Prior cycle drawdown | Primary recovery driver |
|---|---|---|---|
| Real estate | +3-4% | 20-50% | Stabilising rates, improved growth outlook |
| Telecoms | +3-4% | 20-50% | Compressed valuations, yield appeal |
| German equities | +3-4% | 20-50% | Industrial recovery, energy repricing |
| Small caps | +3-4% | 20-50% | Domestic growth stabilisation, valuation discount |
| Luxury goods | +3-4% | 20-50% | De-rating reversal (Chinese demand remains a live risk) |
The 3-4% relative gains across five different sectors, all coming off drawdowns of 20-50%, tell you this is a coordinated rotation driven by a change in macro expectations. The logic will persist as long as growth and rate conditions continue to stabilise. One important caveat: luxury goods carry a distinct risk variable. Their recovery depends partly on Chinese consumer demand data, which remains a live uncertainty separate from the European macro story. That makes luxury the sector in this group where idiosyncratic risk is highest.
Is this a temporary rotation or a lasting regime change?
Both sides of this argument have genuine weight, and forcing a premature conclusion would be less useful than understanding what each camp rests on.
The case for durability:
- The prior imbalance, 125% cumulative outperformance and the strongest momentum run in over two decades, historically takes sustained time to fully unwind
- European macro conditions (PMI at 52, GDP at 1.8% annualised) now structurally support the beneficiary sectors, not just a one-off rebound
- AI capex uncertainty is unlikely to resolve in a single earnings season, keeping risk premia elevated on the most expensive names
- The 5% partial recovery from worst underperformance is consistent with factor reversal patterns, phases of stabilisation, not a signal that the unwind is complete
The case for momentum’s partial re-assertion:
- The long-term structural case for technology and semiconductors remains intact
- Clear evidence that AI investments are generating sustained cash flows could revive momentum leadership in selected names
- A full reversal of leadership is less likely than a transition to broader sector participation
The most realistic near-term scenario is a more balanced European market, not a wholesale leadership swap. For anyone holding concentrated momentum exposure, that still means the portfolio composition that worked for three years may now carry structural misalignment.
The most important signal to watch is not short-term sector performance but AI earnings guidance from major users and suppliers. Clear monetisation evidence would meaningfully shift the balance of this argument. The absence of that evidence is itself a data point, sustaining higher risk premia on expensive AI-exposed names until it arrives.
What the rotation changes, and what it does not
The European momentum reversal is the product of a specific confluence: over-concentration, AI repricing, and macro recovery working together. Understanding that confluence tells you which variables actually matter going forward, rather than leaving you reacting to each week’s sector performance in isolation.
Three monitoring anchors, in order of priority:
- AI capex guidance from major users and suppliers. This is the gating factor for any momentum recovery. Positive earnings surprises with clear monetisation evidence would stabilise or partially revive leadership in selected AI-exposed names. Continued ambiguity extends the unwind.
- European PMI and GDP trajectory. The sustainability of the laggard rotation depends on whether the growth recovery holds. A composite PMI above 52 and GDP growth sustaining near 1.8% annualised would reinforce capital flows into real estate, telecoms, small caps, and German equities.
- ECB policy communication and energy price signals. These are the macro plumbing beneath both sides of the rotation. Rate expectations and energy costs affect the beneficiary sectors’ earnings directly and the momentum sectors’ discount rates indirectly.
The practical implication: the cleaner opportunity in this rotation is not chasing sectors already up 3-4%. It is using the window for diagnostic work inside your portfolio, identifying where crowding risk remains elevated, favouring quality balance sheets and pricing power within recovery sectors rather than buying undifferentiated sector beta.
For investors ready to act on the crowding-risk diagnostic the article recommends, our dedicated guide to beta-weighted position sizing walks through a six-step rebalancing workflow that converts holdings into market-risk equivalent dollars, making hidden risk imbalances visible before the next factor reversal arrives.
This article is for informational purposes only and should not be considered financial advice. Investors should conduct their own research and consult with financial professionals before making investment decisions. Past performance does not guarantee future results. Financial projections are subject to market conditions and various risk factors.