Berkshire Hathaway reported net profit of $25.67 billion for the second quarter of 2026, nearly doubling the year-ago figure. That headline number, though, is not the one that should shape how you think about what just happened inside the company.
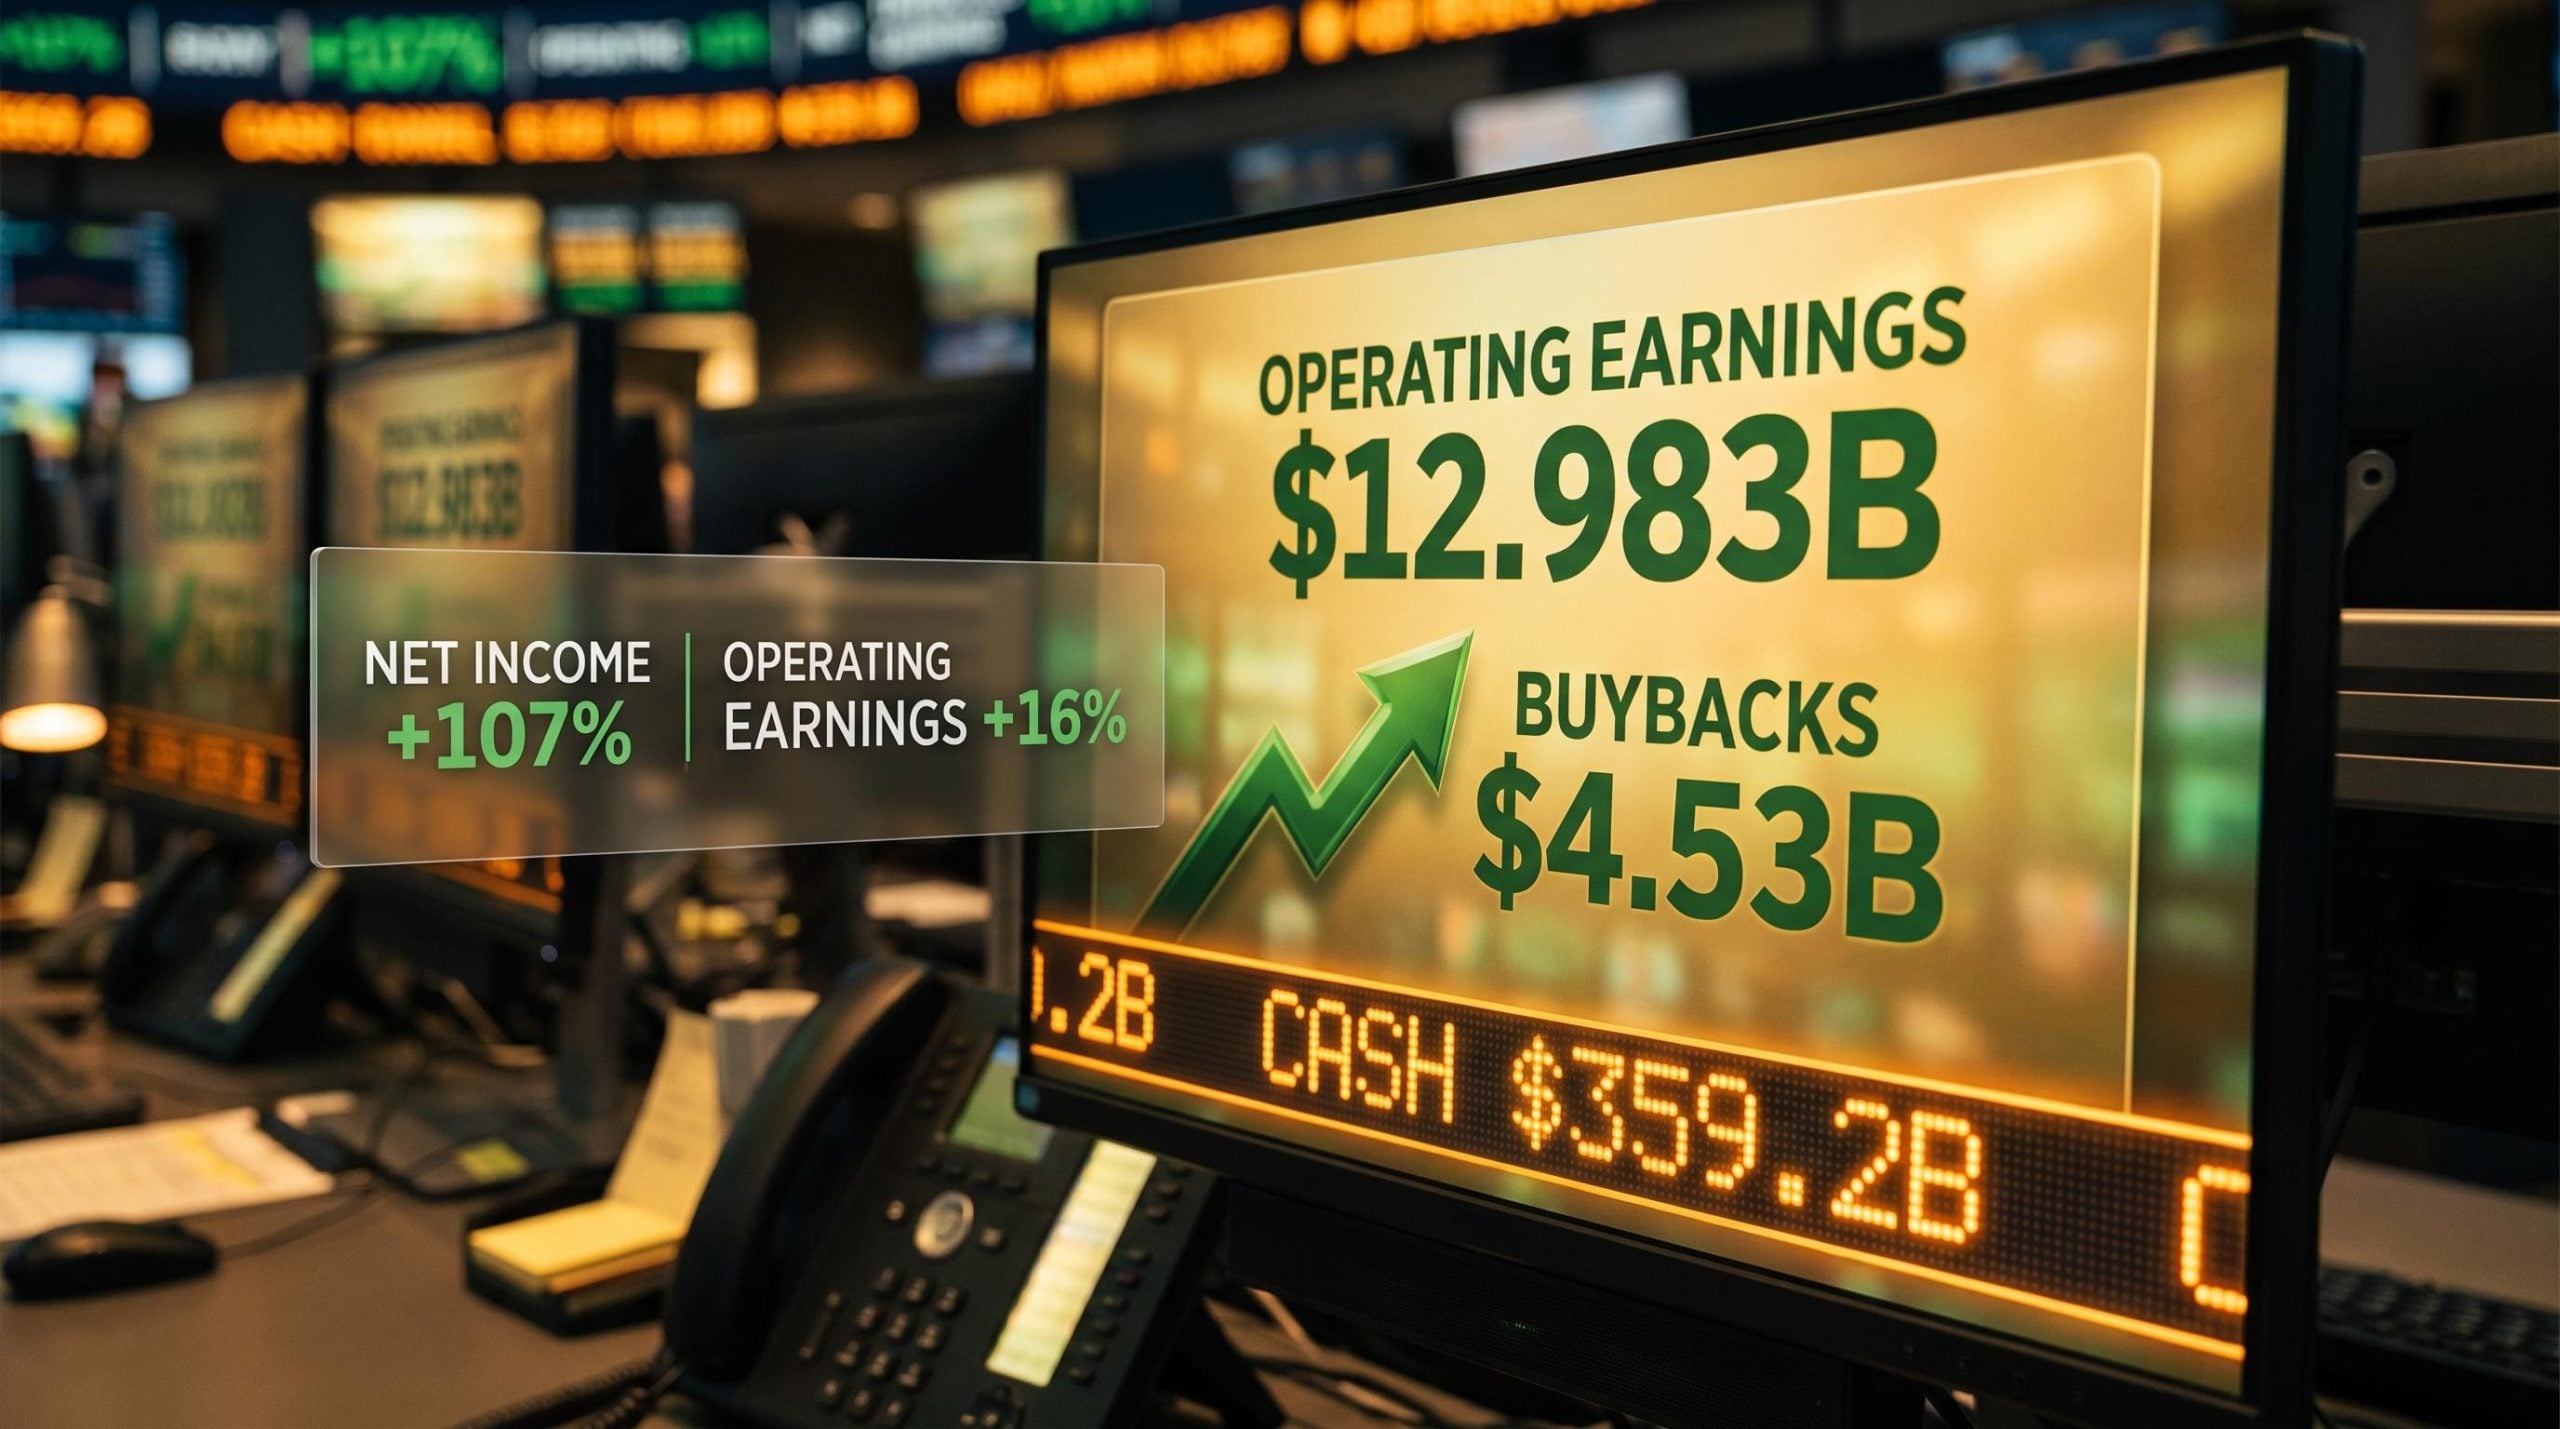
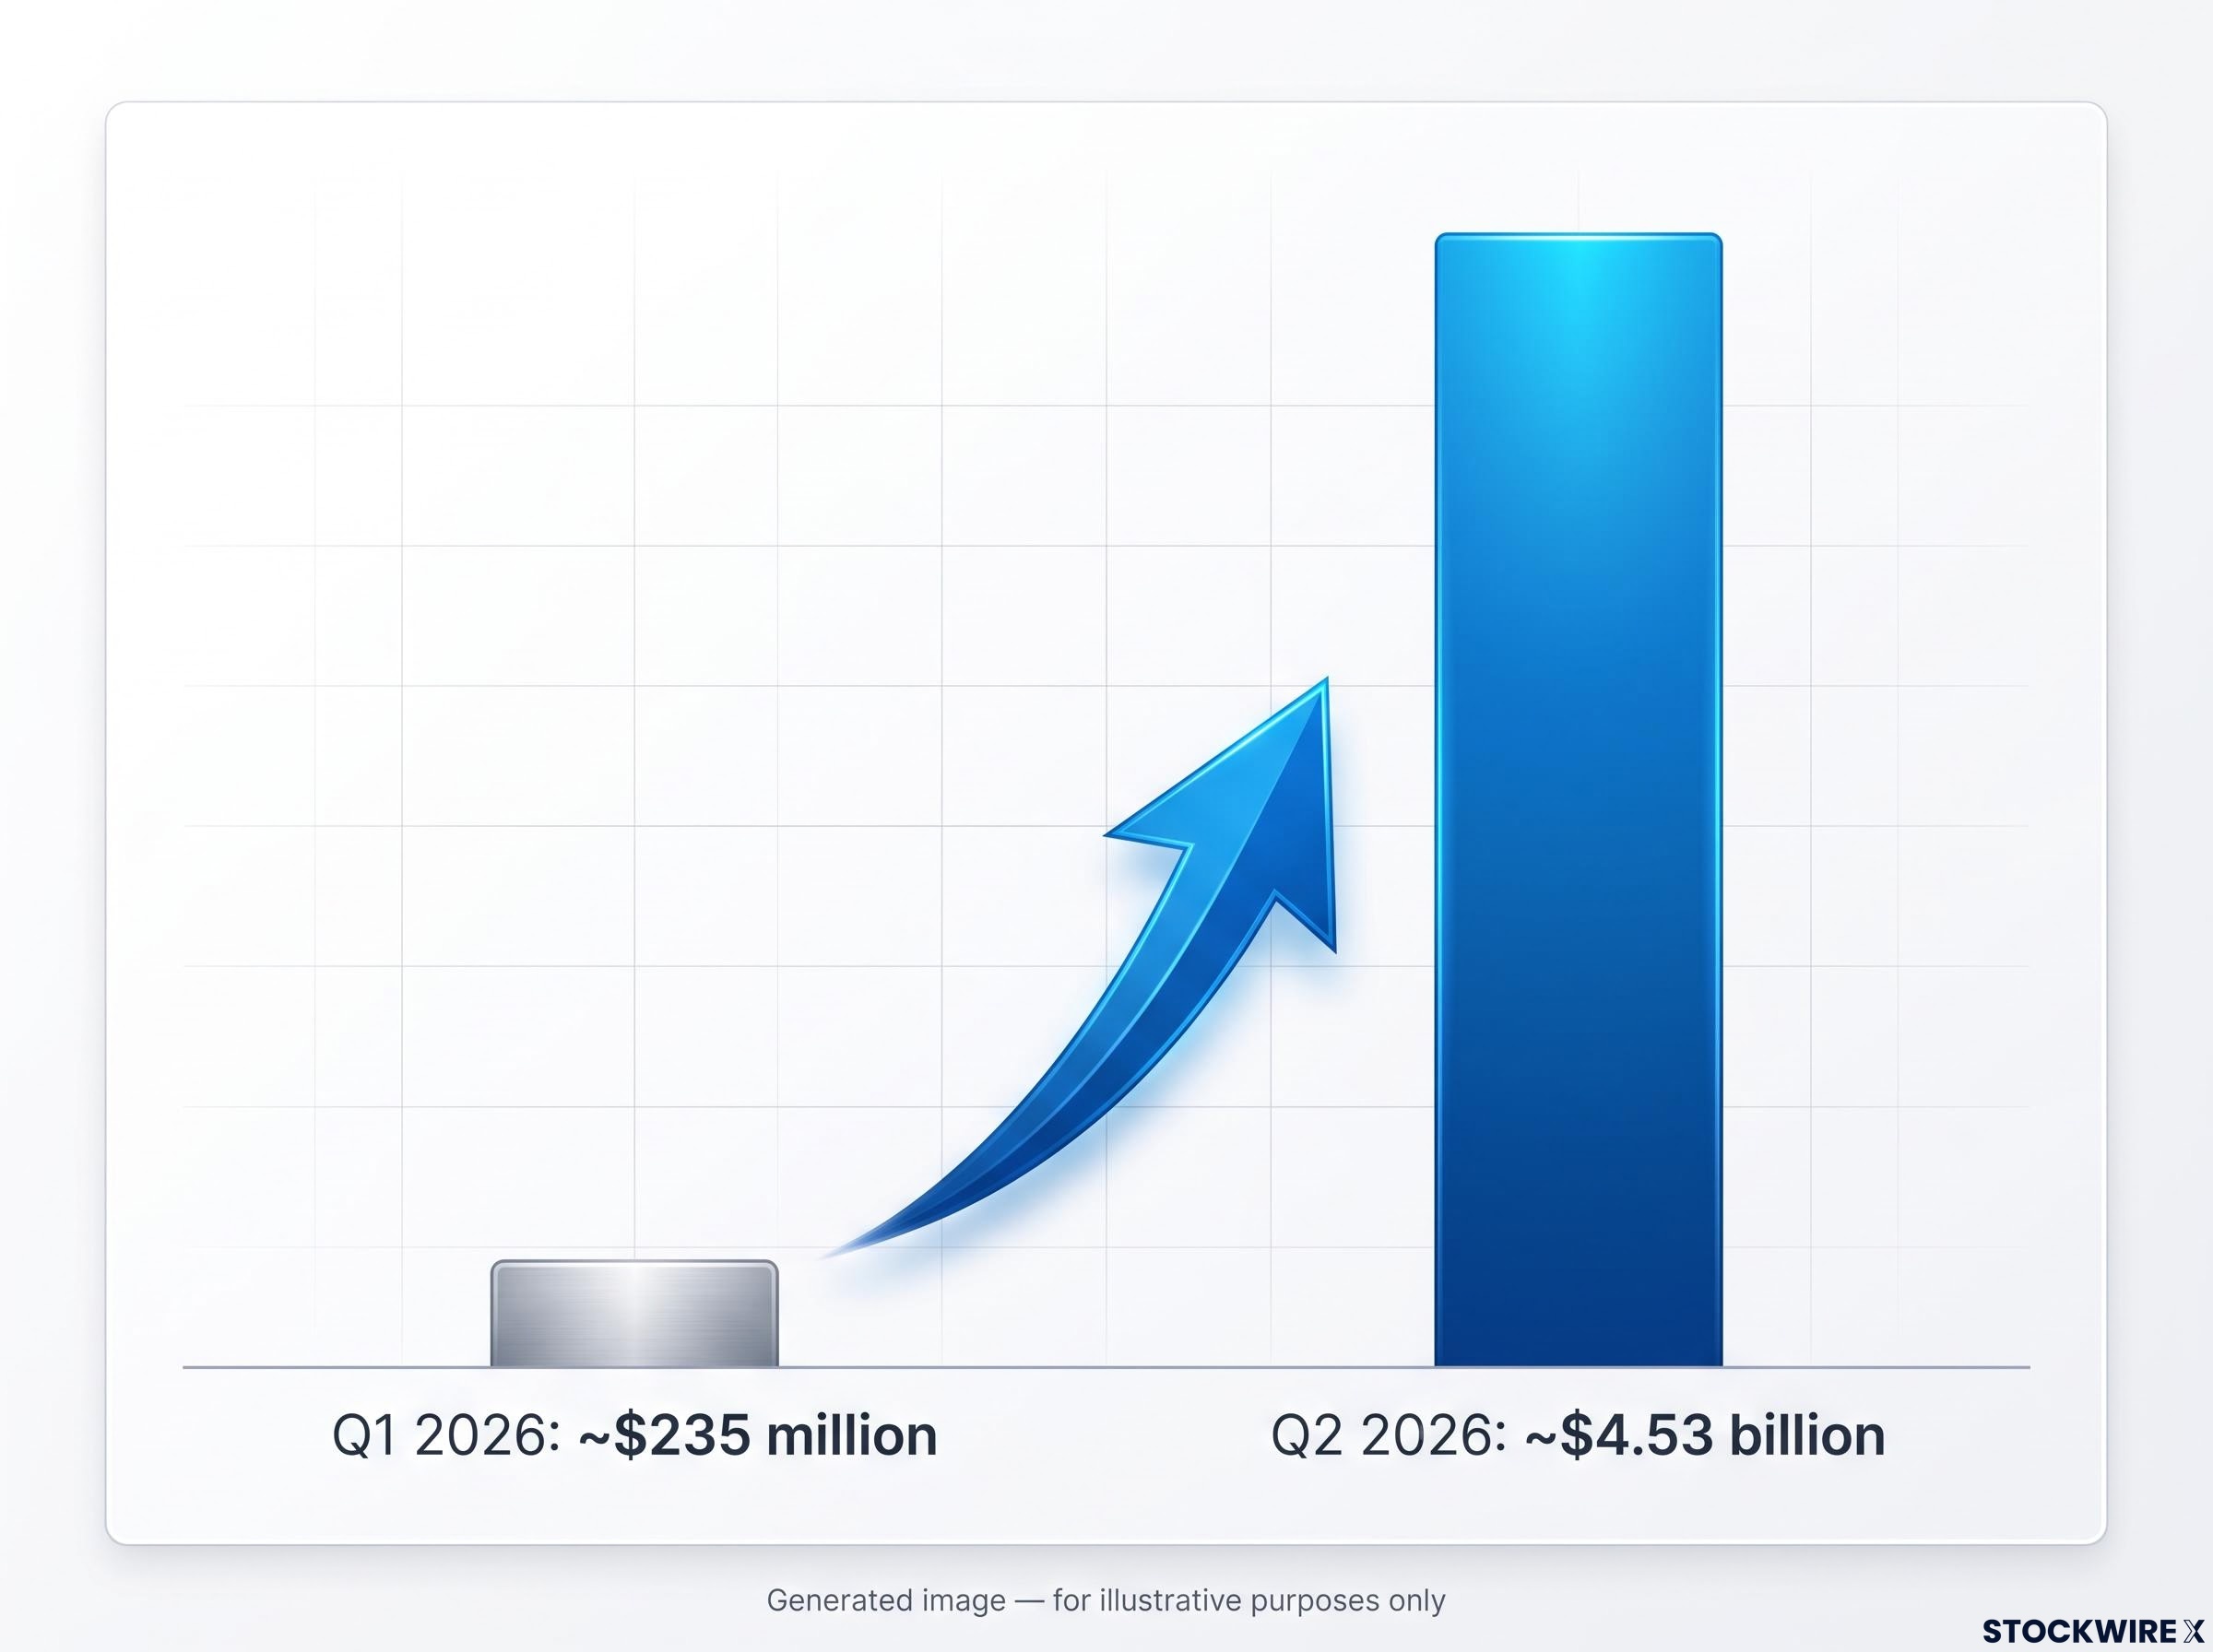
This is the first quarter where Greg Abel’s capital allocation decisions are visible at genuine scale. Buybacks jumped from $235 million in Q1 to $4.53 billion in Q2. Berkshire became a net buyer of equities for the first time in 11 quarters. A $9.7 billion acquisition closed, a $6.8 billion deal is pending, and the company still finished June sitting on $359.2 billion in cash and Treasuries. Together, those moves tell a very different story from the profit headline alone.
Here is what the underlying numbers actually signal about Berkshire’s direction under Abel, and what it means if you own the stock or are weighing a position.
Why the $25.67 billion profit figure misleads more than it reveals
Q2 net earnings came in at $25.67 billion, more than double the $12.37 billion recorded in the same period last year, representing a gain of roughly 107%. On a per-share basis, Class A equivalent earnings reached $17,868, against $8,601 in Q2 2025.
The jump looks extraordinary until you see what drove it. After-tax investment gains totalled $12.684 billion, up from $4.970 billion in the prior year. The majority of those gains are unrealised, meaning they reflect mark-to-market increases on stocks Berkshire still holds, not cash profits from sales. Under ASC 321 accounting rules (the standard that requires companies to run changes in their equity portfolio’s market value through the income statement each quarter), these paper gains inflate net earnings in rising markets and deflate them in falling ones.
The cleaner metric is operating earnings, which strips out investment gains and losses to show how Berkshire’s actual businesses performed. That figure rose from $11.160 billion to $12.983 billion, a gain of approximately 16% year-over-year.
The same dynamic that distorts Berkshire’s headline number appears across hundreds of S&P 500 companies each quarter, where GAAP vs non-GAAP earnings can diverge by 25-50% and headline figures regularly flatter underlying performance in ways the income statement does not flag.
$12.983 billion in Q2 2026 operating earnings, up 16% year-over-year: the number Berkshire’s own management treats as the signal.
The near-doubling of net income tells you Berkshire’s equity portfolio had a strong quarter in mark-to-market terms, not that the underlying businesses performed twice as well. Using net income as a yardstick here leads to systematically wrong conclusions about earnings trajectory and valuation. The two metrics, side by side, make the distinction clear:
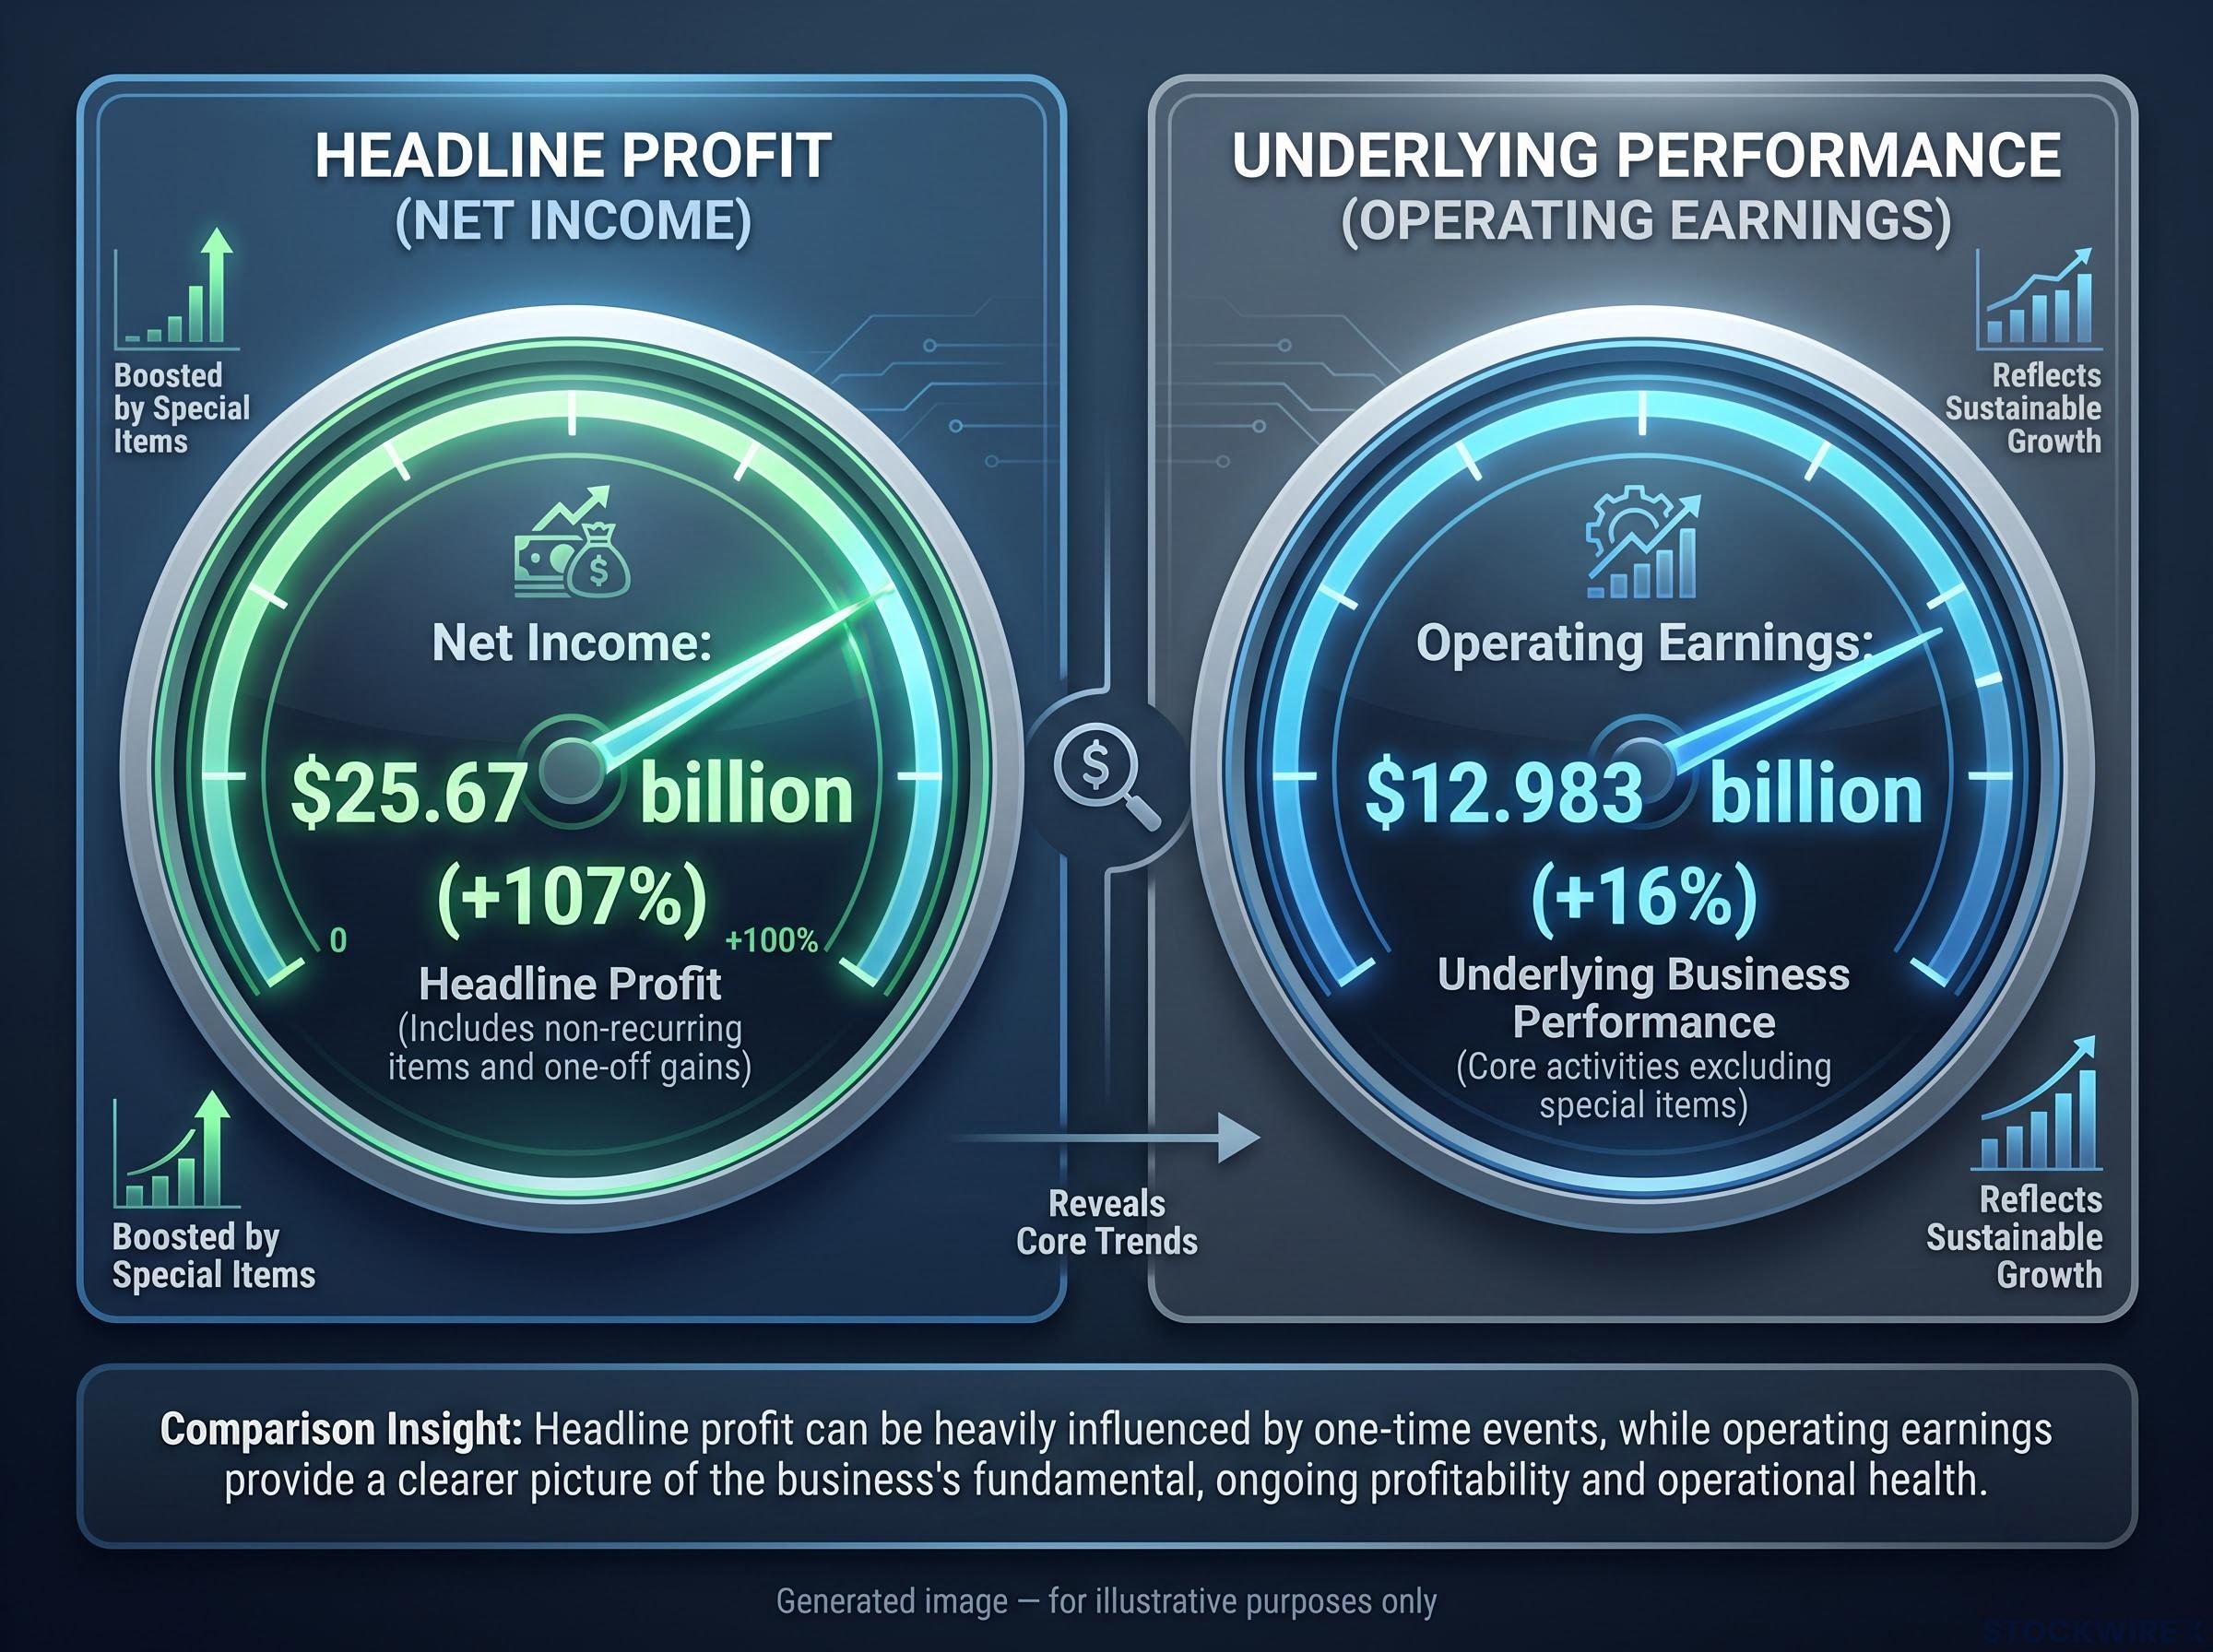
- Net income: $25.67 billion, +107% year-over-year (driven by unrealised investment gains)
- Operating earnings: $12.983 billion, +16% year-over-year (driven by actual business performance)
When big ASX news breaks, our subscribers know first
The businesses behind the numbers: where Berkshire’s real growth came from
The 16% operating earnings improvement was not carried by a single division. Three of Berkshire’s four major non-insurance segments posted meaningful growth, and the breadth of that improvement is what makes the figure more convincing than it would be if one unit were doing the heavy lifting.
| Segment | Q2 2026 Result | Year-over-Year Change |
|---|---|---|
| Manufacturing, service and retailing | $4.47 billion | +24% |
| Berkshire Hathaway Energy | $891 million | +27% |
| BNSF railroad | $1.56 billion | +6% |
| Insurance | Weaker results | Softer, offset by strength elsewhere |
Energy led the percentage gain, manufacturing and retail delivered the largest absolute contribution, and BNSF added a steady, if unspectacular, improvement. Insurance was the one soft spot, but the strength across the other three segments more than compensated.
Shareholders’ equity rose $30.5 billion since year-end 2025, reaching $747.9 billion at 30 June 2026. Growth from multiple directions reduces the risk that one bad quarter in any single business reverses the trajectory.
What $359 billion in cash actually means for Greg Abel
At 30 June 2026, Berkshire’s cash and Treasury holdings stood at $359.2 billion, per official filings. A broader measure reported by CNBC puts the figure at $365.5 billion, down from a peak of $397.4 billion three months earlier. The gap reflects differences in what is counted (pure cash and T-bills versus a wider near-cash definition), not a discrepancy in Berkshire’s actual position.
Berkshire’s cash and market valuation have been read as a macro signal since the reserve began climbing: the Buffett Indicator stood at approximately 223-230% across late 2025 and early 2026, providing the broader market context within which Abel’s Q2 deployment decision was made.
$359.2 billion in cash and Treasuries: approximately 12 times the minimum Berkshire requires to remain eligible to repurchase its own shares.
The scale becomes meaningful when you measure it against Berkshire’s own repurchase eligibility floor. Berkshire’s buyback rules set a cash threshold of $30 billion as the minimum level that must be maintained for repurchases to be permissible. The current position sits roughly 12 times above that threshold, which means Abel has extraordinary room to manoeuvre across three strategic functions:
- Acquisition option value: capacity to fund a large deal quickly, without external financing, if the right opportunity surfaces
- Resilience: the ability to absorb almost any macro shock or insurance catastrophe loss without operational strain
- Buyback flexibility: room to sustain or accelerate share repurchases without jeopardising operating liquidity
Most companies face a genuine trade-off between returning capital and maintaining flexibility. Berkshire at $359 billion has effectively suspended that trade-off for the foreseeable future, and that changes the downside risk profile of a position in ways headline earnings numbers do not capture.
The buyback signal: what Abel’s $4.53 billion quarter tells investors about valuation
The buyback numbers between quarters tell the story more clearly than any commentary could.
| Quarter | Repurchase Amount |
|---|---|
| Q1 2026 | ~$235 million |
| Q2 2026 | ~$4.53 billion |
The roughly 20-fold surge from one quarter to the next brought the combined first-half repurchase total to approximately $4.76-4.8 billion, with the overwhelming majority of that spending occurring in Q2 alone.
Berkshire’s repurchase policy permits buybacks only when the board judges that shares are priced below a conservatively assessed estimate of intrinsic value (the company’s own view of what each share is fundamentally worth) and when the cash balance does not fall beneath the prescribed $30 billion minimum. The Q2 volume, then, is not routine capital return. It is a statement. Abel and the board judged Berkshire shares attractive relative to intrinsic value and acted at meaningful scale, not symbolically.
Repurchases conducted below intrinsic value increase each remaining shareholder’s proportional claim on Berkshire’s earnings and assets.
For investors weighing whether to add to or hold a position, this carries a specific implication: when Berkshire itself spends $4.53 billion on its own shares after spending almost nothing the prior quarter, management is communicating a view on valuation. That is a partial anchor, not a guarantee, but it is one of the few direct signals insiders provide about what price levels they consider reasonable.
Beyond buybacks: OxyChem, Taylor Morrison, and the return to net equity buying
The buyback acceleration was only one layer of Q2 deployment. Abel was active across three channels simultaneously:
- OxyChem acquisition: approximately $9.7 billion in the chemicals sector, expanding Berkshire’s industrial footprint
- Taylor Morrison Home Corporation: equity value of approximately $6.8 billion (enterprise value approximately $8.5 billion), expected to close in H2 2026, adding homebuilding exposure
- Net equity purchases: Berkshire became a net buyer of equities in Q2, with nearly $20 billion in net stock purchases (this figure is sourced from a single report and has not been independently verified), ending an 11-quarter stretch of net selling
That last point deserves emphasis. For more than three years, Berkshire had been consistently selling more equities than it bought. The reversal signals that Abel’s team is finding opportunities in public markets they consider superior to simply accumulating more cash.
Abel’s first 13F filing, covering holdings as of 31 March 2026, had already signalled a widening investment aperture: a $2.65 billion Delta Air Lines stake and a new Macy’s position appeared alongside full exits from Visa, Mastercard, and UnitedHealth, suggesting the public equity portfolio was being reshaped before Q2’s larger deployment moves.
The simultaneity is the real story. All three deployment channels ran concurrently in H1 2026, yet Berkshire still reported $359.2 billion in cash at quarter-end. The company’s existing earnings engine is large enough to fund material deployment without drawing down reserves. That is not typical of most capital allocators, and investors who watched the cash pile grow for years as a signal of Buffett-era caution should register that Q2 represents a measurable, multi-front shift in posture.
How to read the Q2 report as a current or prospective Berkshire investor
The quarter delivered a lot of data. Here is a framework for turning it into something you can use going forward:
- Track operating earnings, not net income. The +16% year-over-year growth rate is your current benchmark for underlying business performance. Net income will swing with equity markets and tells you almost nothing about the trajectory of Berkshire’s actual businesses.
- Read buyback scale as a valuation signal. When repurchase activity jumps from $235 million to $4.53 billion in a single quarter, management is communicating a view on intrinsic value versus market price. Treat that as a partial anchor, not a price target.
- Watch Q3 deployment mix as the test of whether Q2 was a turning point. The Taylor Morrison close (expected H2 2026) and any continuation of net equity buying will be early datapoints on whether Abel’s multi-channel deployment pace is durable or was a response to specific price conditions.
The most actionable question coming out of Q2 is not whether Berkshire had a good quarter. It did. The question is whether Abel’s deployment pace in Q3 and Q4 confirms a strategic shift or reverts to the ultra-cautious posture of the prior two years.
What Q2 signals and what remains unresolved under Abel’s leadership
Four things are now confirmed about Abel’s capital allocation approach:
Abel’s capital allocation framework was largely untested at the time of his first annual meeting: acquisitions, organic growth, and disciplined repurchases were the stated priorities, but Q2 2026 is the first quarter where the scale of execution makes those commitments legible to outside observers.
- Extraordinary liquidity maintained: $359.2 billion at quarter-end, even after multi-billion-dollar deployment across three channels
- Opportunistic buybacks at meaningful scale: $4.53 billion in Q2, concentrated where management judged price-to-value attractive
- Return to net equity buying: the first quarter of net purchases in nearly three years, ending the longest selling streak in recent Berkshire history
- Mid-sized acquisitions across multiple sectors: OxyChem (~$9.7 billion) and Taylor Morrison (~$6.8 billion equity) demonstrate willingness to commit capital to operating businesses, not just public equities
What remains open is whether Abel will eventually pursue a single transformative, large-scale acquisition, or whether his model is a portfolio of smaller-to-mid-sized moves deployed systematically. Buffett’s foundational disciplines, the intrinsic value focus, adequate liquidity, and no forced deployment, appear intact based on Q2 evidence. But Abel is not Buffett’s passive caretaker. He is making his own capital decisions at meaningful scale.
Q3 2026 will begin to reveal whether Q2 was the start of a durable deployment posture or a window created by specific price conditions. For investors who have been waiting for evidence of Abel’s independent judgement, they now have it. The forward question is whether to treat that evidence as a signal to accumulate or as a datapoint that warrants watching one more quarter before acting.
This article is for informational purposes only and should not be considered financial advice. Investors should conduct their own research and consult with financial professionals before making investment decisions. Past performance does not guarantee future results.