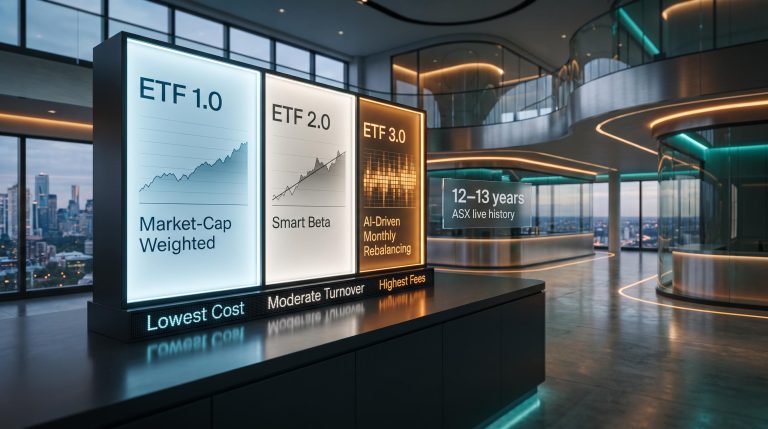
Most ETFs wearing the “AI” label are factor funds with a marketing budget. They screen for momentum, value, or quality, wrap the methodology in language about machine learning, and ship a product that behaves almost identically to the smart-beta fund sitting next to it on the shelf. VanEck’s GOAT ETF (ASX: GOAT) is the product that forces you to ask whether this one is genuinely different.
The gap between smart-beta marketing and live investor outcomes is well-documented, and factor investing limitations extend beyond cyclical underperformance to include the reality that most backtested factor premiums fail out-of-sample replication tests once transaction costs and capacity constraints are applied.
The answer, structurally at least, is yes. From 20 July 2026, GOAT stopped tracking a Morningstar wide-moat index and switched to the Akros Enhanced World ex Australia Index, built by Seoul-based Akros Technologies using a generative reinforcement learning engine. That makes it, by VanEck’s description, the first genuinely AI-driven ETF listed on the ASX, and it represents a philosophical break from everything the fund was designed to do when it launched in September 2020.
Here is what you need to understand before you allocate: how the AI discovers its own investment signals, what constraints prevent it from producing an unrecognisable portfolio, what a simulated 21-year track record actually tells you about stress-period behaviour, and where the visibility into the strategy ends.
From wide-moat index to AI engine: what changed in July 2026
The shift from old GOAT to new GOAT is not an upgrade. It is a replacement. Understanding the distance between the two versions is what stops you from treating this as just another VanEck international equity product.
What the wide-moat era looked like
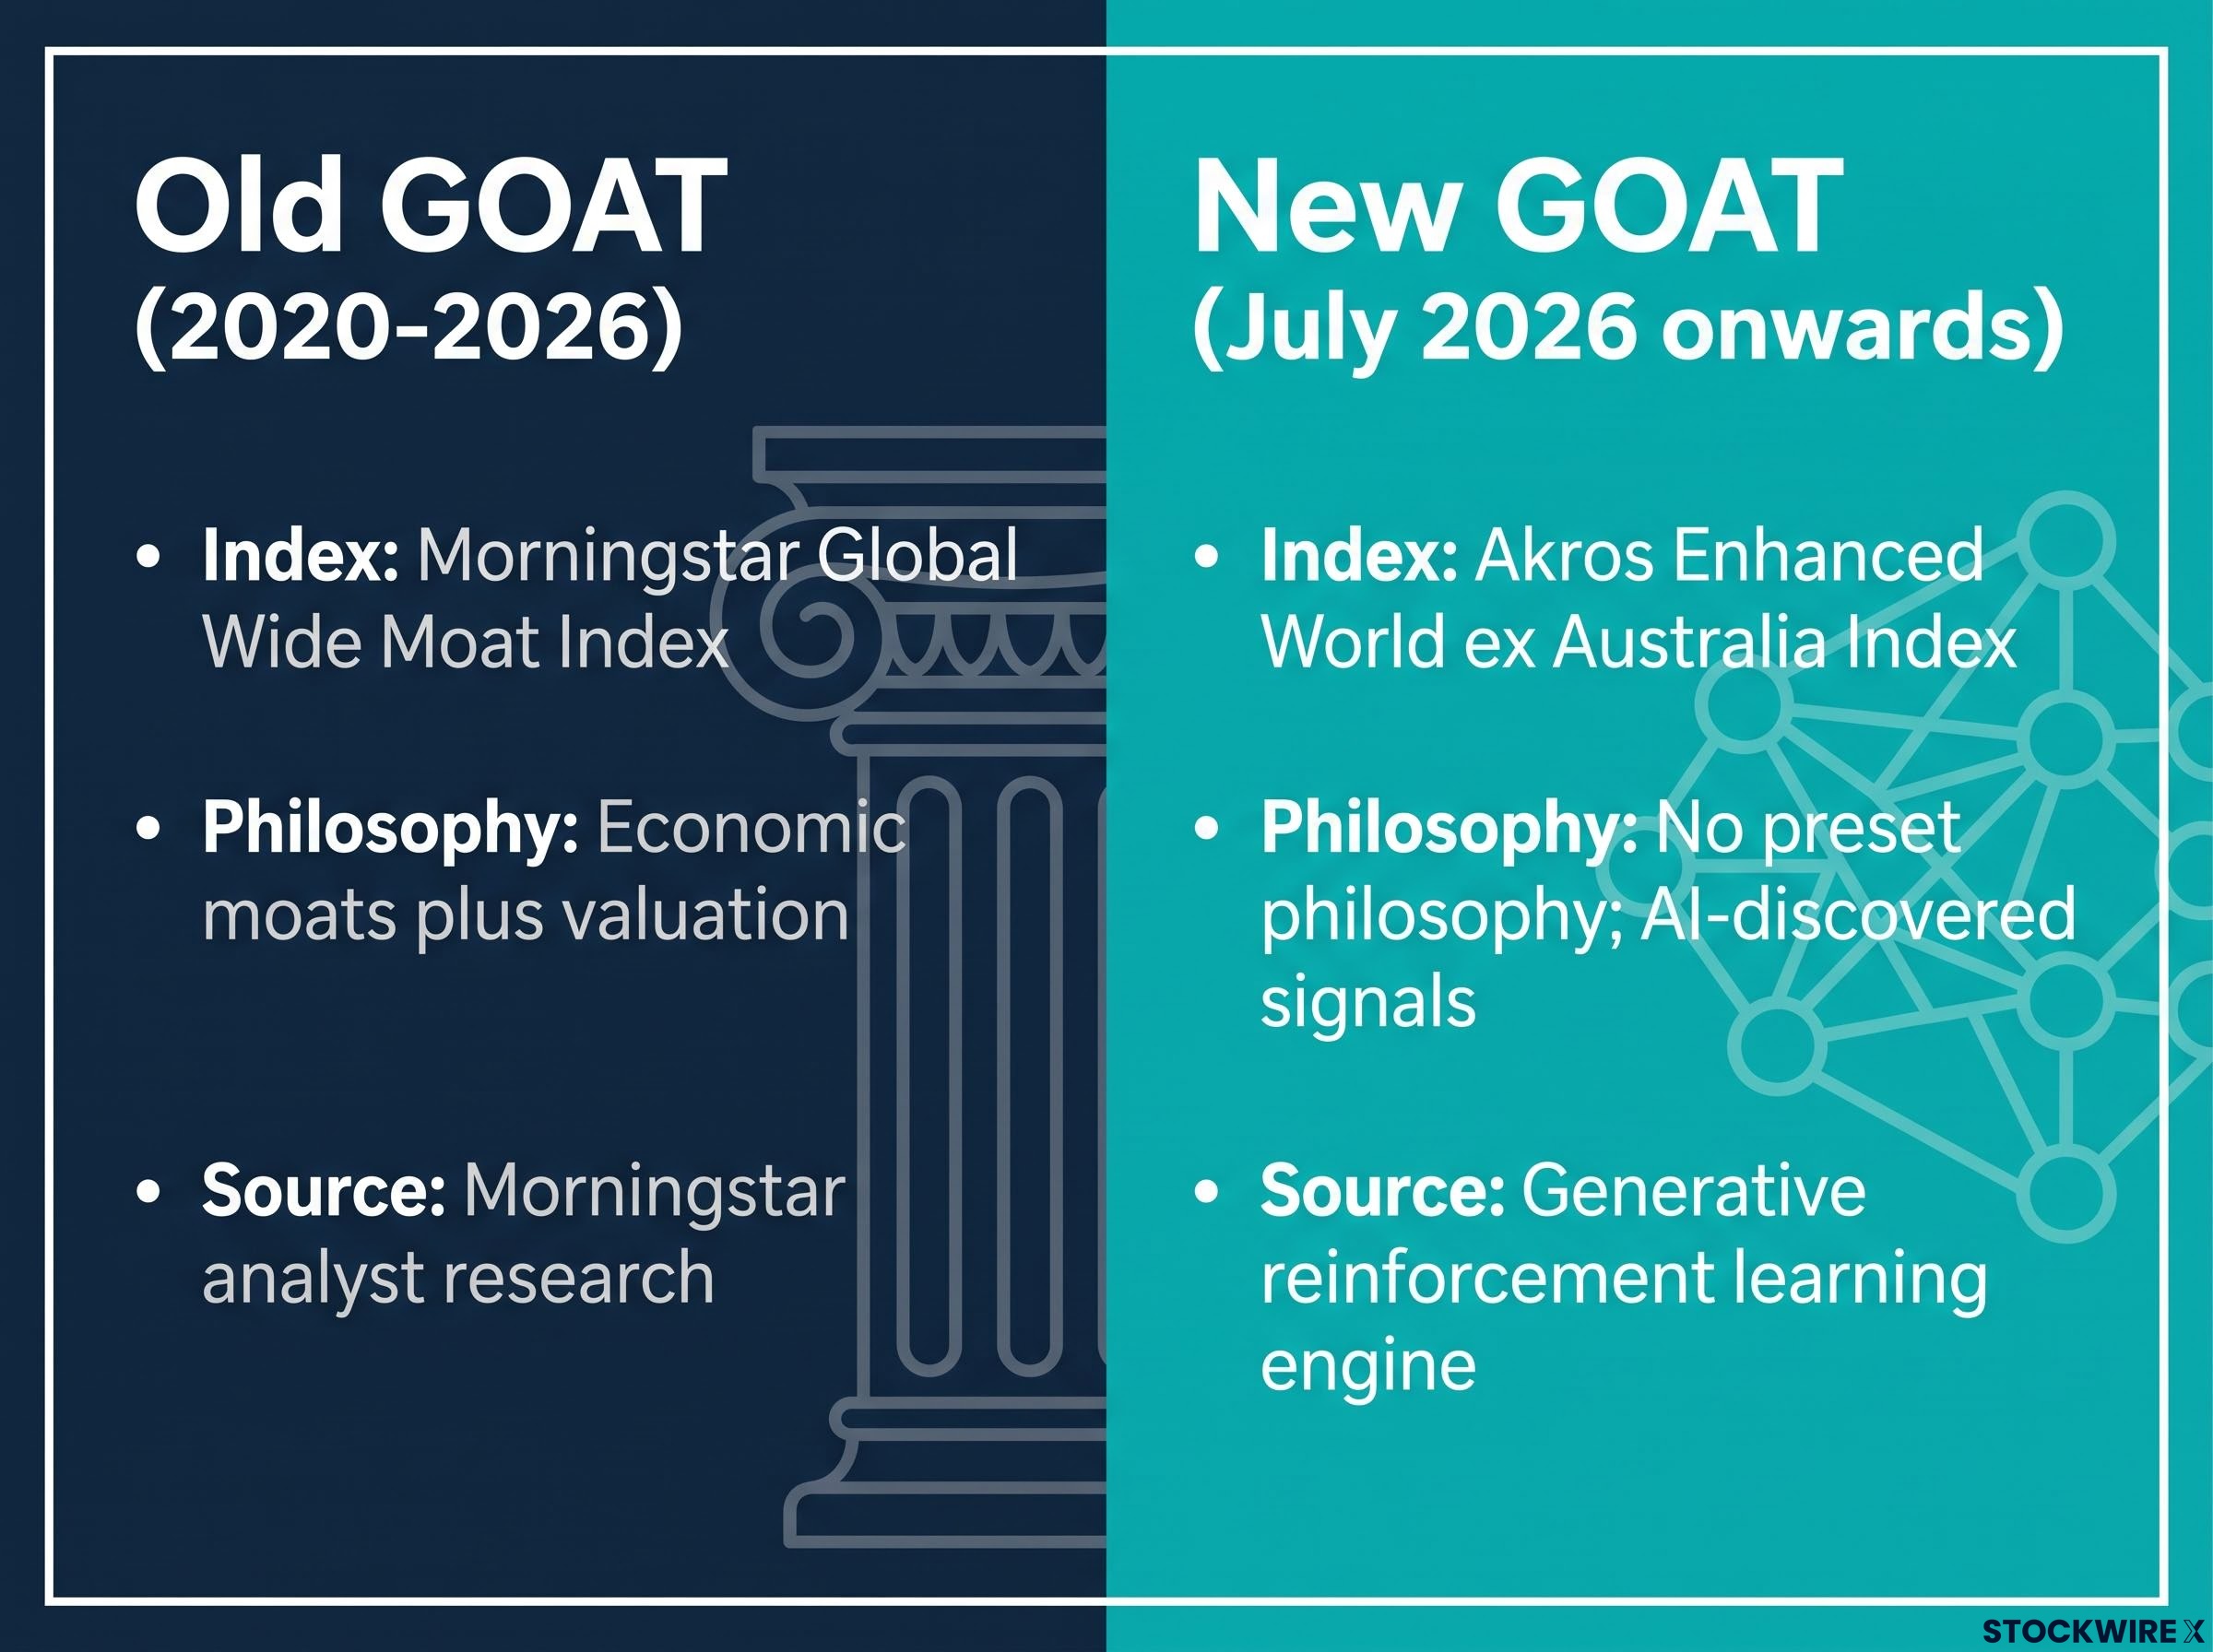
The original GOAT tracked the Morningstar Global Wide Moat Index, selecting companies that Morningstar’s analysts rated as having durable competitive advantages and that were trading at attractive valuations. It was a companion to VanEck’s Australian wide-moat ETF (MLAT) and sat within a broader franchise anchored by the US-listed MOAT, which holds approximately US$12 billion in assets under management. The investment philosophy was specific: economic moats plus valuation, informed by human analyst research.
The Akros partnership and the new mandate
From 20 July 2026, that philosophy was retired entirely. GOAT now tracks the Akros Enhanced World ex Australia Index, developed by Akros Technologies in Seoul, South Korea. VanEck disclosed the partnership in a product interview recorded on 23 June 2026, roughly a month before the switch went live.
The engine operates without any predetermined direction. Rather than being steered toward value, quality, moats, or any other predefined factor, it identifies investment signals purely through algorithmic discovery. You are no longer backing a defined investment philosophy; you are backing a process.
| Attribute | Old GOAT (2020-2026) | New GOAT (July 2026 onwards) |
|---|---|---|
| Index tracked | Morningstar Global Wide Moat Index | Akros Enhanced World ex Australia Index |
| Investment philosophy | Economic moats plus valuation | No preset philosophy; AI-discovered signals |
| Signal source | Morningstar analyst research | Generative reinforcement learning engine |
| Factor anchoring | Anchored to moat and value factors | No fixed factor; signals discovered and retired dynamically |
When big ASX news breaks, our subscribers know first
The data foundation: what the AI is actually learning from
Before the AI can score a single stock, it needs raw material, and the scale of that raw material is what separates this from a faster version of a momentum screen.
The data scale: Approximately 100 terabytes of information, a volume that has been compared to the contents of tens of millions of books, drawn from close to a century of market history.
The engine processes tens of thousands of signals at any given point, grouped into three categories:
Company fundamentals:
- Return on equity
- Margins and profitability
- Leverage and interest coverage
- Valuation ratios
Market-based and technical:
- Price trends and momentum
- Volatility and relative strength
- Pair trading indicators
- Liquidity patterns
Macroeconomic:
- GDP growth and inflation
- Unemployment and interest rates
- Sector-level economic data
The investable universe covers approximately 1,200 of the largest companies across developed markets outside Australia, making its scope broadly comparable to MSCI World ex Australia. Each month, the model reassesses every company and every live signal. Signals that lose predictive power are retired; new signals can be introduced as conditions shift.
What this means for you is straightforward: the AI is not simply running a faster value or momentum screen. It is simultaneously processing company fundamentals, market behaviour, and economic context, and it is doing so across a signal set that reshapes itself over time. That multi-dimensional, adaptive input layer is the structural difference between this and smart beta.
How the AI converts tens of thousands of signals into 150 stocks
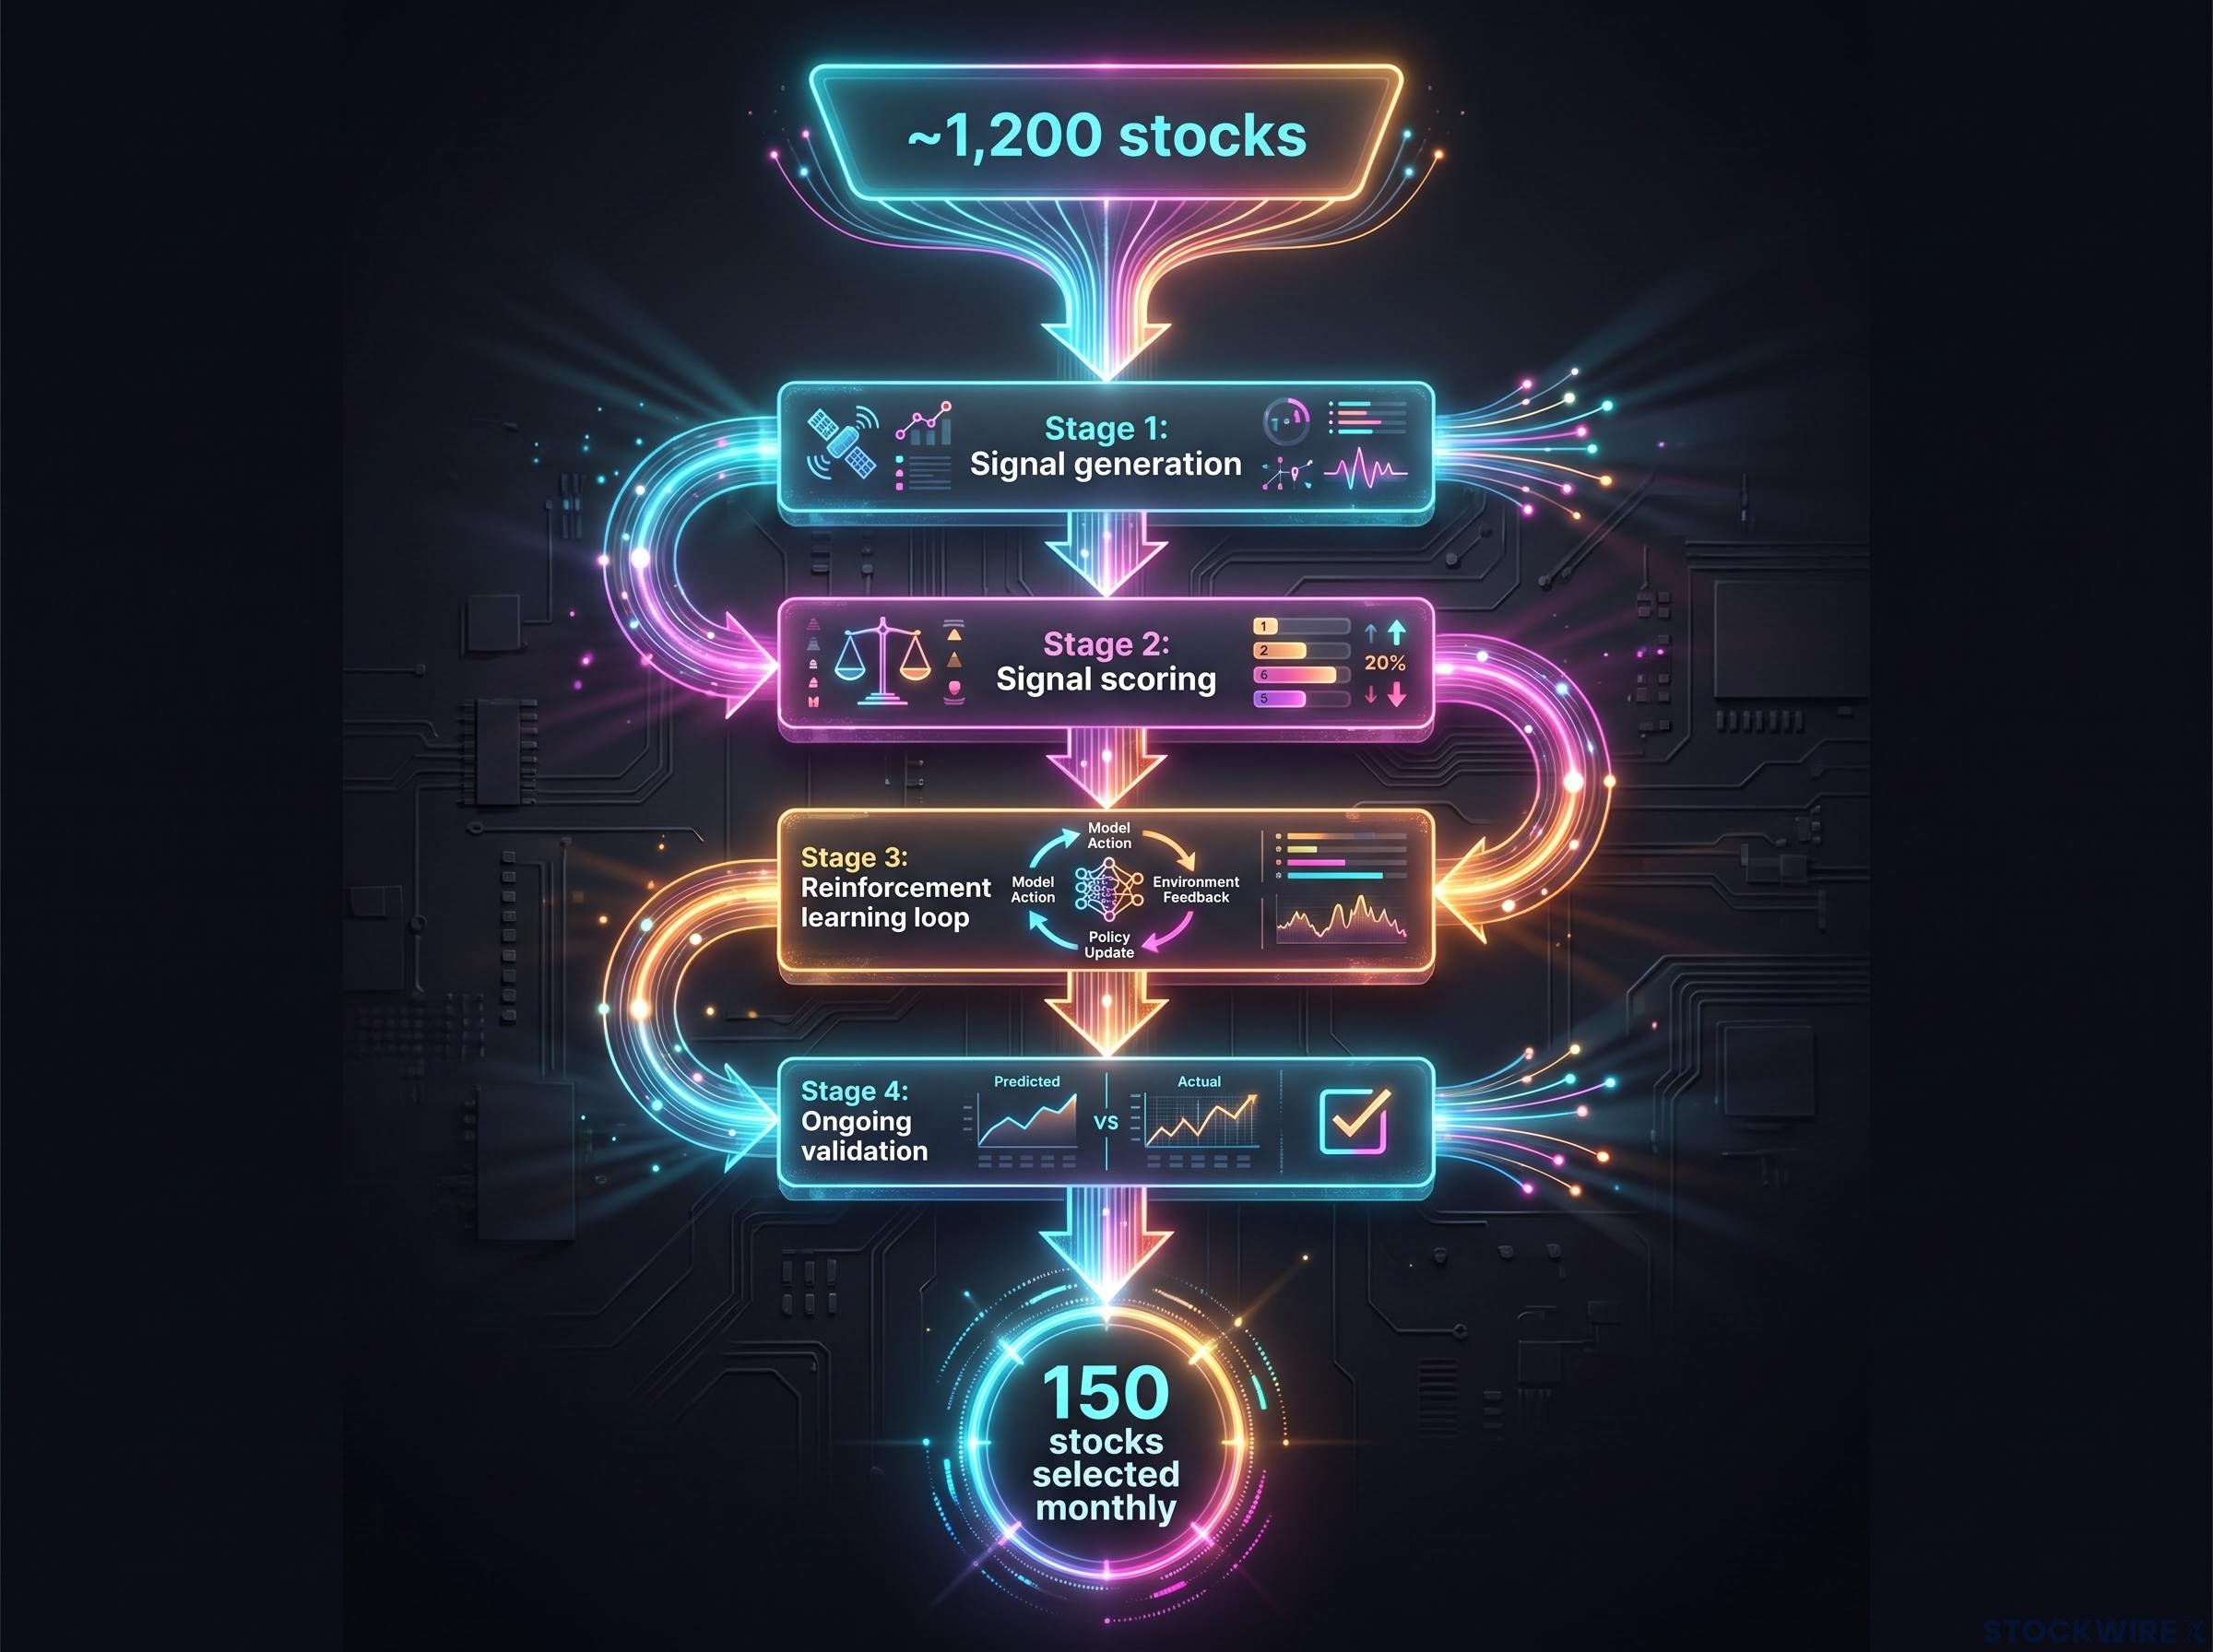
The mechanism has four stages, and each one exists because the previous stage creates a problem it cannot solve alone. Here is the chain:
- Signal generation: The AI discovers candidate investment signals algorithmically, without a human hypothesis, using generative reinforcement learning to search for relationships in historical data.
- Signal scoring: Each signal is evaluated across three dimensions: return generation, consistency across market regimes, and the smoothness of the return path over time. Passing signals are distilled into a single composite score per stock.
- Reinforcement learning loop: Working through its own historical decisions against actual outcomes, the model reduces the influence of or eliminates signals that underperform while strengthening those that consistently contribute.
- Ongoing validation: AI agents simulate many market scenarios and test signals against current conditions to prevent the portfolio from merely fitting historical crises or specific macro regimes.
Scoring signals: return, reliability, and risk
The three scoring dimensions each solve a different problem. Return generation asks the most fundamental question: has acting on this signal historically produced gains above the market? Reliability probes whether those gains held up across varying market environments or were limited to specific, narrow conditions. Risk examines whether the resulting return profile is stable enough to be usable in a real portfolio, factoring in drawdowns and extreme outcomes.
Only signals that clear all three filters survive. Those that do are compressed into a single composite score for each of the roughly 1,200 stocks in the universe. The higher your score, the higher the model’s assessed probability that you will outperform.
The reinforcement loop: how the model learns from its own mistakes
At the core of GOAT’s methodology is a generative reinforcement learning process, through which the model systematically compares its previous signal-driven decisions to the results those decisions actually produced. Signals that repeatedly contribute nothing useful are eliminated from the framework. Those that demonstrate persistent value are retained and can serve as the basis for developing further signals.
This is not discretionary learning. The model does not look at an individual stock loss and decide to avoid that company. It retires signals that fail statistically across the full universe. The self-correcting architecture means the signals driving today’s portfolio are not the same signals that drove it five years ago. That is both the source of the strategy’s potential edge and a reason its historical backtests require careful interpretation: the model that generated the simulated returns is, by design, a different model at different points in the simulation.
The broader mechanics of reinforcement learning in trading systems reveal why overfitting and black-box opacity are the two failure modes most likely to materialise in live markets, even when simulated performance looks compelling across historical stress episodes.
Portfolio guardrails: what stops the AI from going too far
Every investor considering an AI-driven fund asks the same practical question: how weird can this portfolio actually get? The guardrails exist to answer it, and each one solves a specific concentration risk.
The model selects the top 150 stocks by composite score each month from the roughly 1,200-stock universe. Each selected stock is then weighted by combining the AI’s conviction score with the company’s free-float market capitalisation, a method that keeps the portfolio anchored to the broader market’s structure while giving the AI’s strongest picks proportionally more influence.
Three explicit constraints cap how far the AI can deviate:
| Constraint type | Limit | Rationale |
|---|---|---|
| Single-stock cap | 5% at each monthly rebalance | Prevents excessive concentration in any one name |
| Sector deviation | ±10 percentage points vs MSCI World ex Australia | Keeps sector profile recognisable as global equity |
| Country deviation (US) | ±10 percentage points vs benchmark | Prevents extreme US over- or underweight |
| Country deviation (other) | ±5 percentage points vs benchmark | Limits non-US country concentration risk |
Current tilt (as of 23 June 2026): Information technology sat at a modest underweight compared to MSCI World ex Australia, while energy, industrials, and materials all carried overweight positions.
Top holdings at that date included:
- Micron Technology
- SanDisk
- Seagate Technology
- Caterpillar
- Fortinet
- Lockheed Martin
Looking back across the simulated 21-year history of the index, the US country weight has swung across a range spanning roughly 10 percentage points underweight to 10 percentage points overweight, which gives you a concrete sense of the band the AI operates within. Even a fully autonomous signal cannot produce a portfolio that becomes 80% US technology stocks. For you, comparing this to a vanilla international equity ETF, these guardrails define the actual boundaries of how different GOAT can be from the benchmark.
What the 21-year backtest shows, and what it cannot tell you
The Akros index has no live track record as of the July 2026 relaunch. Everything available is simulated, and understanding the distinction between simulated results and live performance is non-negotiable if you are evaluating this product seriously.
Reading the stress-period results
The simulated track record extends across 21 years starting from a July 2005 base date, a period that encompasses the Global Financial Crisis, the European sovereign debt crisis, the US-China trade tensions, the COVID-19 pandemic, and the Liberation Day market sell-off.
Simulated annualised outperformance: approximately 3.2% per annum above MSCI World ex Australia across the full 21-year simulation. This figure is backtested, not live.
VanEck places greater emphasis on how the strategy behaved during adverse market conditions than on the headline return number. Excess returns in the simulation were most concentrated during sharp market downturns and periods of broader stress, which suggests the strategy’s design skews toward capital protection when conditions deteriorate. The flip side is that a strategy that outperforms during crises may lag during strong momentum-driven bull runs. Your portfolio positioning should reflect that conditional profile.
The survivorship bias problem and how it is addressed
Survivorship bias is the risk that a backtest looks better than it should because it includes companies that exist today but excludes ones that failed or delisted during the test period. Avoiding this requires the backtest to treat each historical date as a genuine decision point, using only the information and the company universe that would have been available at that moment, and excluding any firm that had not yet listed.
VanEck and commentators explicitly caution that simulated results are not a reliable guide to future performance.
AI model convergence risk sits alongside the overfitting concern as a structural hazard for strategies built on shared signal architectures; when multiple AI-driven funds independently discover similar patterns across the same data history, their portfolios can converge in ways that amplify correlated exits during market stress.
Past performance does not guarantee future results. Financial projections are subject to market conditions and various risk factors.
How much visibility investors actually have into the strategy
Owning an AI-driven ETF means delegating part of your decision-making to a model you cannot fully audit. The question is whether you know enough about the framework and constraints to give informed consent. Here is where the line sits.
| What investors can see | What remains proprietary |
|---|---|
| Universe: ~1,200 developed-market stocks ex-Australia | Exact signal formulas and thresholds |
| Signal categories: fundamentals, technical, macroeconomic | Full architecture of the reinforcement learning model |
| Portfolio size: 150 stocks, selected monthly | Specific weightings assigned to individual signals in the composite score |
| Rebalancing frequency: monthly | |
| Constraint framework: 5% stock cap, ±10pp sector, ±10pp US country, ±5pp other country | |
| Four-stage process framework |
The proprietary boundary is not unusual. No quantitative hedge fund publishes its full signal set, for the same reason: disclosing exact formulas would allow front-running and decay the edge the strategy relies on. The trade-off between transparency and competitive advantage is inherent to advanced quant strategies, not a flaw specific to GOAT.
ASIC’s Regulatory Guide 282 for exchange traded products, issued in November 2025, sets out the portfolio disclosure requirements and admission standards that apply to all ETPs listed on Australian exchanges, including products like GOAT that use non-traditional index methodologies.
For you, the practical question is whether the disclosed guardrails (sector caps, country limits, stock-weight ceiling, monthly rebalancing, 150-stock selection) give you enough information to consciously delegate to this process. If they do, you are making an informed allocation. If they do not, no amount of simulated outperformance should change your mind.
Allocating to GOAT with eyes open
GOAT is not a passive international equity ETF, and it is not a traditional smart-beta factor fund. It is a bet on an adaptive process: a generative reinforcement learning engine that discovers, scores, and retires its own signals under explicit sector, country, and concentration constraints. When you buy GOAT, you are backing the proposition that this self-correcting architecture can identify patterns that static factor models miss, particularly during market stress.
For investors weighing GOAT against alternatives, the broader field of AI ETF options on the ASX spans from broad index funds with incidental AI exposure through to concentrated semiconductor products, and the right choice depends on how much conviction and drawdown tolerance you are actually working with.
The simulated 21-year track record suggests approximately 3.2% annualised outperformance, concentrated in drawdown periods. That is promising but unproven in live markets. The live track record from July 2026 onwards is the data that will ultimately validate or challenge those results.
If you allocate, track how the portfolio’s sector and country tilts evolve through future monthly rebalances. That is your window into whether the AI is behaving as described, and it is the closest thing to a real-time audit available to you.
This article is for informational purposes only and should not be considered financial advice. Investors should conduct their own research and consult with financial professionals before making investment decisions.