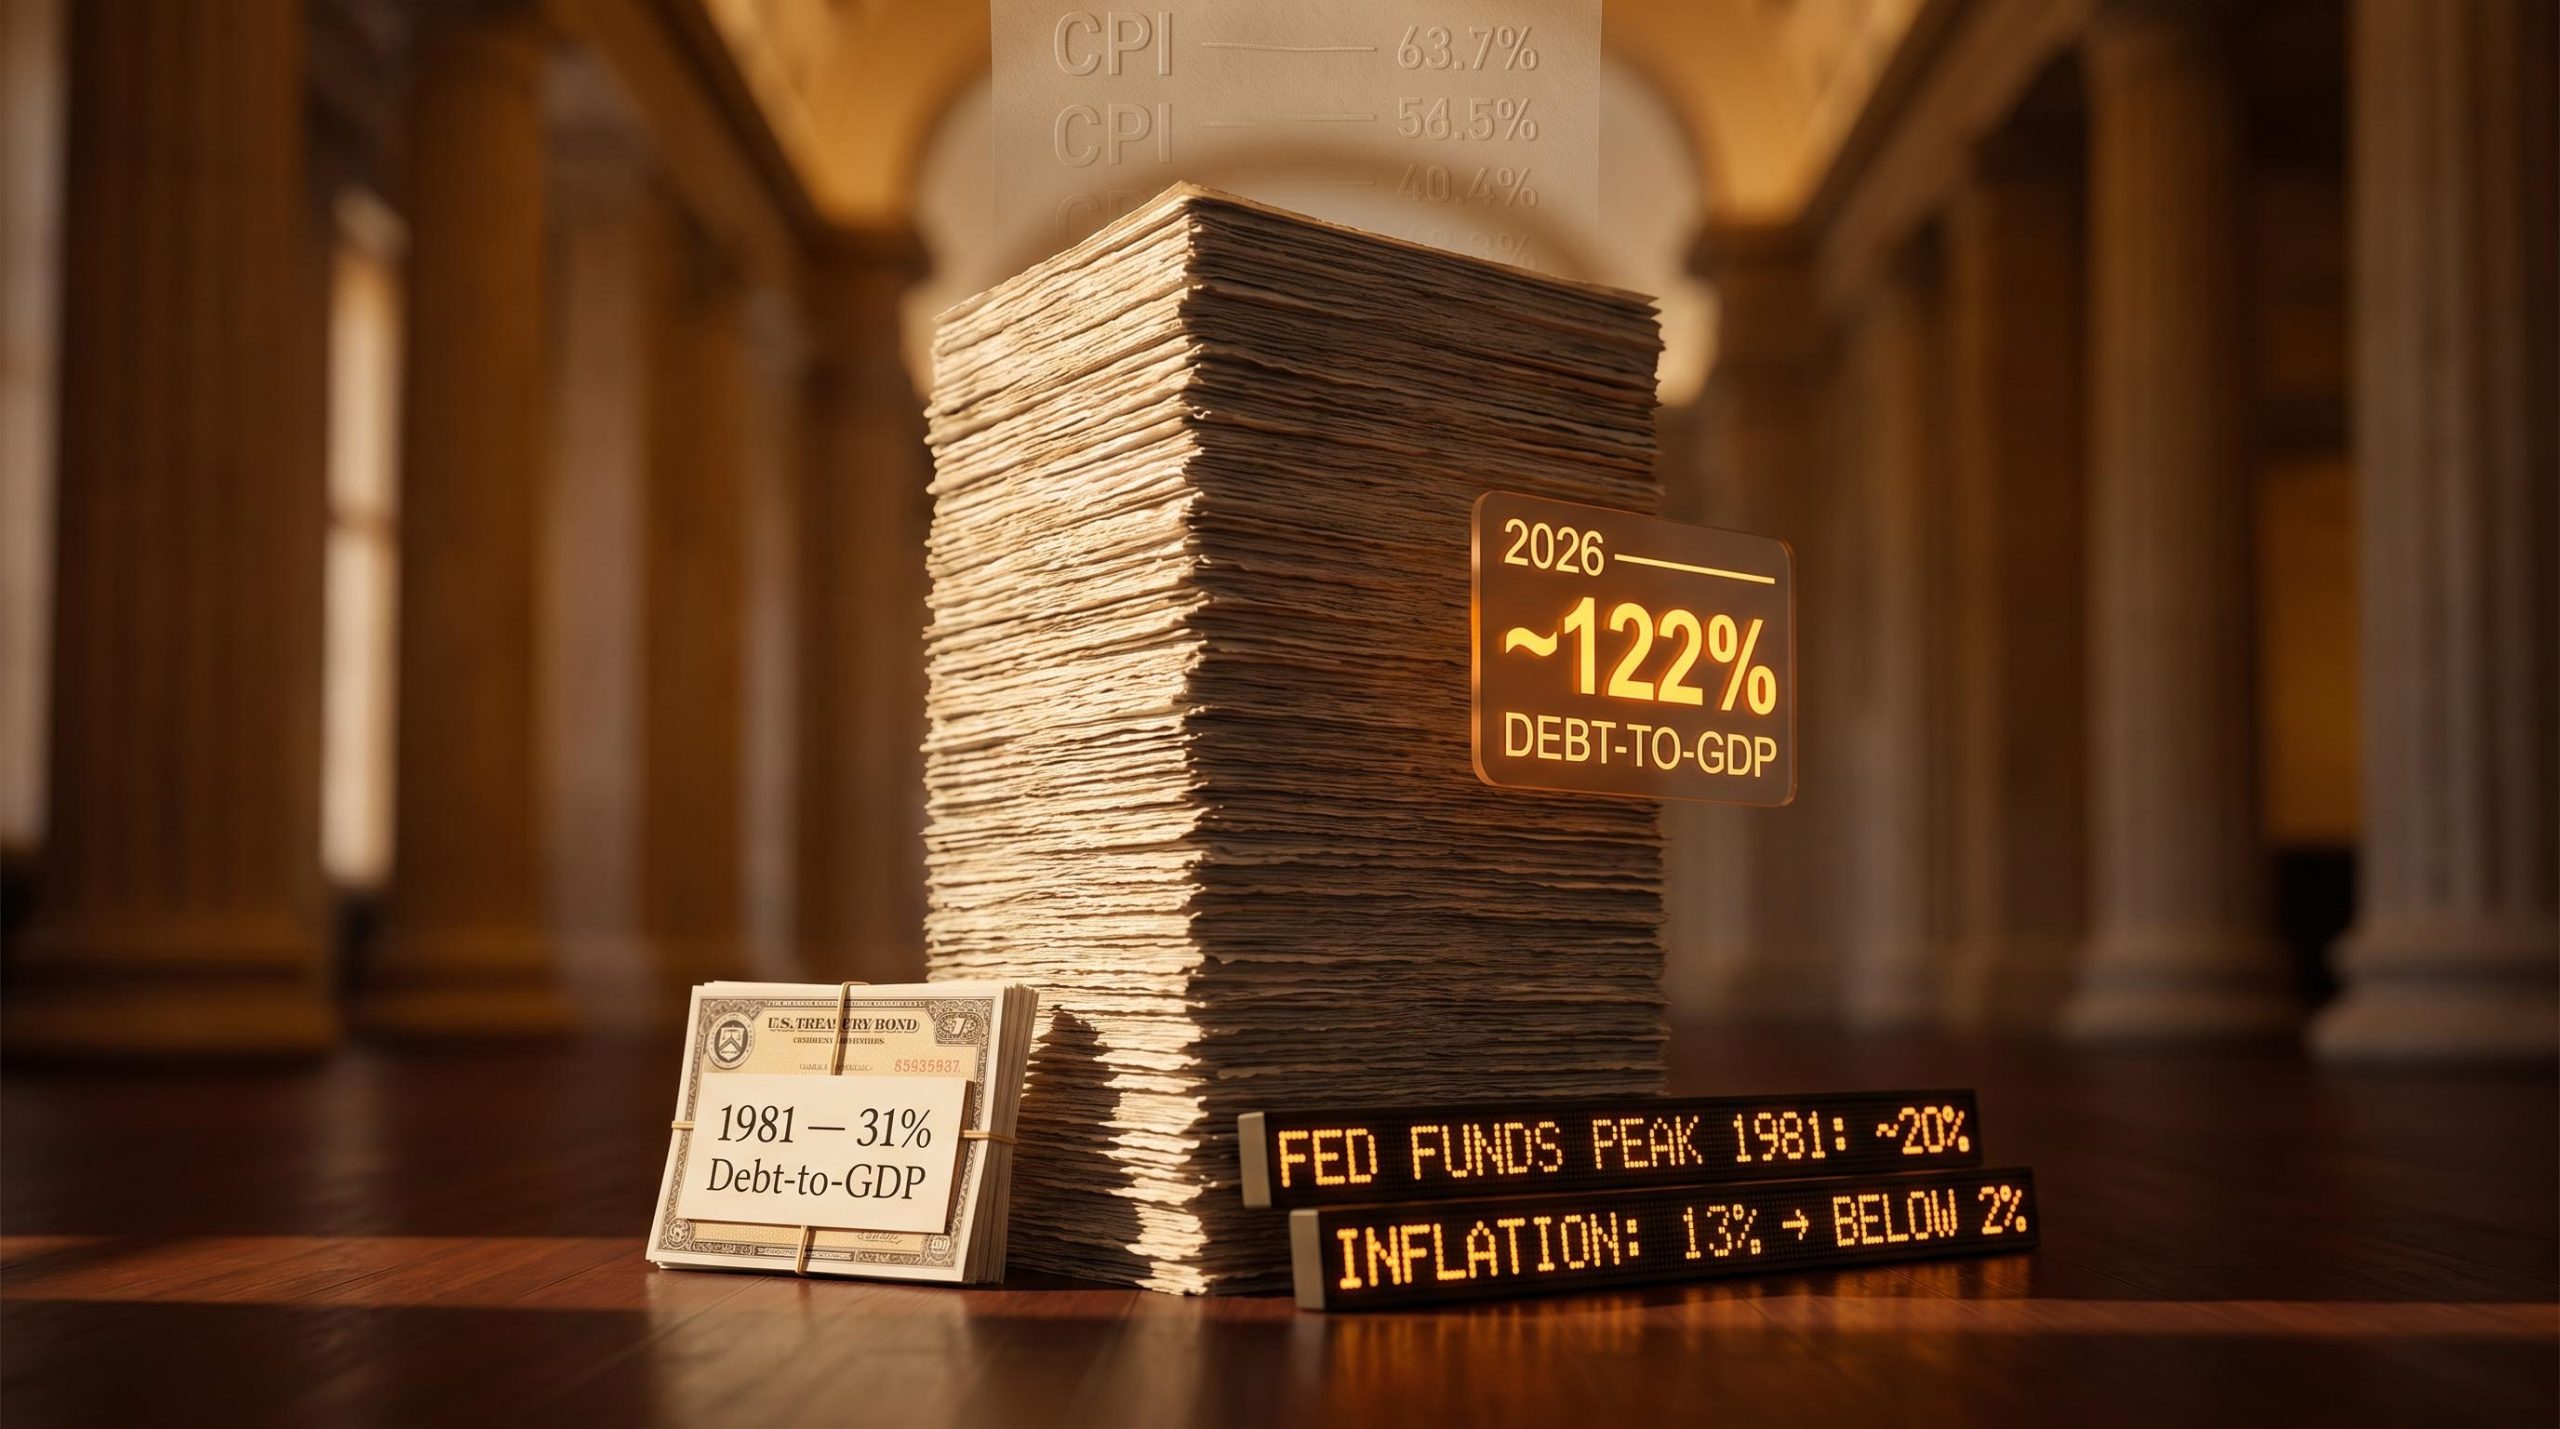
U.S. federal debt is now roughly four times larger, relative to the size of the economy, than it was when Paul Volcker crushed inflation in 1981. That single ratio reshapes everything about how rate policy works today.
For more than five years, inflation has sat above the Federal Reserve’s 2% target. The question many people ask, “why doesn’t the Fed just do what Volcker did?”, has a specific, structural answer, and it has almost nothing to do with political will or competence.
Here is the fiscal constraint that makes a Volcker repeat so difficult, and what it means for the rate environment, the inflation path, and the financial decisions you are making right now with your own savings, debts, and long-term plans.
What Volcker actually did, and what it cost
Paul Volcker’s campaign against inflation was one of the most aggressive monetary policy interventions in modern history. By the summer of 1981, the federal funds rate had been driven to around 20%, and the prime lending rate peaked at 21.5%. The economy endured two successive recessions and unemployment that climbed into double digits before the medicine worked: inflation dropped from above 13% to below 2%.
The St. Louis Fed’s historical account of the Volcker disinflation documents that the federal funds rate reached approximately 19% by mid-1981, with unemployment climbing above 10% across two successive recessions before inflation broke, confirming the severity of the fiscal and economic conditions that made that campaign possible.
The key data points tell the story concisely:
- Federal funds rate peak: approximately 20% (mid-1981)
- Prime lending rate peak: 21.5%
- Inflation outcome: from above 13% to below 2%
What made that campaign survivable from a fiscal standpoint was a condition that no longer exists. U.S. gross federal debt stood at approximately 31% of GDP in 1981.
Debt-to-GDP in 1981: approximately 31%
That figure is not historical trivia. It tells you that Volcker operated in a fiscal environment where aggressive rate hikes did not simultaneously threaten to detonate the government’s own balance sheet. That distinction is the entire engine of what follows.
When big ASX news breaks, our subscribers know first
The debt arithmetic that changes everything
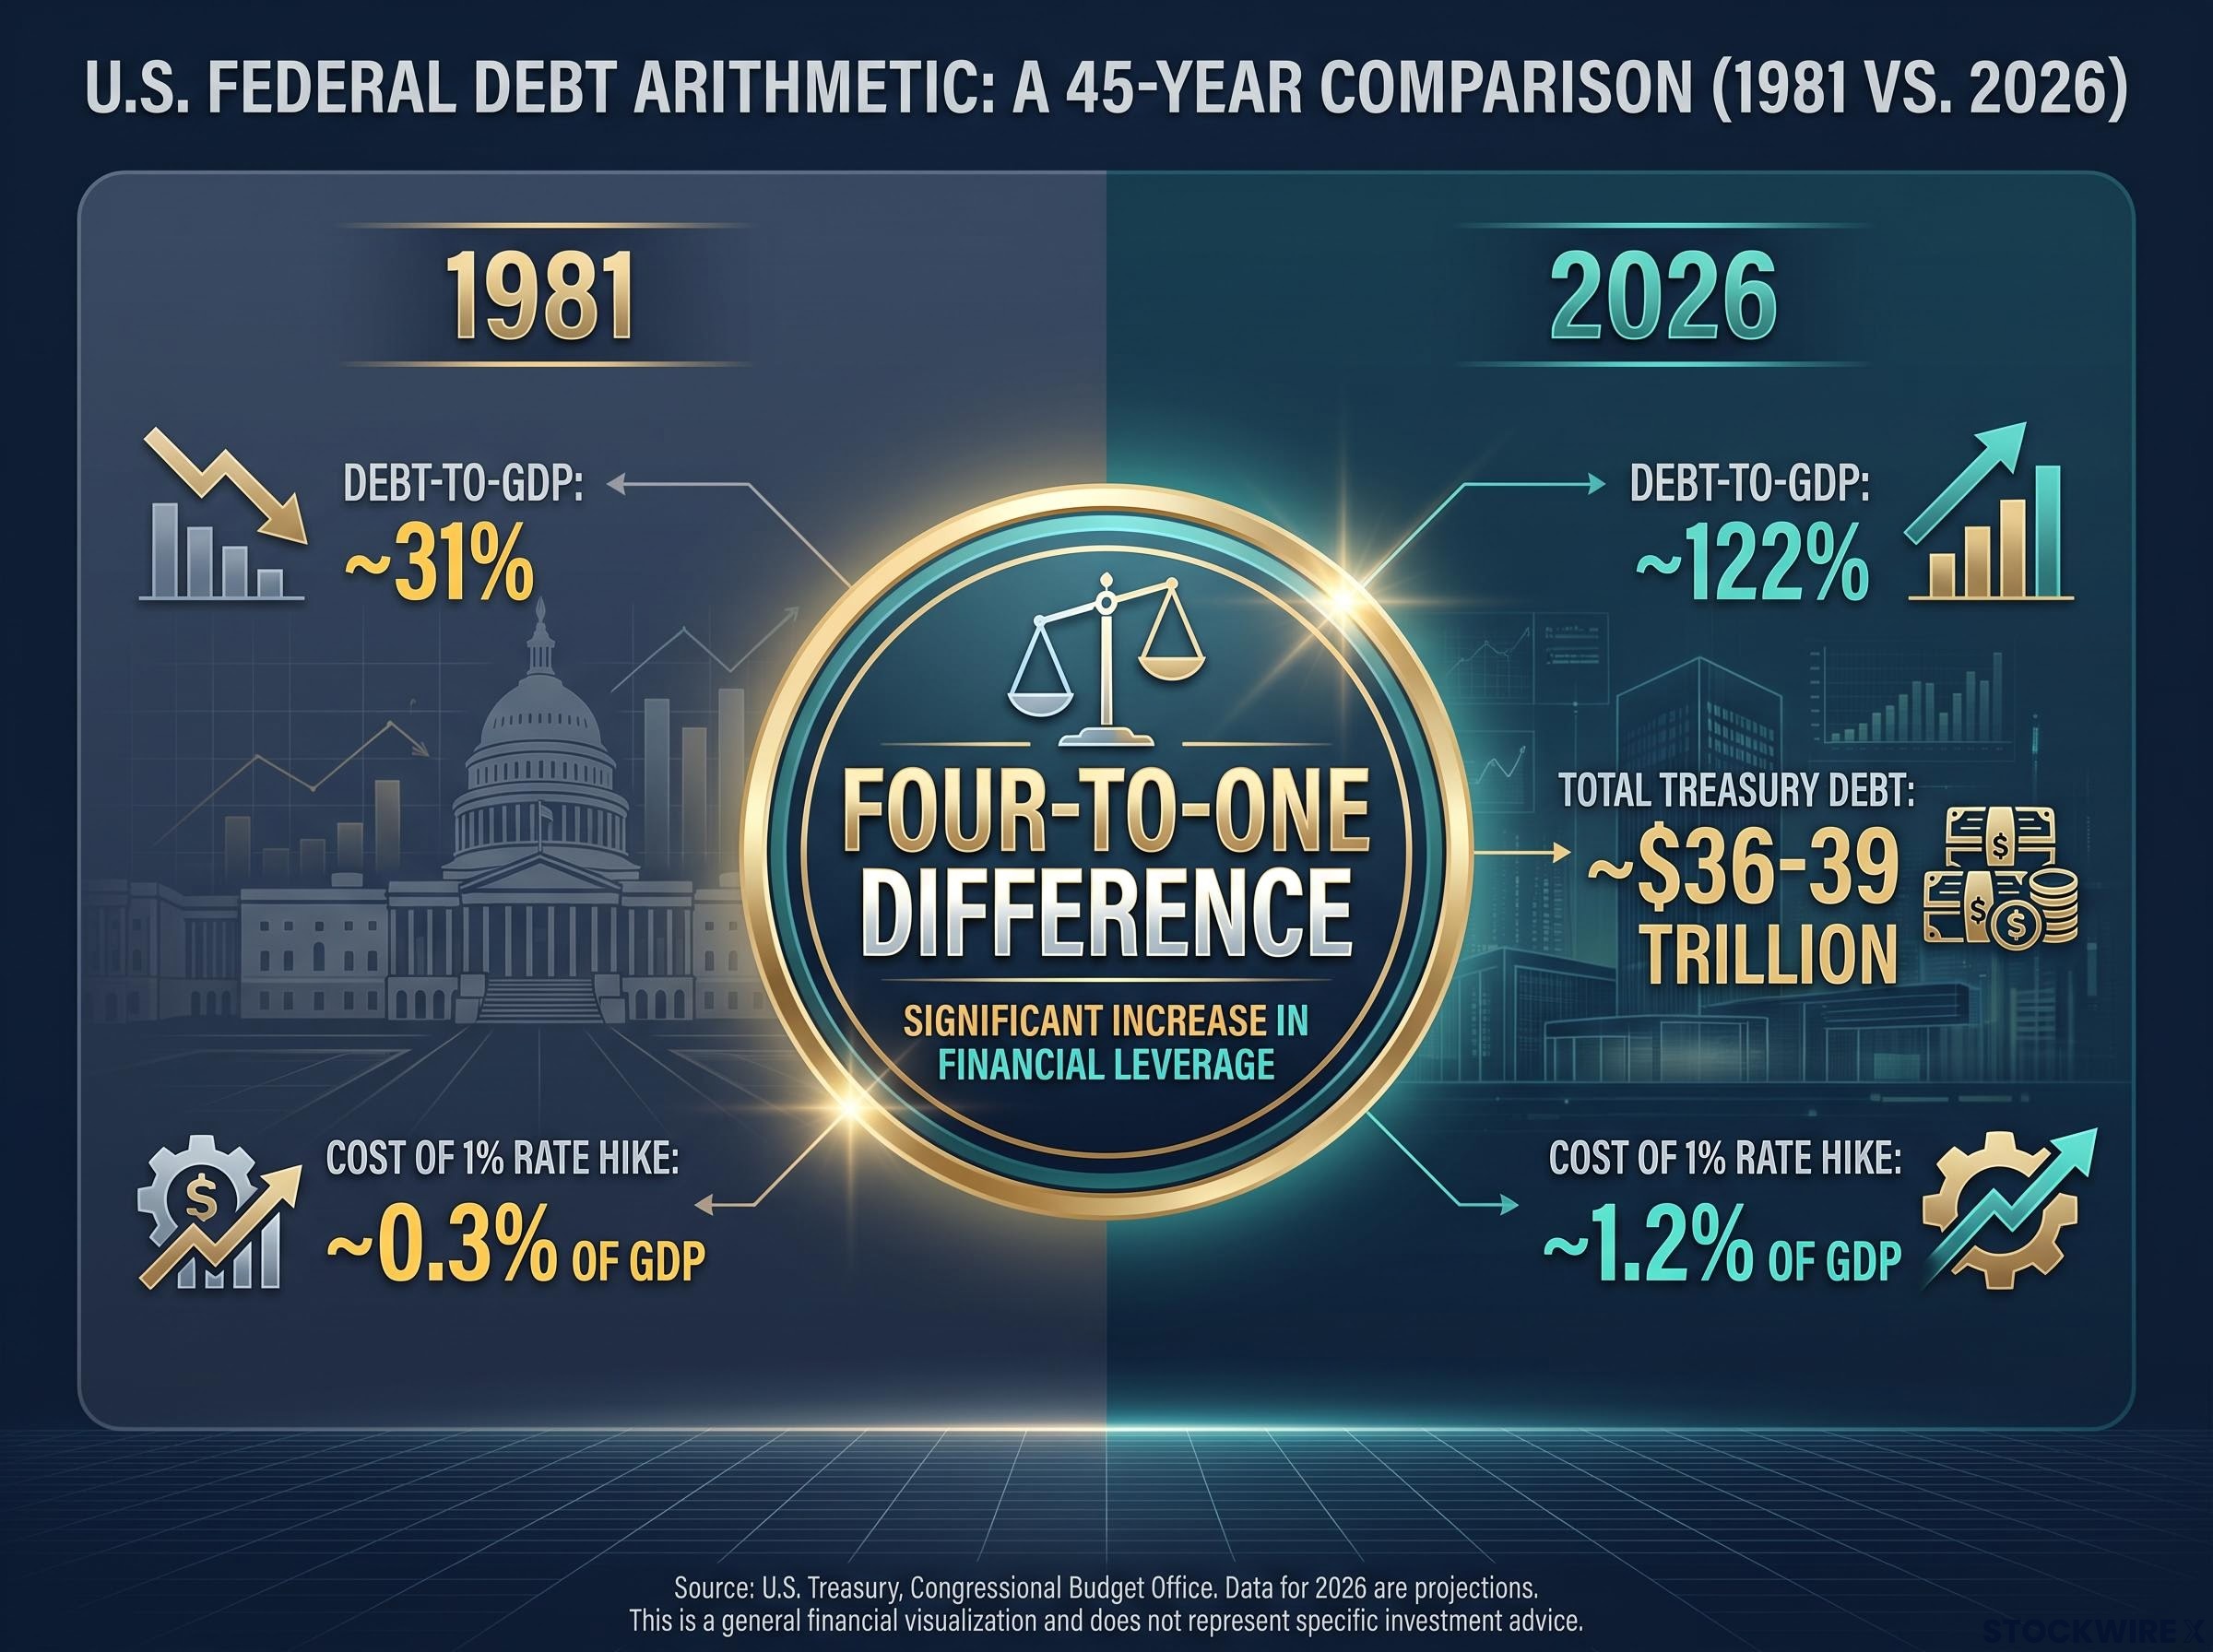
The core mechanic is straightforward: interest costs equal the interest rate multiplied by the stock of debt. A larger debt stock means the same rate increase produces a proportionally larger interest bill.
| Metric | 1981 Value | 2026 Value |
|---|---|---|
| Debt as a share of GDP | ~31% | ~122% |
| Total Treasury debt (context) | Substantially smaller nominal base | ~$36-39 trillion |
| Additional annual interest cost per 1-percentage-point rate increase | ~0.3% of GDP | ~1.2% of GDP |
Walk through the arithmetic yourself. In 1981, with debt at 31% of GDP, every sustained 1-percentage-point increase in the average interest rate on federal debt translated into roughly 0.3% of GDP in additional annual interest. Today, with debt at approximately 122% of GDP (roughly $36-39 trillion in total Treasury debt as of Q1 2026), that same 1-percentage-point increase implies approximately 1.2% of GDP. That is a four-to-one difference.
The full effect does not arrive overnight. Much of the existing debt is locked into bonds issued at older, lower rates. But as those bonds mature and are refinanced at current rates, the higher cost bites progressively harder over several years.
Debt spiral dynamics compound through the bond market before reaching household balance sheets: rising Treasury yields push up mortgage rates, compress equity risk premiums, and increase the cost of every new dollar the government must borrow to cover interest on existing obligations.
What that four-to-one ratio means for you is direct: a Volcker-scale rate campaign today would impose fiscal costs on the government roughly four times faster than Volcker’s own campaign did, compressing the window within which policymakers could sustain such a campaign before facing overwhelming political pressure to reverse it.
Why the 2% target exists, and why it may be harder to reach than official language suggests
The 2% inflation target was not plucked from an equation or handed down from first principles. Central banks arrived at it over several decades through practical reasoning, and the logic on both sides of the number is more considered than it is usually given credit for. Setting the target at zero creates a specific trap: because the Fed’s primary recession-fighting tool is cutting interest rates, a starting point of zero inflation means rates are already near the floor when a downturn arrives, leaving almost no room to act. That is the mechanism behind prolonged economic stagnation. Pushing the target substantially higher creates the opposite problem; at 4%, the price level roughly doubles in around 18 years, which makes long-horizon contracts difficult to price and erodes confidence in the currency as a stable unit of account. Two percent sits between those failure modes: modest enough that it barely registers in everyday decisions, large enough that the central bank retains meaningful room to respond when conditions deteriorate.
There is an important distinction most people miss. The Fed targets the rate of inflation, not the price level. This means that once inflation returns to 2%, it will be doing so from a higher price base, not pulling prices back to where they were. The increases accumulated over recent years become the permanent new floor; the pace of further rises simply slows. The cost-of-living adjustment you absorbed is not reversed, it is locked in as the starting point for whatever comes next.
As of June 2026: Headline CPI inflation stands at approximately 3.5%. Core PCE inflation sits at approximately 3.3%. Inflation has remained above the 2% target for well beyond five years.
The Congressional Budget Office (CBO) expects overall price growth to slow but remain above 2% in 2026 under its baseline assumptions. Connect this back to the fiscal constraint: with very high debt making a sustained Volcker-style campaign fiscally painful, the more probable path is gradual disinflation. That means inflation averaging modestly above 2% for an extended period rather than snapping back to exactly 2.0%.
Persistent inflation regimes historically run in generational cycles rather than mean-reverting quickly to target, with 150 years of data suggesting the current episode could extend for two decades if the structural forces driving it remain in place.
For your financial planning, this matters directly. Assuming inflation returns to exactly 2% quickly is probably optimistic, and decisions made on that assumption carry a real risk of underestimating future purchasing-power erosion.
What fiscal dominance means, and why it matters for your interest rate expectations
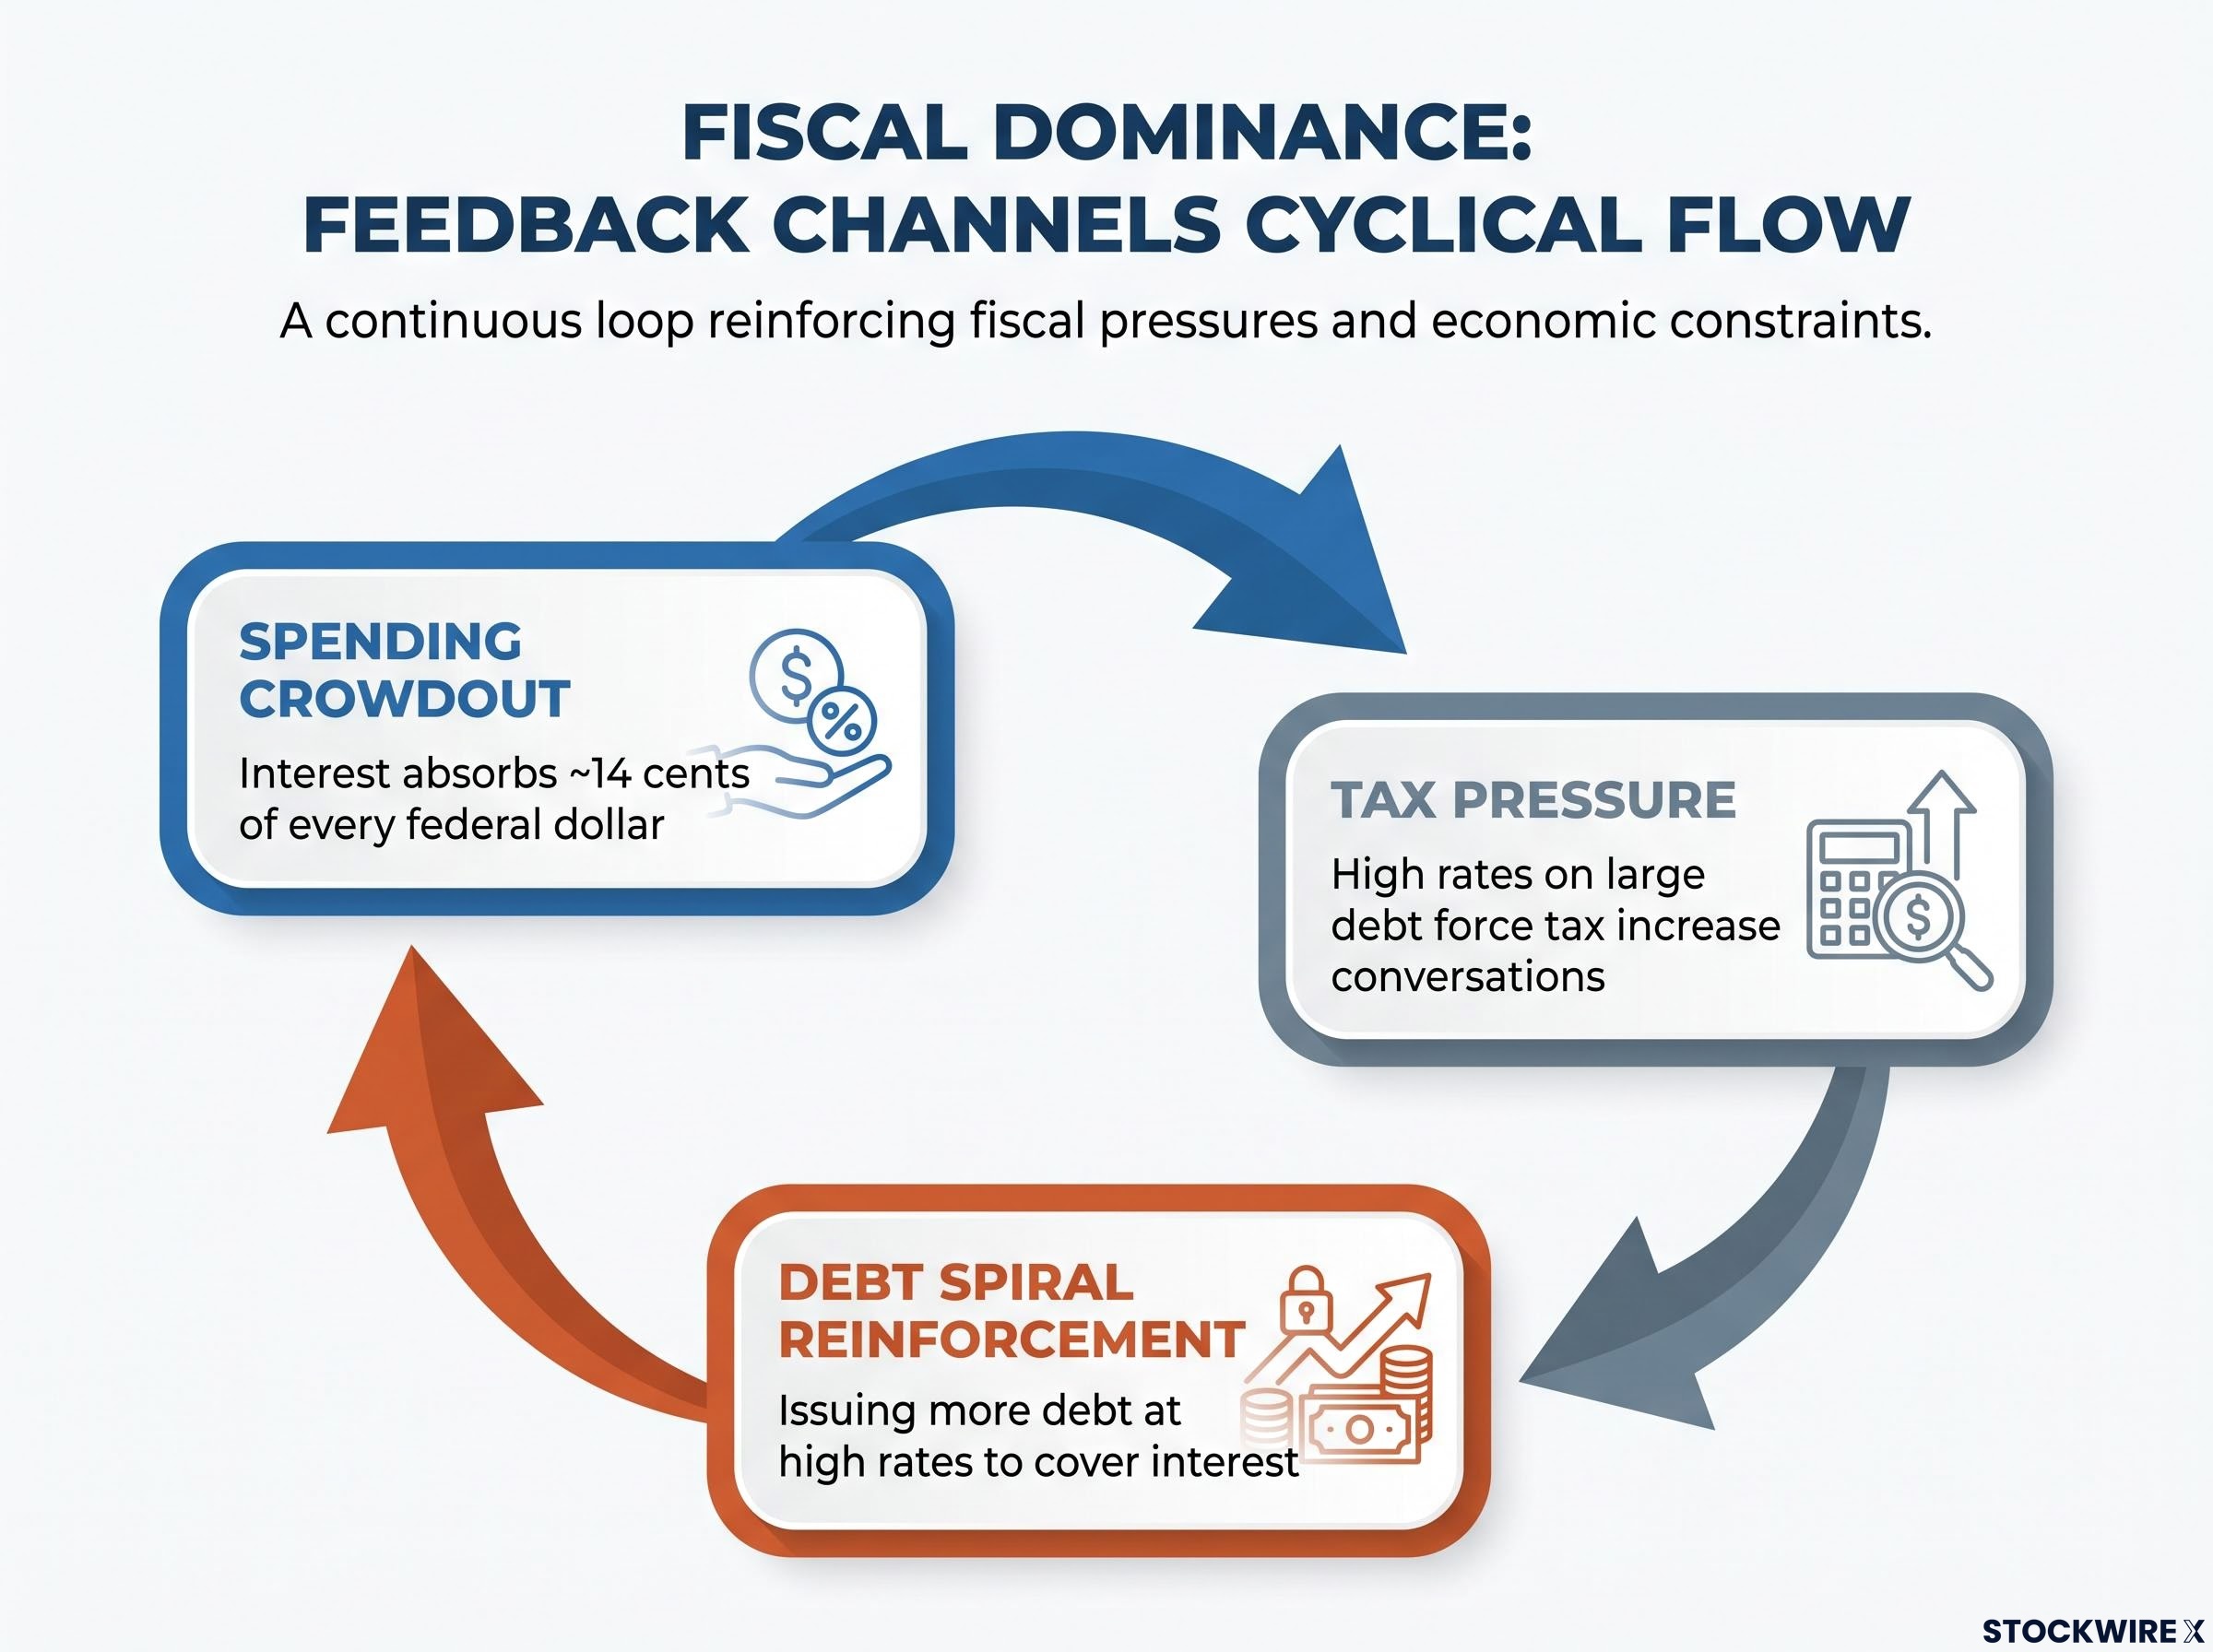
Fiscal dominance is a term you are unlikely to encounter in most financial commentary, but it describes the single most important structural dynamic shaping rate policy today. It refers to a regime in which the fiscal needs of the government begin to constrain what the central bank can do with monetary policy, because the interest bill created by high rates becomes politically and economically untenable.
The mechanism works through three specific feedback channels:
- Spending crowdout: Interest on the debt absorbs a growing share of federal spending, squeezing out defence, social programmes, and public investment. Research estimates suggest roughly 14 cents of every federal dollar is already absorbed by interest costs.
- Tax pressure: Sustaining high rates on a large debt stock eventually forces a conversation about tax increases to cover the growing interest bill.
- Debt spiral reinforcement: If the government must issue even more debt at high rates to cover the interest on existing debt, the problem feeds on itself.
CBO projections show net interest outlays becoming one of the largest federal spending components over the next decade. Research from the Dallas Fed and the Yale Budget Lab estimates that each additional percentage point of debt-to-GDP raises long-term Treasury yields by roughly 2-3 basis points through higher term premia (these are research estimates, not confirmed official figures).
The interest-to-revenue ratio, currently in the 17-19% range for fiscal year 2025, captures the fiscal constraint more precisely than debt-to-GDP alone because it directly links debt service costs to the government’s actual cash flows rather than to an annual output measure.
For you, fiscal dominance is not an abstract academic concept. It is the mechanism that explains why “higher for longer” rates are likely to be a feature of this decade rather than a temporary anomaly. The realistic rate path is not Volcker-scale rates held for years, but rates meaningfully higher than the 2010s environment, sustained for longer than past cycles, producing a slow grind toward lower inflation rather than a sharp break. Planning for a return to 2015-era rates in the near term is probably misaligned with the structural reality.
Rate policy lands on your contracts, not on you equally, and here is what to do about it
The way rate policy reaches you is indirect. It works through the specific contracts you hold, your mortgage, your credit card, your savings account, your retirement portfolio, and its effect on each of those depends entirely on whether the rate attached to it can move. Two people facing the same interest rate environment can experience completely different financial outcomes depending solely on what their paperwork says. That gap is not accidental, but it is also not a conspiracy. It is a mechanical consequence of contract structure, and in this environment, the differences are magnified.
Here are the four specific areas where you should be evaluating your position:
- Variable-rate debt (credit cards, HELOCs, adjustable-rate mortgages): Higher-for-longer rates keep these costs elevated for years, not months. Prioritise paying down high-rate revolving balances and, where feasible, refinance into fixed-rate structures to reduce exposure to further increases.
- Fixed-rate debt retention: A pre-2022 30-year fixed mortgage at 2-4% is worth holding onto carefully in this environment. Each payment is made in dollars that inflation has gradually eroded in value, which benefits you as the borrower. The rate on that loan is fixed for the life of the contract and cannot be changed by the lender; once you exit that agreement, whatever replaces it will be priced at whatever the market offers on that future day. In an environment where rates are structurally higher than the previous decade, giving up a low fixed rate carries a real long-term cost.
- Savings yield capture: Short-term safe yields are at levels not seen for over a decade. Treasury bills, high-yield savings accounts, money market funds, and certificates of deposit (CDs) now offer meaningful returns. Leaving significant cash in near-zero-yield accounts is a concrete opportunity cost you are paying every month.
- Long-term inflation assumption adjustment: A 2.5-3% inflation assumption for retirement planning or long-term budgeting may be more realistic than exactly 2.0% in this fiscal environment. This is an informed inference from current CBO and academic work, not an official target.
The structure of your balance sheet matters far more than any prediction about what the Fed will do next. The same macro environment that makes the Volcker playbook difficult simultaneously rewards households who hold low-rate fixed debt and punishes those carrying high-rate variable debt.
What higher-for-longer means for your savings and long-term planning
If you hold cash beyond your immediate needs, this is the best environment in over a decade for safe yield. Treasury bills offer government-backed returns. High-yield savings accounts and money market funds provide liquidity with meaningful interest. CD laddering, where you stagger maturity dates across several CDs, lets you lock in yields while keeping some reinvestment flexibility as rates shift.
Given the likelihood of inflation running above 2% on average, consider Treasury Inflation-Protected Securities (TIPS), which are government bonds whose principal adjusts with inflation, as part of a diversified fixed-income allocation. Focus on real (after-inflation) returns rather than nominal yields alone.
When building retirement calculators or long-term budgets, using exactly 2.0% inflation may be optimistic. CBO and academic work suggest persistent upward pressure on inflation from deficits and debt. A 2.5-3% planning assumption gives you a more conservative and defensible baseline for maintaining your desired purchasing power over time.
For readers wanting to translate the 2.5-3% inflation planning assumption into specific asset choices, our full explainer on inflation-proof asset allocation covers TIPS positioning, commodity exposure, and the pricing-power screening criteria that distinguish resilient portfolios from those quietly eroded by persistent above-target inflation.
What this fiscal constraint changes, and what it does not
The core structural point is worth restating clearly. The Fed can raise rates. But the four-to-one amplification of interest costs at 122% versus 31% debt-to-GDP meaningfully shortens the window for sustaining extreme tightening, making gradual disinflation the more probable path than a Volcker-style resolution.
This does not mean inflation is permanently out of control, that the dollar is at imminent risk, or that the Fed is powerless. It means the adjustment will take longer. It means accepting some period of above-target inflation as the pragmatic alternative to a fiscal crunch. The likely range of outcomes is inflation averaging modestly above 2%, rates higher than the 2010s but well below Volcker-era peaks, sustained for longer than past cycles.
The households best positioned in this environment are not those waiting for conditions to return to the 2010s baseline. They are the ones who have already made their balance sheets resilient to a longer stretch of above-target inflation and elevated but not extreme interest rates.
This is a decade-scale structural adjustment, not a short-term anomaly. Building your finances around that reality now is more productive than waiting to predict when the adjustment will conclude.
This article is for informational purposes only and should not be considered financial advice. Investors should conduct their own research and consult with financial professionals before making investment decisions. Financial projections and inflation estimates referenced are subject to change based on market conditions and various risk factors.