Two of the world’s largest companies surged by double digits in a single trading session this week. Not on a product launch. Not on an acquisition. On a set of quarterly numbers that answered a question investors had been carrying for two years: is AI infrastructure spending actually showing up in earnings?
The question mattered because the spending came first. Hundreds of billions of dollars committed to data centres, GPUs, and custom silicon across 2024 and 2025, much of it before the revenue returns were visible at scale. Microsoft’s and Amazon’s results, both reported on 30 July 2026, are the first time the AI infrastructure thesis has been tested against hard numbers at this magnitude. For investors positioned in these names, or weighing whether to build exposure, the stakes are concrete and immediate.
Here is a framework for reading what these results actually confirmed, what they left unresolved, and how to size your exposure to mega-cap AI infrastructure names without mistaking a strong quarter for a settled multi-year thesis.
What the earnings numbers actually confirmed this week
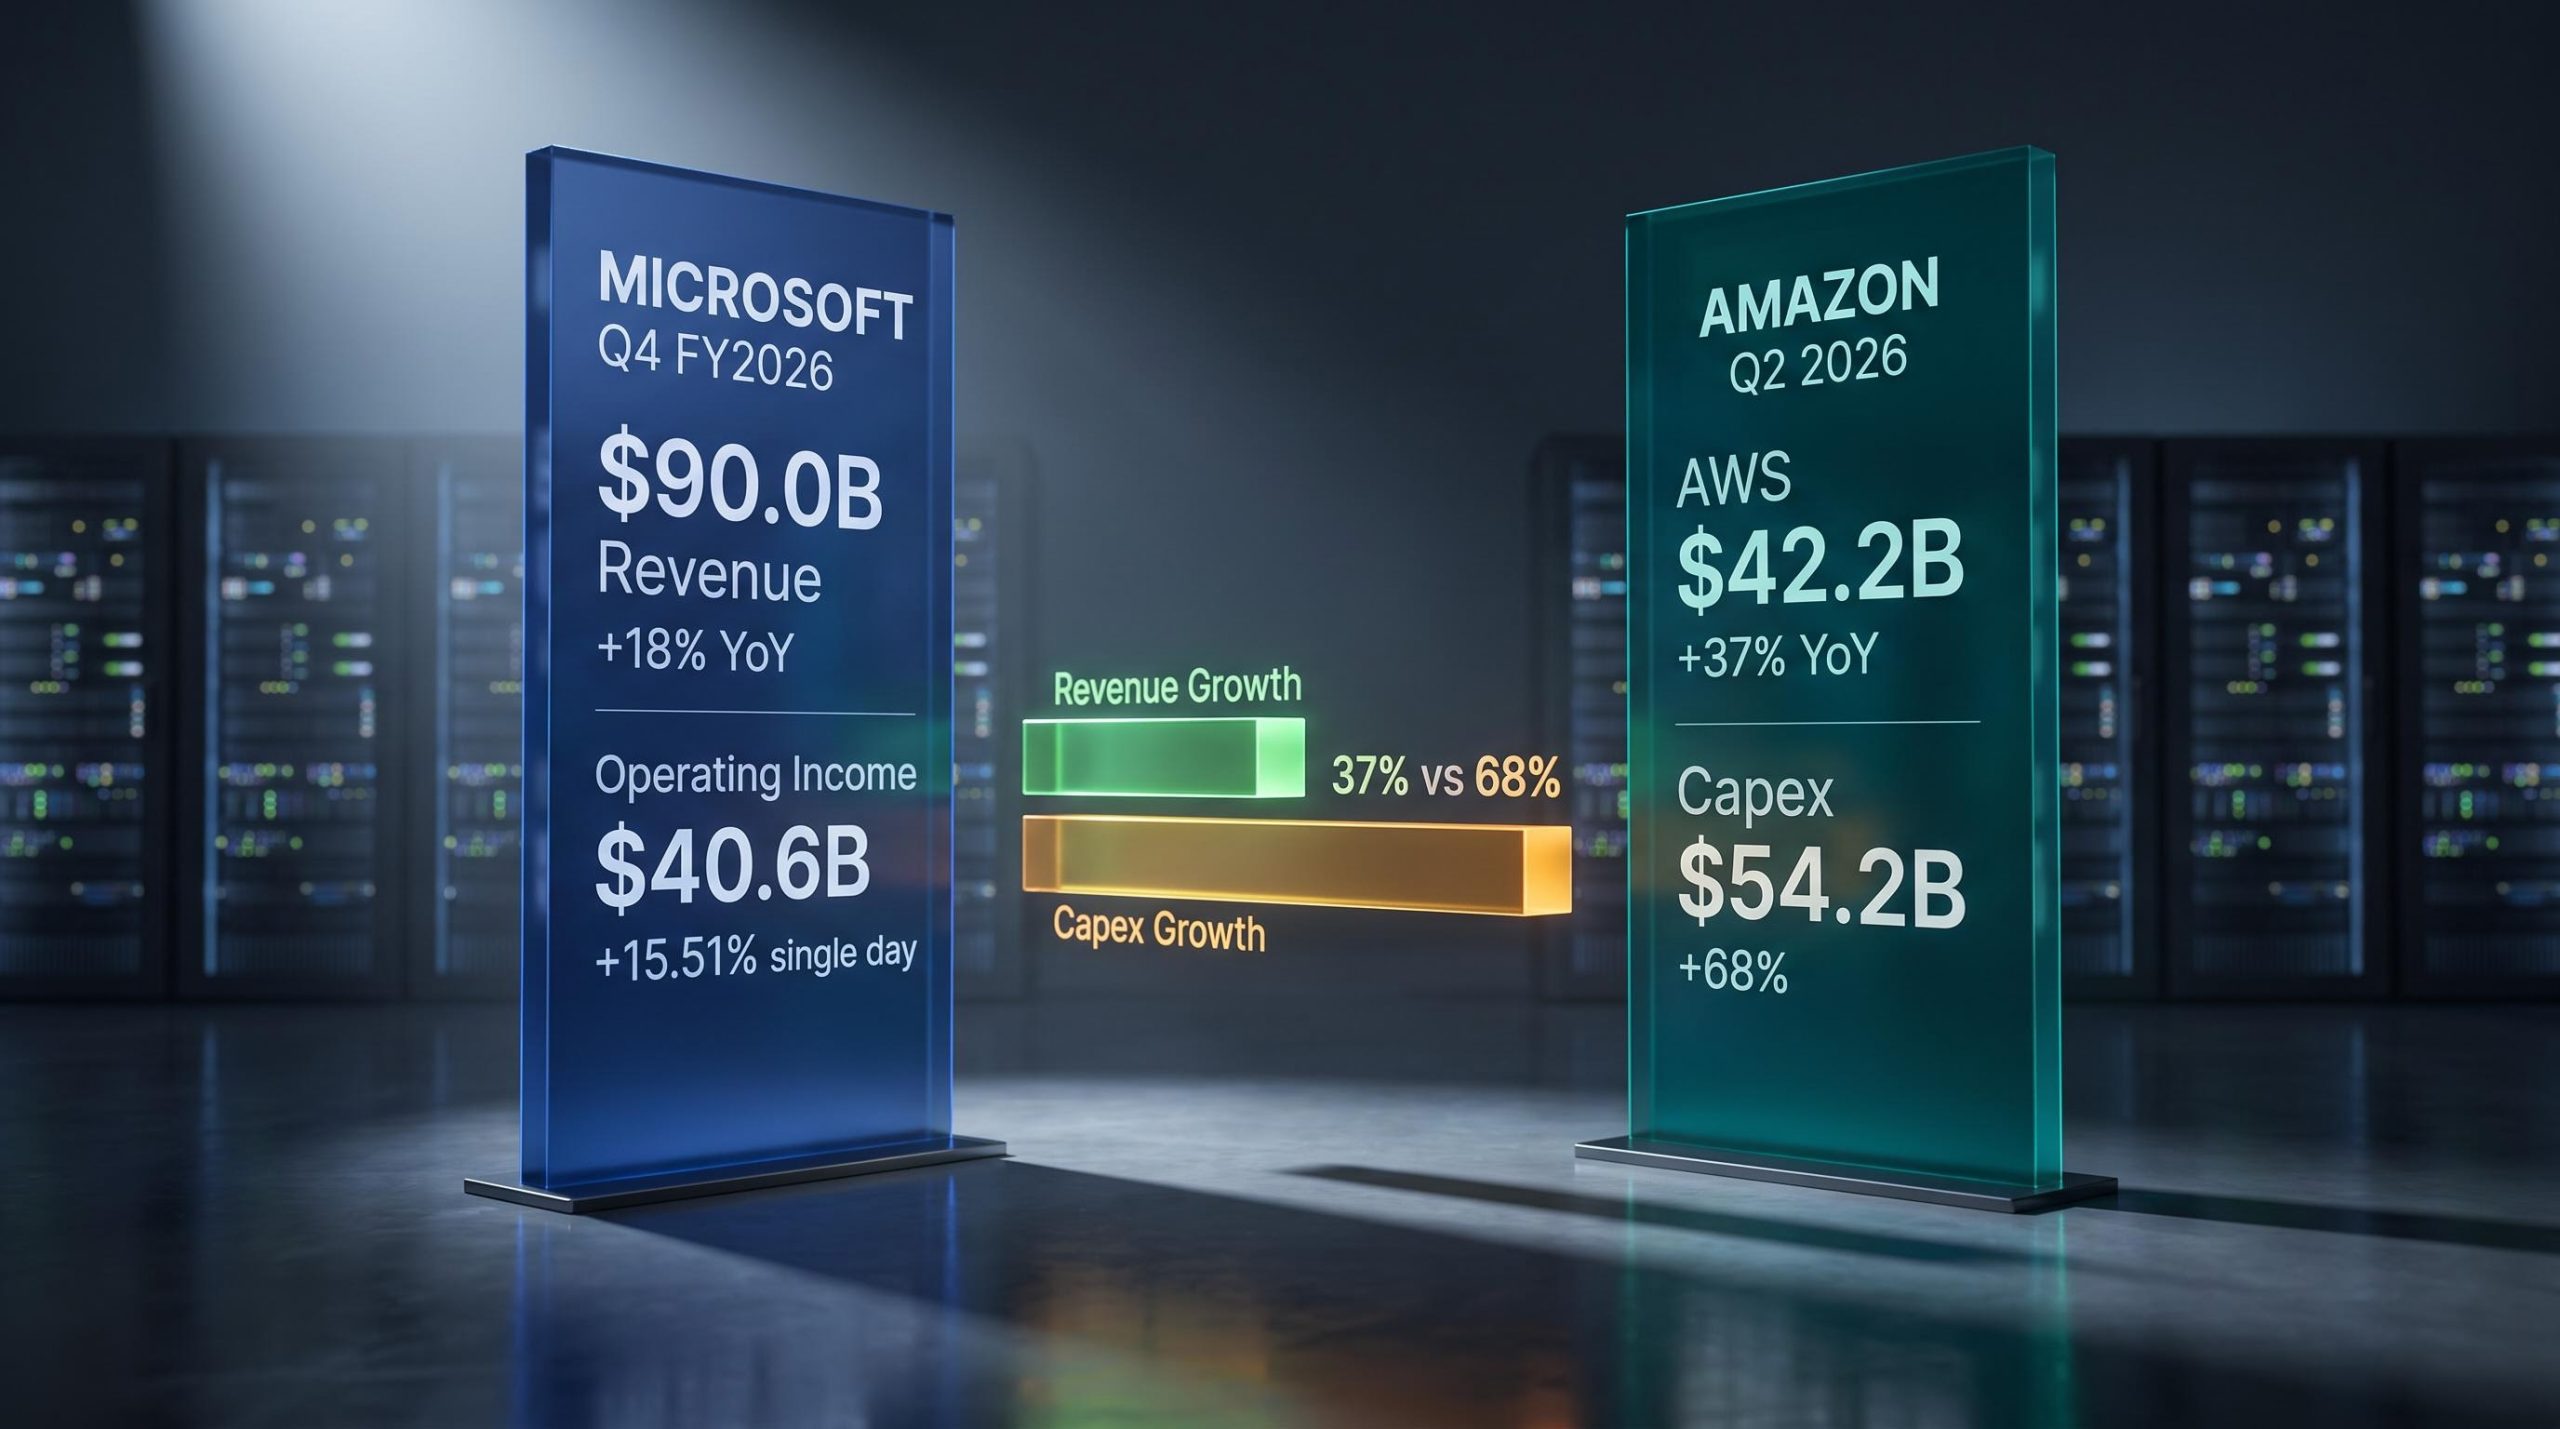
Microsoft reported $90.0 billion in quarterly revenue for Q4 FY2026, up 18% year over year (17% in constant currency), with operating income of $40.6 billion. Those are not incremental improvements. They are record-level results driven by Azure and AI workloads, the segment investors have been watching most closely as a proxy for whether AI investment is translating into durable earnings power.
Amazon delivered $200.6 billion in total revenue for Q2 2026, comfortably above Wall Street expectations of roughly $196-$197 billion. The number that carried the most analytical weight was AWS: $42.2 billion in revenue, up 37% year over year. That growth rate, at that scale, is the clearest evidence yet that AI-driven cloud demand is structural rather than cyclical.
| Company | Key Metric | Value | Period |
|---|---|---|---|
| Microsoft | Quarterly revenue | $90.0 billion (+18% YoY) | Q4 FY2026 |
| Microsoft | Operating income | $40.6 billion | Q4 FY2026 |
| Amazon | AWS revenue | $42.2 billion (+37% YoY) | Q2 2026 |
| Microsoft | Share price move | +15.51% | 30 July 2026 |
| Amazon | Share price move | +12% premarket; +3.90% on day | 31 July 2026 |
The size of those share price reactions tells you something important. A 15.51% single-day move in a company of Microsoft’s market capitalisation does not happen because a quarter was slightly better than expected. It happens because the results resolved a specific doubt: whether AI infrastructure spending would show up in earnings at all. That resolution, not just the revenue beat, is what drove the repricing.
Andy Jassy, Amazon CEO, said on the post-earnings call that AWS has the potential to reach $1 trillion in annual revenue over time, though he stopped short of attaching a specific timeline to that projection.
When big ASX news breaks, our subscribers know first
The capex paradox: spending more to earn more, but at what pace?
The revenue numbers are encouraging. The capital expenditure numbers are staggering.
The AI capex trajectory heading into Q2 2026 was already well-documented: combined hyperscaler guidance of approximately $725 billion for the full year, with debt issuance running at roughly four times the five-year average, made Amazon’s $20 billion upward revision a confirmation of an existing trend rather than a surprise inflection.
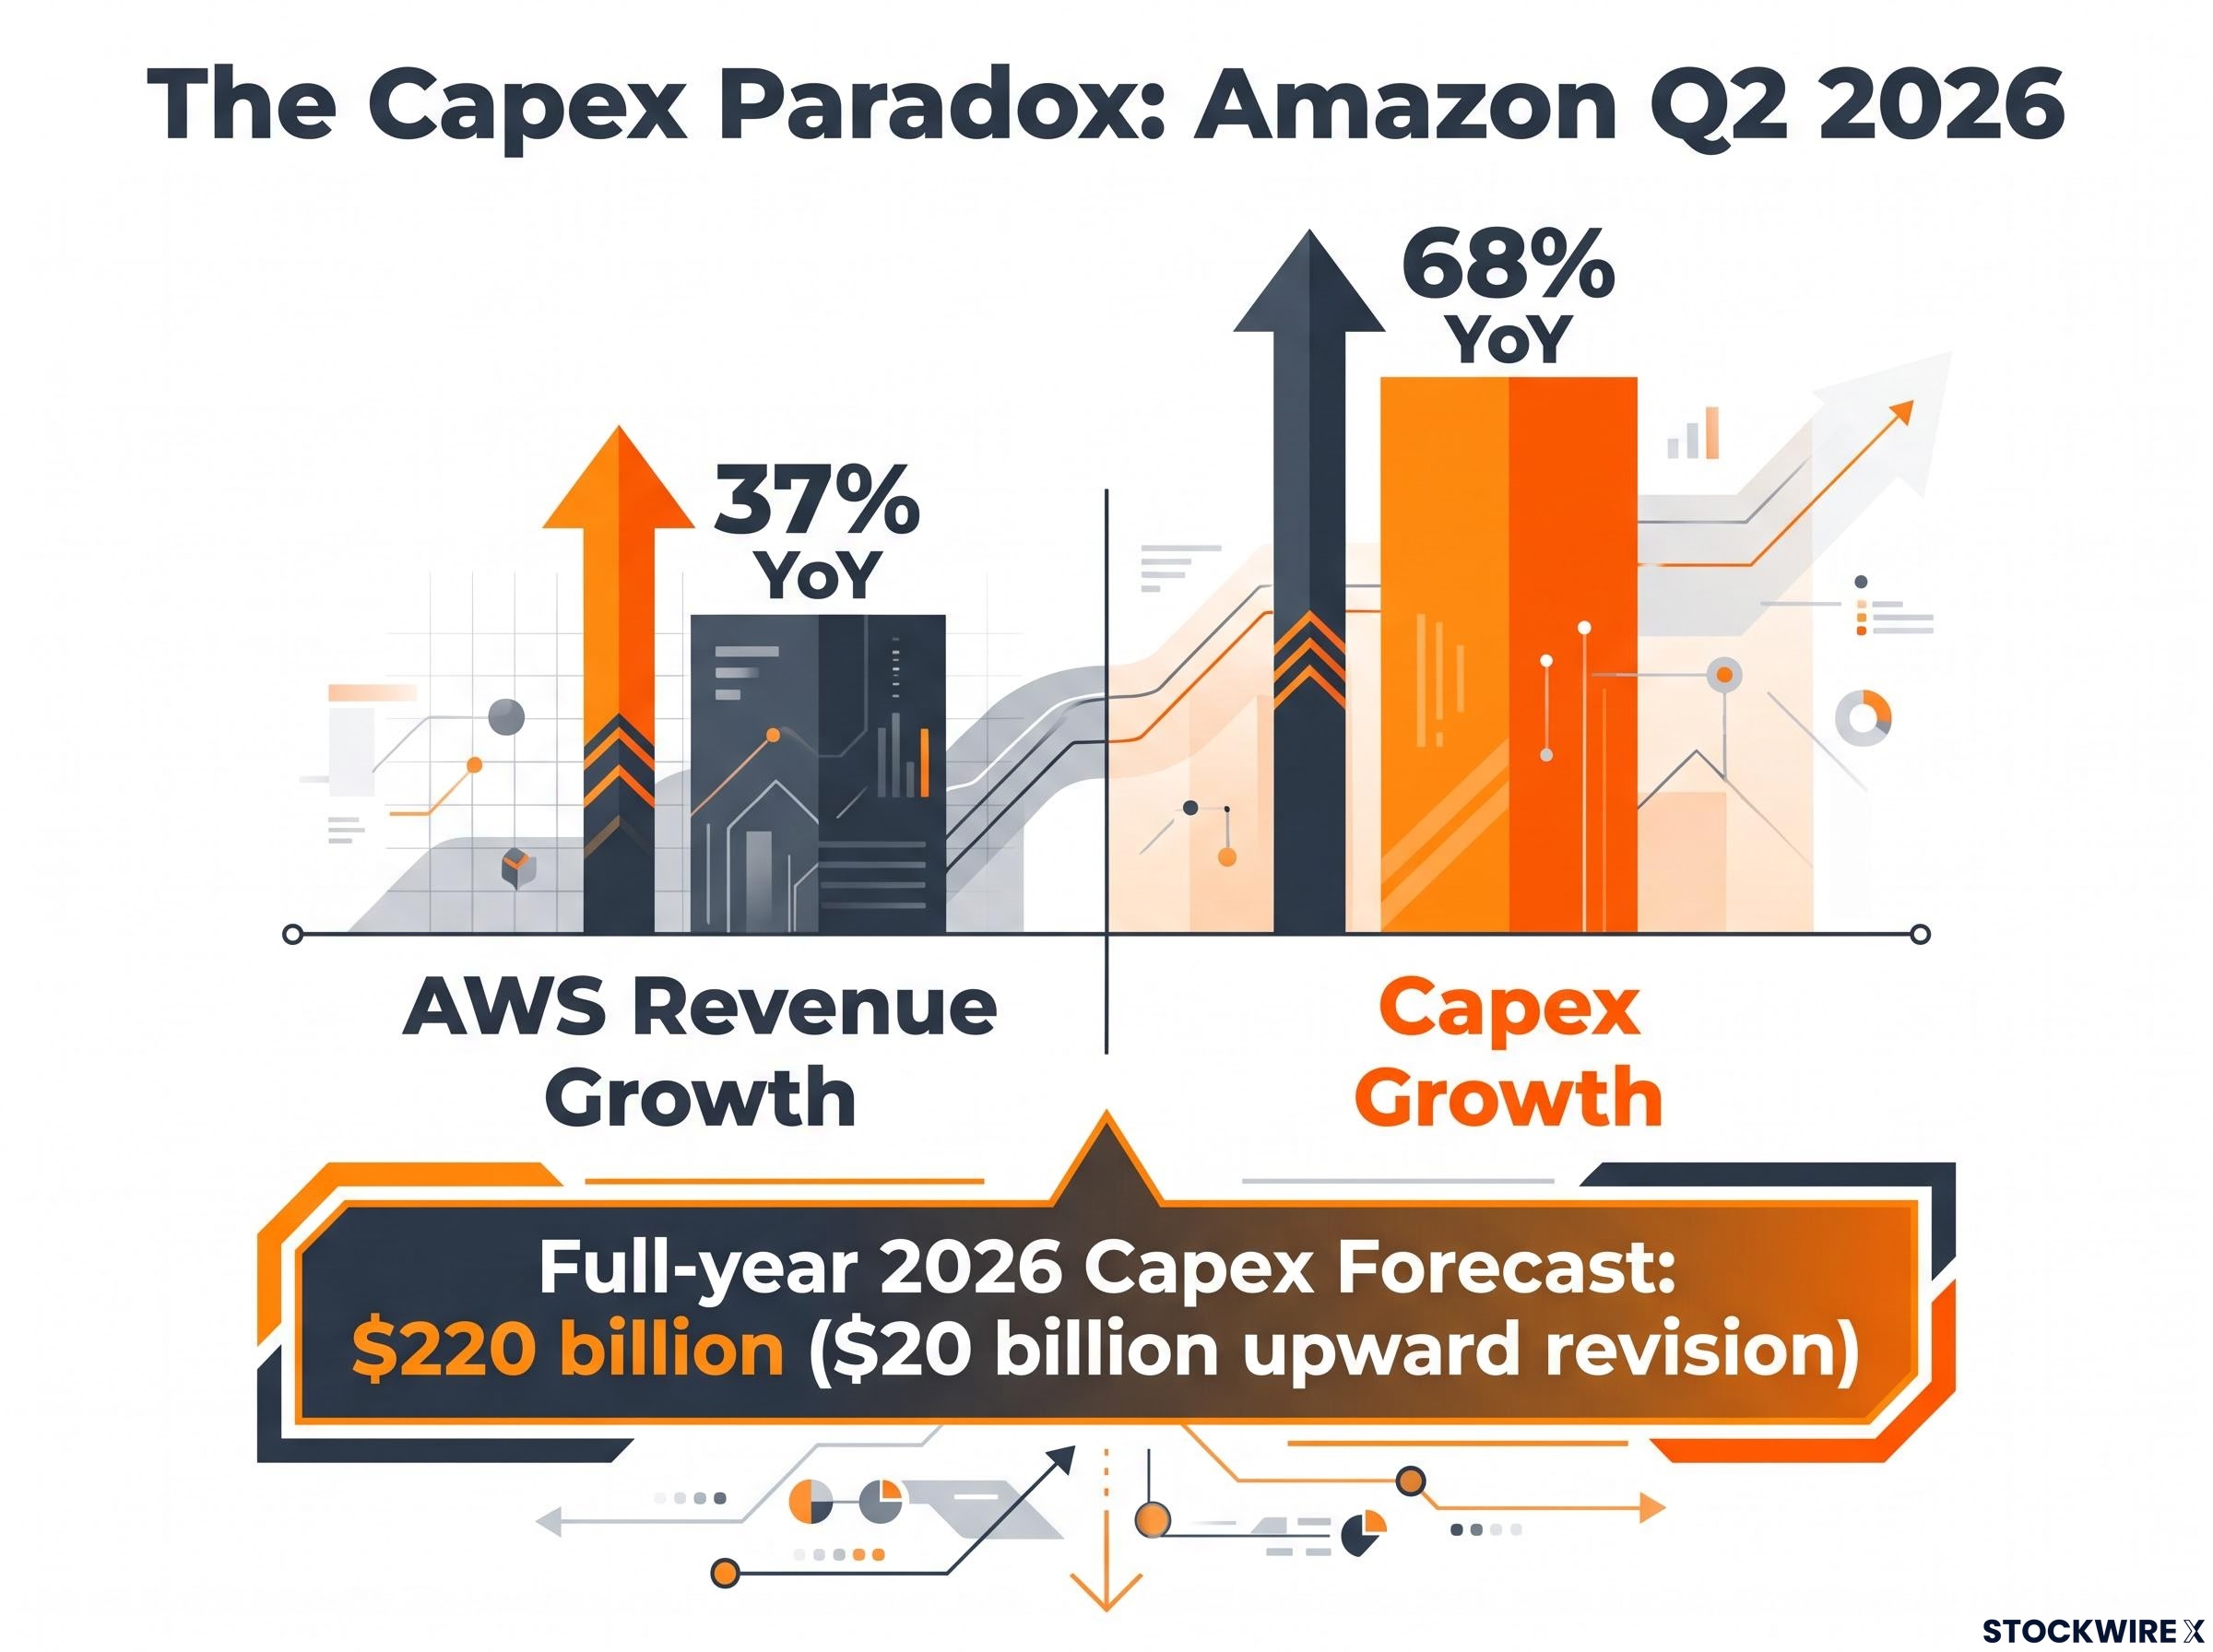
Amazon’s Q2 2026 capex reached $54.2 billion, up 68% year over year. The company raised its full-year 2026 capex forecast to $220 billion, an upward revision of $20 billion from prior guidance, explicitly tied to AI infrastructure. Higher memory chip costs were cited as a contributing factor, but the revision is fundamentally a management confidence signal: Amazon is seeing enough demand to justify spending even more than it originally planned.
Microsoft and Amazon capex compared
Microsoft’s calendar 2026 capex guidance sits at approximately $175 billion, tied to GPUs, servers, and data-centre build-out. Management’s reaffirmation of elevated spending has been widely interpreted as a signal about demand visibility, not a warning about cost overruns.
Amazon’s $20 billion upward revision to its full-year forecast carries particular weight. When management voluntarily raises capex guidance by that magnitude, it tells you they are seeing order pipelines and customer commitments that justify accelerated build-out. That is a concrete credibility signal, not aspirational commentary.
The two-sided implication of these numbers matters for how you read them:
- Demand visibility for upstream suppliers. Elevated and reaffirmed capex plans imply that demand for compute, memory, networking, power, and cooling remains multi-year in nature. This supports revenue visibility across the AI infrastructure supply chain.
- Return on capital risk. A 68% year-over-year rise in Amazon’s quarterly capex against 37% AWS revenue growth is not a warning sign right now, but it tells you the equation needs watching every quarter. If capex continues climbing while revenue growth or margins stall, the result is pressure on free cash flow and, eventually, on shareholder returns.
The current earnings suggest revenue growth is broadly validating the spending. That relationship must be monitored continuously, not assumed to hold.
How to read AI infrastructure earnings without being misled by the headline
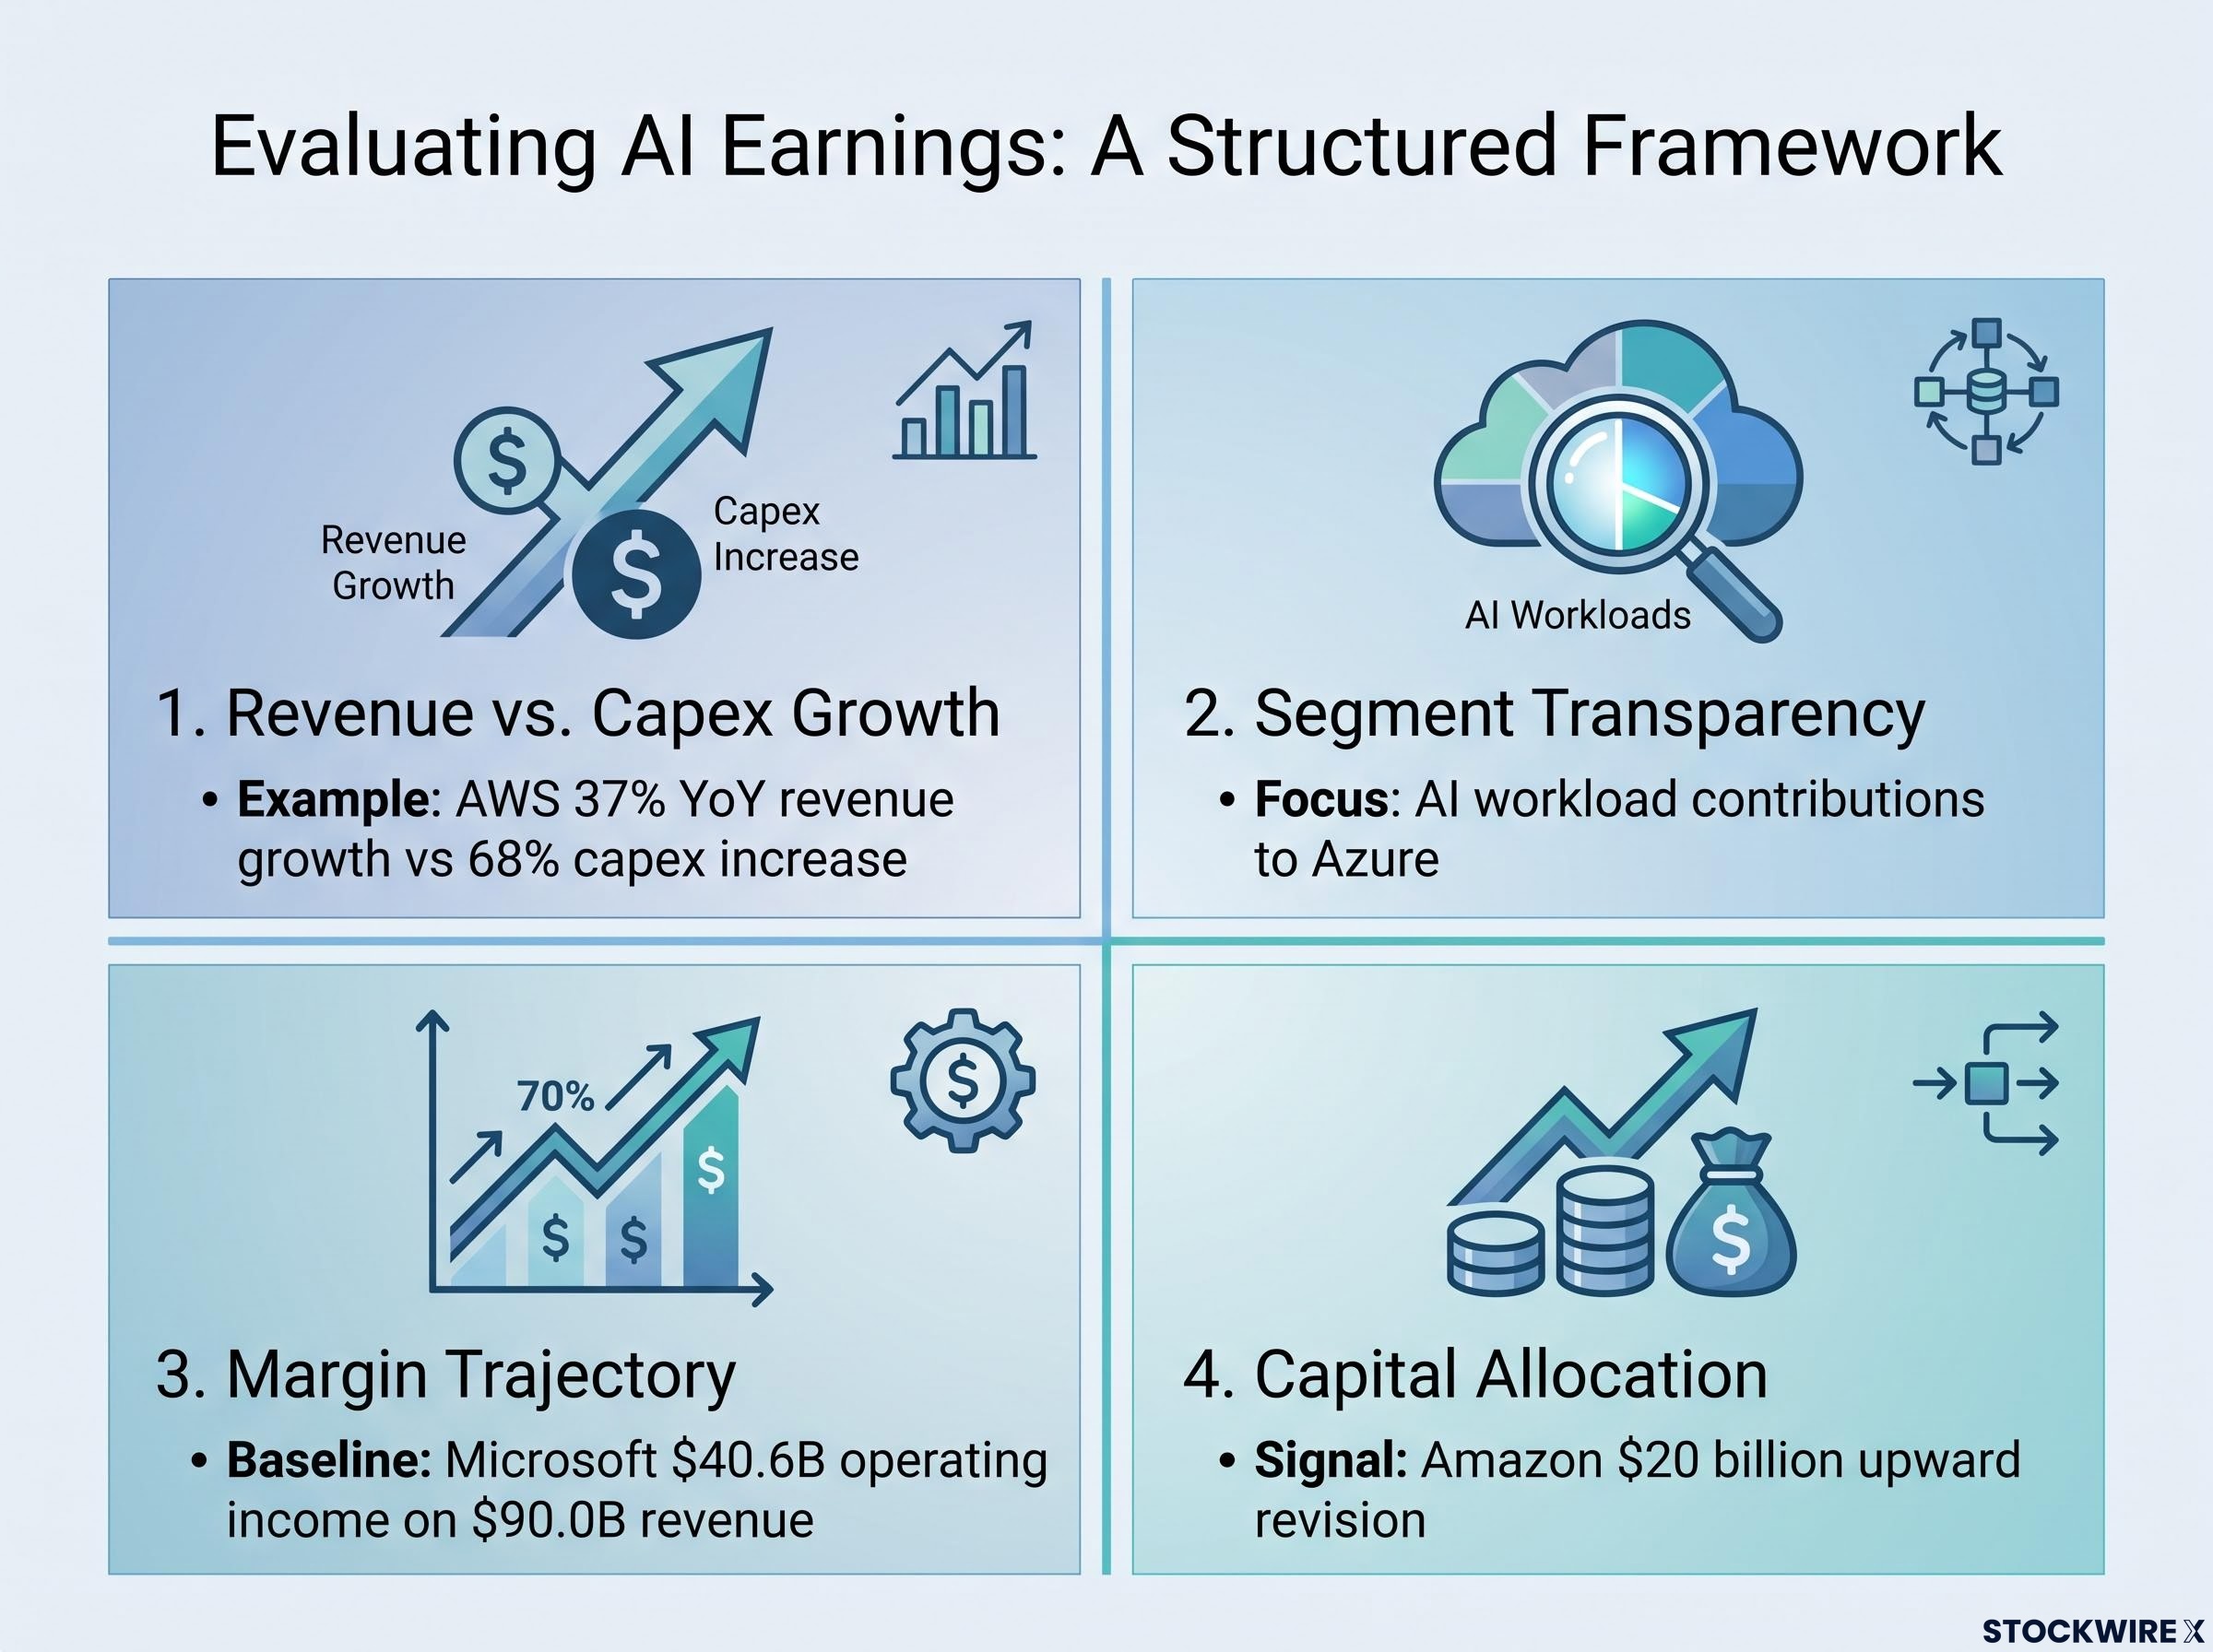
A strong revenue headline can obscure the fact that margin compression or capex acceleration is quietly eroding the investment case underneath it. Applying a structured framework across four dimensions protects against that analytical shortcut.
Benchmarking the current build-out against prior technology investment cycles matters for calibrating how much analytical weight to assign a single strong quarter: US IT spending at 4.9% of GDP in Q1 2026 has already surpassed both the dot-com peak and the cloud build-out peak, placing the current cycle in historically uncharted territory.
- Revenue growth versus capex growth. Track whether cloud and AI revenue growth is keeping pace with or exceeding capex growth over multiple quarters. AWS grew 37% year over year against a 68% capex increase. That gap is acceptable in an early build-out phase, but a persistent widening is an early warning sign.
- Segment transparency. Not all cloud revenue is AI-driven. Look for explicit management commentary on AI workload contributions to segment growth. AI services have been highlighted as contributing a meaningful share of Azure’s growth, suggesting AI is becoming a genuine revenue pillar rather than a small add-on.
- Margin trajectory. Microsoft’s operating income of $40.6 billion on $90.0 billion in revenue shows operating and net income growth in line with or above revenue growth. That means AI and cloud investments are not eroding overall profitability, at least for now.
- Capital allocation signals and management credibility. Amazon’s $20 billion upward revision is a concrete example. Interpret it as a confidence signal, but stress-test your own scenarios: what happens if demand grows more slowly than management expects?
Why segment transparency is the hardest dimension to track
Companies do not always disclose what portion of cloud platform revenue is tied specifically to AI and machine learning workloads versus traditional storage, compute, and software-as-a-service (SaaS), which refers to software delivered over the internet on a subscription basis. Increasingly detailed segment reporting will help distinguish true AI monetisation from broader cloud growth that might have occurred regardless.
Where detailed disclosure is absent, look for explicit management commentary on AI workload contributions to segment growth. That commentary serves as the best available proxy.
Concentration risk and the case for defensive tech in an AI-heavy portfolio
The optimism from this week’s earnings is warranted by the numbers. The portfolio question it creates is different.
When Microsoft and Amazon are both central to major indices and growth portfolios, AI sentiment is no longer a stock-specific risk. It is a systematic market driver. Strong earnings and positive AI narratives can produce dramatic outperformance in portfolios overweight in these names. But that concentration also increases vulnerability to three specific risk vectors:
Software sector selectivity has intensified alongside the infrastructure build-out: more than 75% of software application companies in the Morningstar US Technology Index were in negative territory year-to-date in 2026, even as infrastructure-adjacent names surged, which illustrates why broad AI exposure and targeted AI exposure produce very different portfolio outcomes.
- Demand slowdowns in cloud and AI workloads
- Regulatory or geopolitical shocks, such as semiconductor export restrictions
- Valuation mean reversion after periods of euphoria
Mark Haefele, Chief Investment Officer at UBS Global Wealth Management, issued a note stating that while he holds a positive view on the AI growth story, investors should broaden their holdings to include defensive technology stocks as a way to keep concentration risk in check.
That recommendation is not a signal to reduce AI exposure. It is a signal that the upside case is now widely understood, which means concentration risk has become the primary portfolio management question, not whether to have exposure at all.
Defensive tech companies that complement AI infrastructure positions tend to share three characteristics:
- More stable, diversified revenue streams
- Lower valuation multiples relative to hyperscaler AI names
- Less direct exposure to the AI capex cycle, while still benefiting from broader digitisation and software demand
This approach allows you to stay invested in technology while reducing reliance on a small cluster of AI infrastructure champions for portfolio performance.
What these results leave unresolved for long-term holders
A strong quarter is not a settled multi-year thesis. The distinction matters.
Confirmed versus unresolved: a quick reference
What the earnings confirmed:
- AI demand is now visible as measurable revenue growth at scale
- Elevated capex is tied to genuine data-centre and cloud infrastructure build-out
- Revenue and profit growth are, at present, broadly validating the scale of investment
What remains open:
- Long-run return profile. Whether aggregate hundreds of billions in AI capex across all hyperscalers will generate returns fully commensurate with the investment over a full cycle
- Competitive dynamics. How market share and pricing power evolve as multiple hyperscalers pursue similar build-out strategies simultaneously
- Efficiency risk. More efficient AI architectures could reduce infrastructure demand over time, altering the economics of current-generation build-out
- Macro sensitivity. Enterprise IT budgets remain tied to broader economic conditions that no single earnings report can forecast
The fact that these earnings are being read as definitive validation of the AI infrastructure thesis is itself a signal that analytical discipline matters more now than it did a quarter ago. Conviction hardening into complacency is the specific risk for long-term holders who stop testing their thesis against incoming data.
These open questions are not reasons to avoid the AI infrastructure theme. They are the specific variables that warrant ongoing monitoring through at least 2027.
For readers wanting to understand how AI-driven concentration in equity markets creates tail risks beyond individual stock positions, our full explainer on AI-driven market fragility covers model convergence, reflexivity feedback loops, and the structural asymmetry between AI’s stabilising effect in normal conditions and its amplifying effect in stress events.
Sizing your exposure when the thesis is strong but the cycle is still early
The analytical threads across this earnings season converge on a practical set of orientations for investors:
- Treat these results as a data point, not a final verdict. They strengthen the AI infrastructure thesis by showing real revenue and profit impact, but a single quarter does not confirm a multi-year return profile.
- Monitor the capex-to-revenue ratio. For each mega-cap, track whether cloud and AI revenue growth is keeping pace with capital expenditure growth. AWS growing at 37% against 68% capex growth is currently acceptable; persistent divergence is the key risk signal.
- Use segment and margin data to separate signal from noise. Microsoft’s operating income of $40.6 billion on $90.0 billion in revenue is a useful profitability baseline to track against future quarters.
- Manage concentration with defensive tech. Pair hyperscaler AI exposure with more defensive technology names, as recommended by UBS’s Mark Haefele, rather than allowing portfolios to become single-theme bets.
- Remember the time horizon. AI infrastructure plays are fundamentally multi-year investments. Short-term earnings beats help, but the thesis rests on sustained demand and healthy economics over several cycles.
Position sizing and diversification are not expressions of doubt about the AI thesis. They are the structural decisions that allow you to stay invested through the inevitable volatility of a multi-year infrastructure cycle without being forced out at the wrong moment. The capex-to-revenue ratio is the single most actionable metric to carry forward from this earnings season.
This article is for informational purposes only and should not be considered financial advice. Investors should conduct their own research and consult with financial professionals before making investment decisions. Past performance does not guarantee future results. Financial projections are subject to market conditions and various risk factors.