A company trading at $5 can be twice the size of one trading at $50. That single fact trips up a surprising number of investors, and it explains why share price alone tells you almost nothing useful about a company’s scale, stability, or where it sits in a portfolio.
Market capitalisation is the number that actually measures company size on the ASX. It is also the framework that divides the market into large, mid, and small cap tiers, the same tiers that shape how professional investors construct portfolios. Understanding them means understanding why your ASX 200 index fund behaves the way it does, why small caps can double or halve in months, and what role each tier plays in balancing growth against stability.
Here is how market cap is calculated, what each ASX tier looks like in practice, and how to use this framework when you are building or reviewing a diversified Australian share portfolio. This is the lens that turns a list of holdings into a deliberate allocation.
Why market cap is the right measure of company size (and share price is not)
The most common mistake retail investors make when sizing up a company is looking at the share price. A $50 stock feels big. A $5 stock feels small. The maths says otherwise.
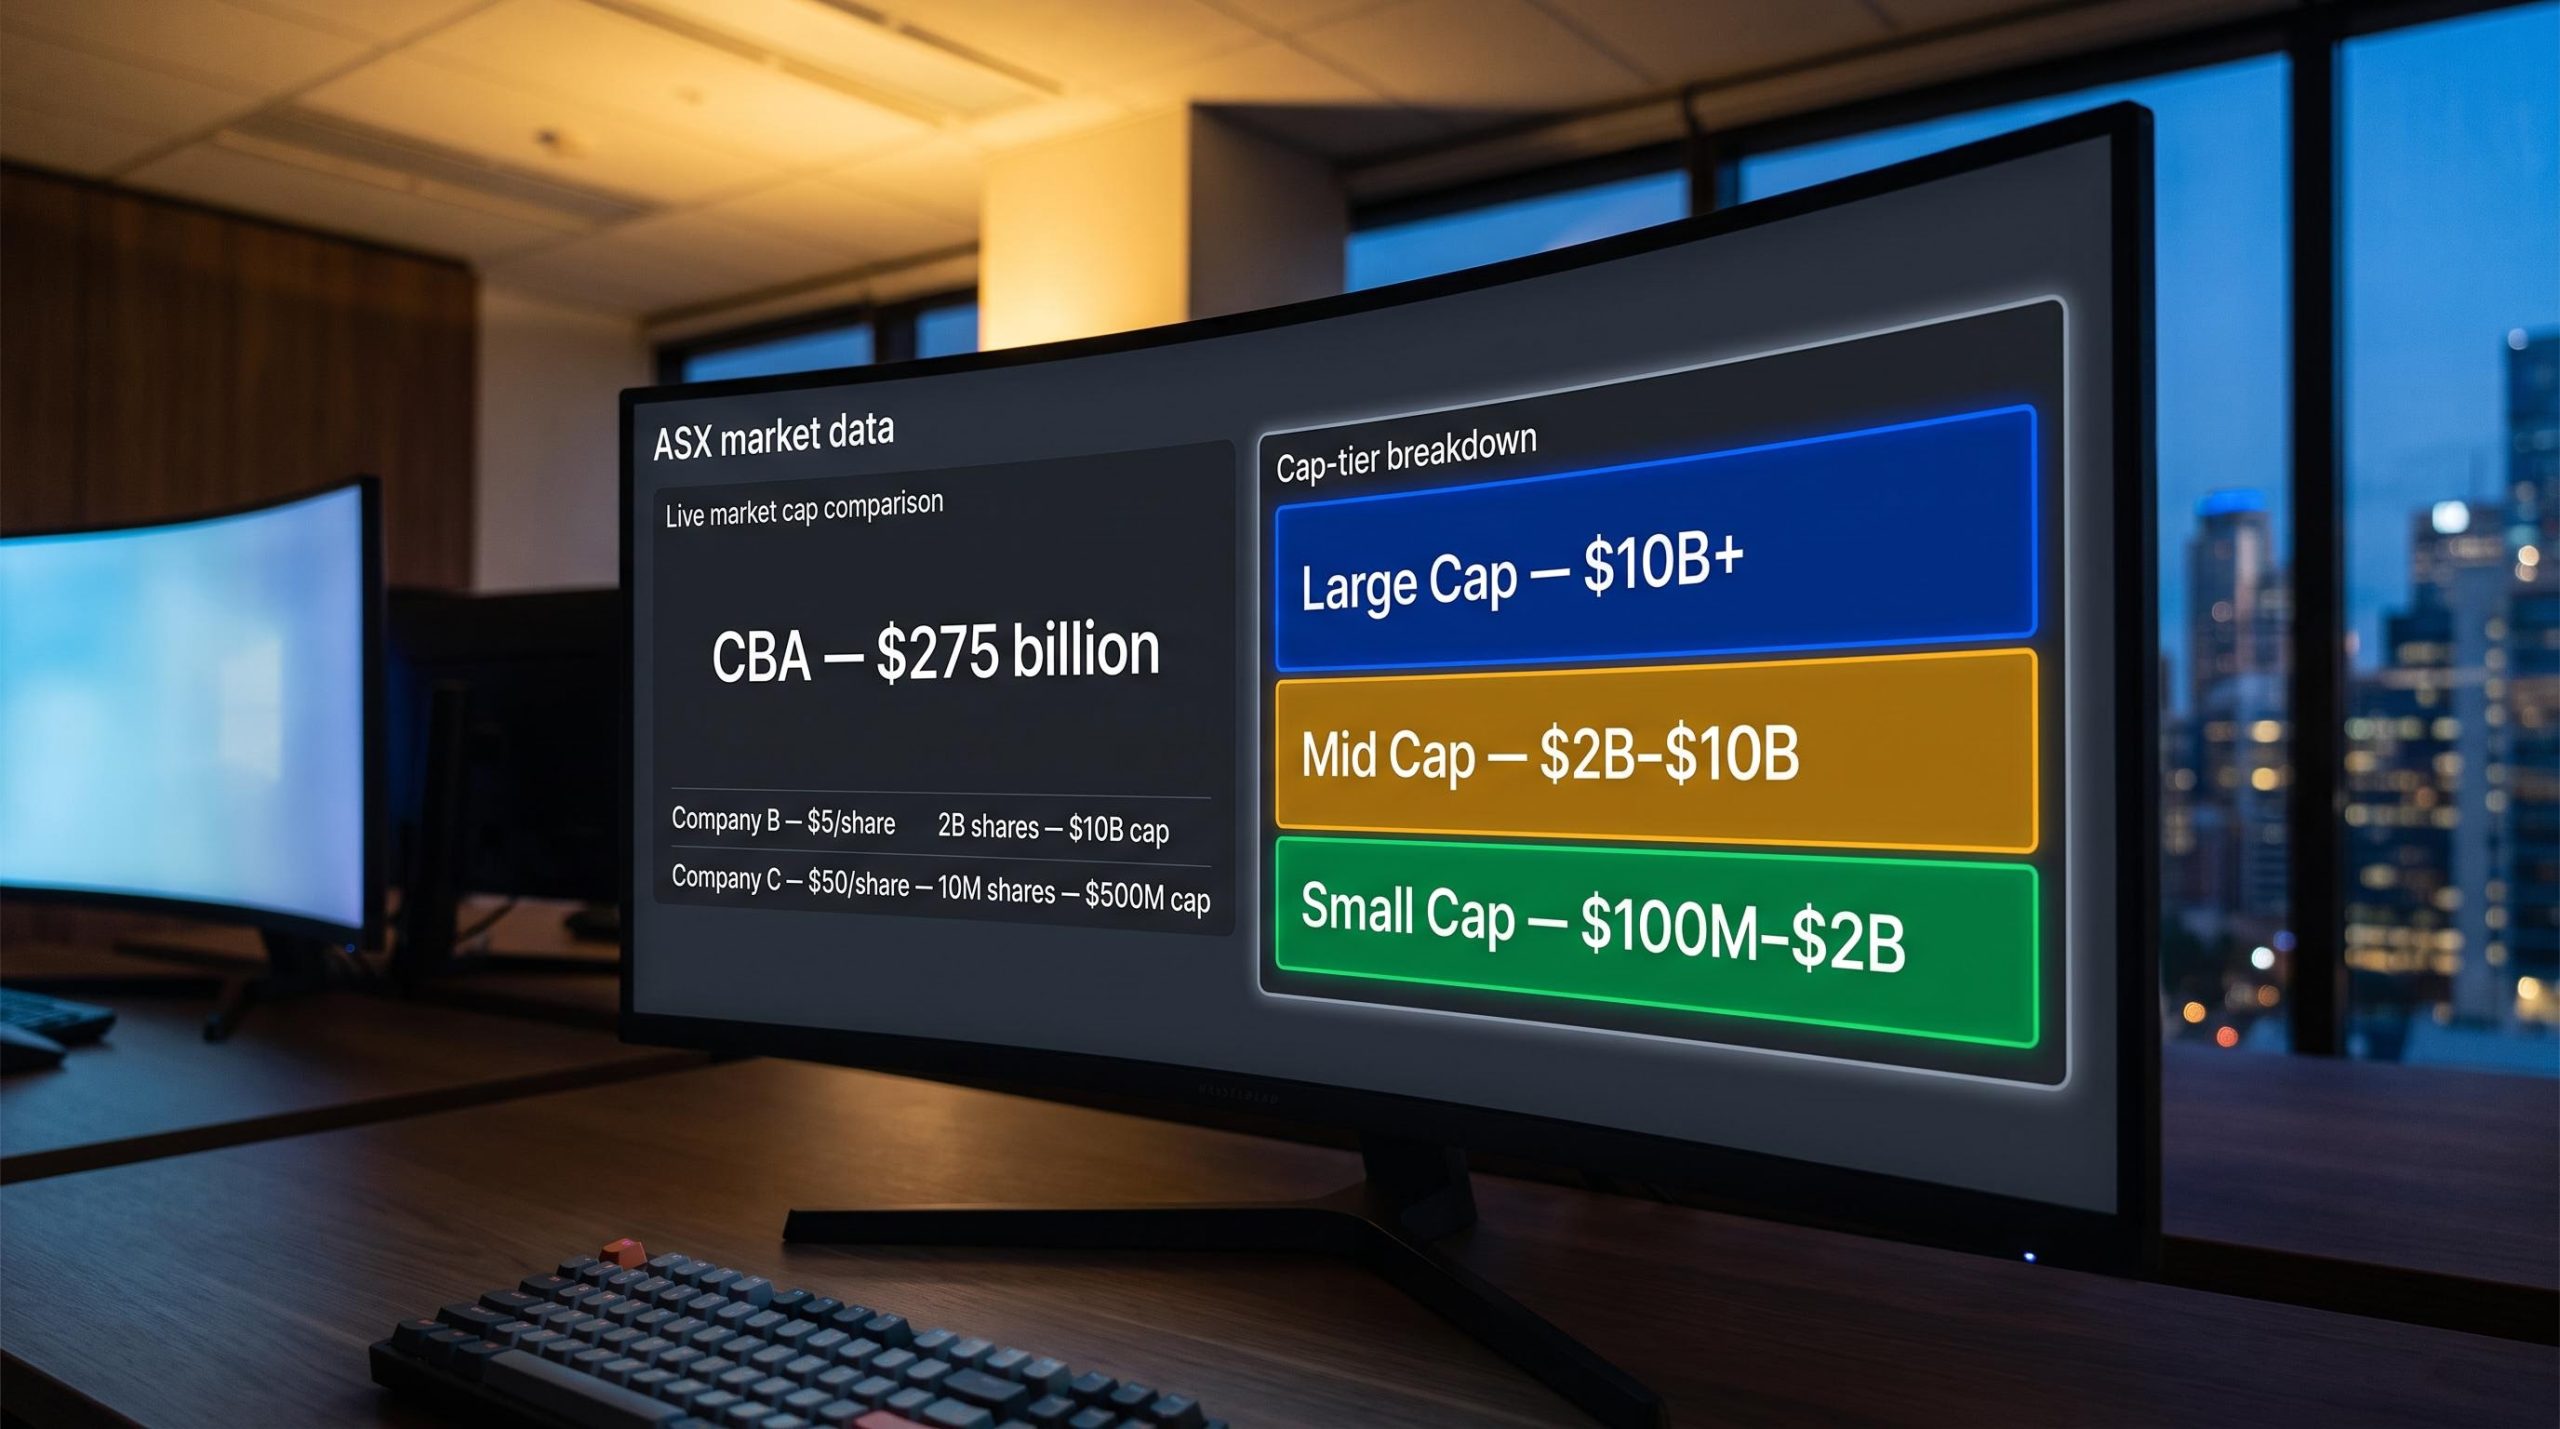
Market capitalisation equals the current share price multiplied by the total number of shares outstanding. That second variable, shares outstanding, is what makes share price alone meaningless as a size measure. Three quick examples make this concrete.
| Company | Share Price | Shares Outstanding | Market Cap |
|---|---|---|---|
| Company A | $20 | 500 million | $10 billion |
| Company B | $5 | 2 billion | $10 billion |
| Company C | $50 | 10 million | $500 million |
Company B, at $5 a share, is the same size as Company A at $20. Company C, despite its $50 price tag, is twenty times smaller than both. If you screen for “cheap” stocks based on a low share price, you are selecting on a measure that has no relationship to company size, risk tier, or portfolio role.
One more detail worth noting: when a company raises capital by issuing new shares, its market cap grows even when the share price itself stays flat. The price investors collectively assign to a company’s total equity at any point in time is what market cap captures. It is a live sentiment measure, not an independently verified valuation. When analysts want a more grounded sense of what a business is worth, they turn to enterprise value, which layers in net debt to produce a figure closer to what an acquirer would actually pay.
When big ASX news breaks, our subscribers know first
How the ASX divides into large, mid, and small cap tiers
Once you understand the formula, the next step is seeing how the ASX uses market cap to sort its roughly 2,000 listed companies into size tiers.
No fixed dollar threshold officially defines where one cap tier ends and the next begins. Rather than publishing hard cutoffs, S&P Dow Jones Indices, which administers the major ASX indices, sorts companies by their relative size ranking within each index. The dollar ranges below are working conventions that practitioners use across the industry, and they drift over time as companies grow, contract, issue new shares, or migrate between indices at periodic rebalances.
ASX index inclusion is governed by S&P Dow Jones Indices rather than the ASX itself, and the free float minimum rises from 20% for listing eligibility to 30% for ASX 200 qualification, a distinction that matters when tracking how companies migrate between cap tiers at each quarterly rebalance.
| Tier | Approximate Market Cap Range (AUD) | Key Index Benchmark | Typical Characteristics |
|---|---|---|---|
| Large cap | $10 billion and above | S&P/ASX 50, S&P/ASX 100 | High liquidity, consistent dividends, lower relative volatility |
| Mid cap | $2 billion to $10 billion | S&P/ASX 100 to S&P/ASX 200 | Growth-stability blend, moderate liquidity, less predictable earnings |
| Small cap | $100 million to $2 billion | S&P/ASX Small Ordinaries | Higher volatility, lower analyst coverage, growth upside |
| Micro cap | $50 million to $300 million | No major benchmark | Very thin liquidity, limited institutional interest |
| Nano cap | Below $50 million | No major benchmark | Highly speculative, extremely thinly traded |
By company count, the small cap tier and the tiers below it contain the vast majority of ASX listings. Yet the ASX 200, covering only 200 of those 2,000 companies, represents roughly 80% of total ASX market capitalisation. The implication is significant: the tiers outside the large-cap segment hold most of the market’s companies but attract far less index coverage, analyst scrutiny, and institutional trading activity than the top of the market where passive ETF capital tends to concentrate.
What each tier actually looks like as an investment
Definitions and dollar ranges only take you so far. To use cap tiers as a portfolio tool, you need to understand how each one behaves as an investment.
Large caps
Commonwealth Bank of Australia (ASX: CBA), sitting at a market cap of around $275 billion in mid-2026, stands as the most prominent example. Alongside BHP, the major banks, and Telstra, large caps anchor the ASX.
- Lower relative volatility compared to smaller tiers, though large caps can still fall sharply in adverse conditions
- More consistent dividends, often fully franked, making them a primary source of income for Australian investors
- Widely followed by analysts and institutions, which supports higher daily trading volumes and narrower bid-ask spreads
- ASX 200 index funds carry heavy concentrations in large-cap names, with financials and materials dominating the sector mix
Mid caps
HUB24 (ASX: HUB), a wealth platform business with a market cap of around $6.6 billion in mid-2026, is a solid illustration of this tier.
- Companies at this level have generally moved beyond the most precarious early-stage risks, with a track record and customer base already established
- Continued growth ambitions, whether through geographic expansion, new product lines, or bolt-on deals, mean earnings tend to be choppier than in the large-cap segment
- Dividends are present but less consistent and generally smaller than in the large-cap segment
- A middle path between the two extremes: more resilience than the smallest names, but more growth runway than the mature giants sitting above them
Small caps
Integral Diagnostics (ASX: IDX), which carried a market cap of around $840 million in April 2026, offers a useful illustration of this segment. The S&P/ASX Small Ordinaries, which tracks ASX 300 members outside the top 100 by size, serves as the recognised index for this space.
- Higher volatility and wider bid-ask spreads, with lower daily trading volumes
- Less analyst coverage means less information is publicly available, and price can move sharply on relatively small order flow
- Many small caps do not pay regular dividends, reinvesting cash into growth instead
- Significant growth upside for successful companies, precisely because they start from a lower base
The liquidity point for small caps is not a minor technicality. It means your ability to exit a position quickly without moving the price against yourself is materially lower than in large caps. That is a form of risk that does not appear in a returns chart.
Small cap liquidity risk is frequently misread as a signal of fundamental business deterioration, when professional managers across Fairlight, Spheria, and Wilson Asset Management documented drawdowns of 30% or more in 2024 on holdings where the underlying business quality had not changed at all.
Building a cap-diversified ASX portfolio
Understanding each tier individually is one thing. The more useful question is how they work together.
If you hold a single ASX 200 index fund and consider yourself diversified, you are diversified by company count but not by cap tier or sector. The ASX 200 is market-cap weighted, and its construction means that a small number of very large companies, concentrated in financials and resources, drive the bulk of index returns. Those top 200 companies represent roughly 80% of total ASX market capitalisation, so when banks and miners fall out of favour together, the apparent diversification of a broad Australian shares fund can quickly evaporate.
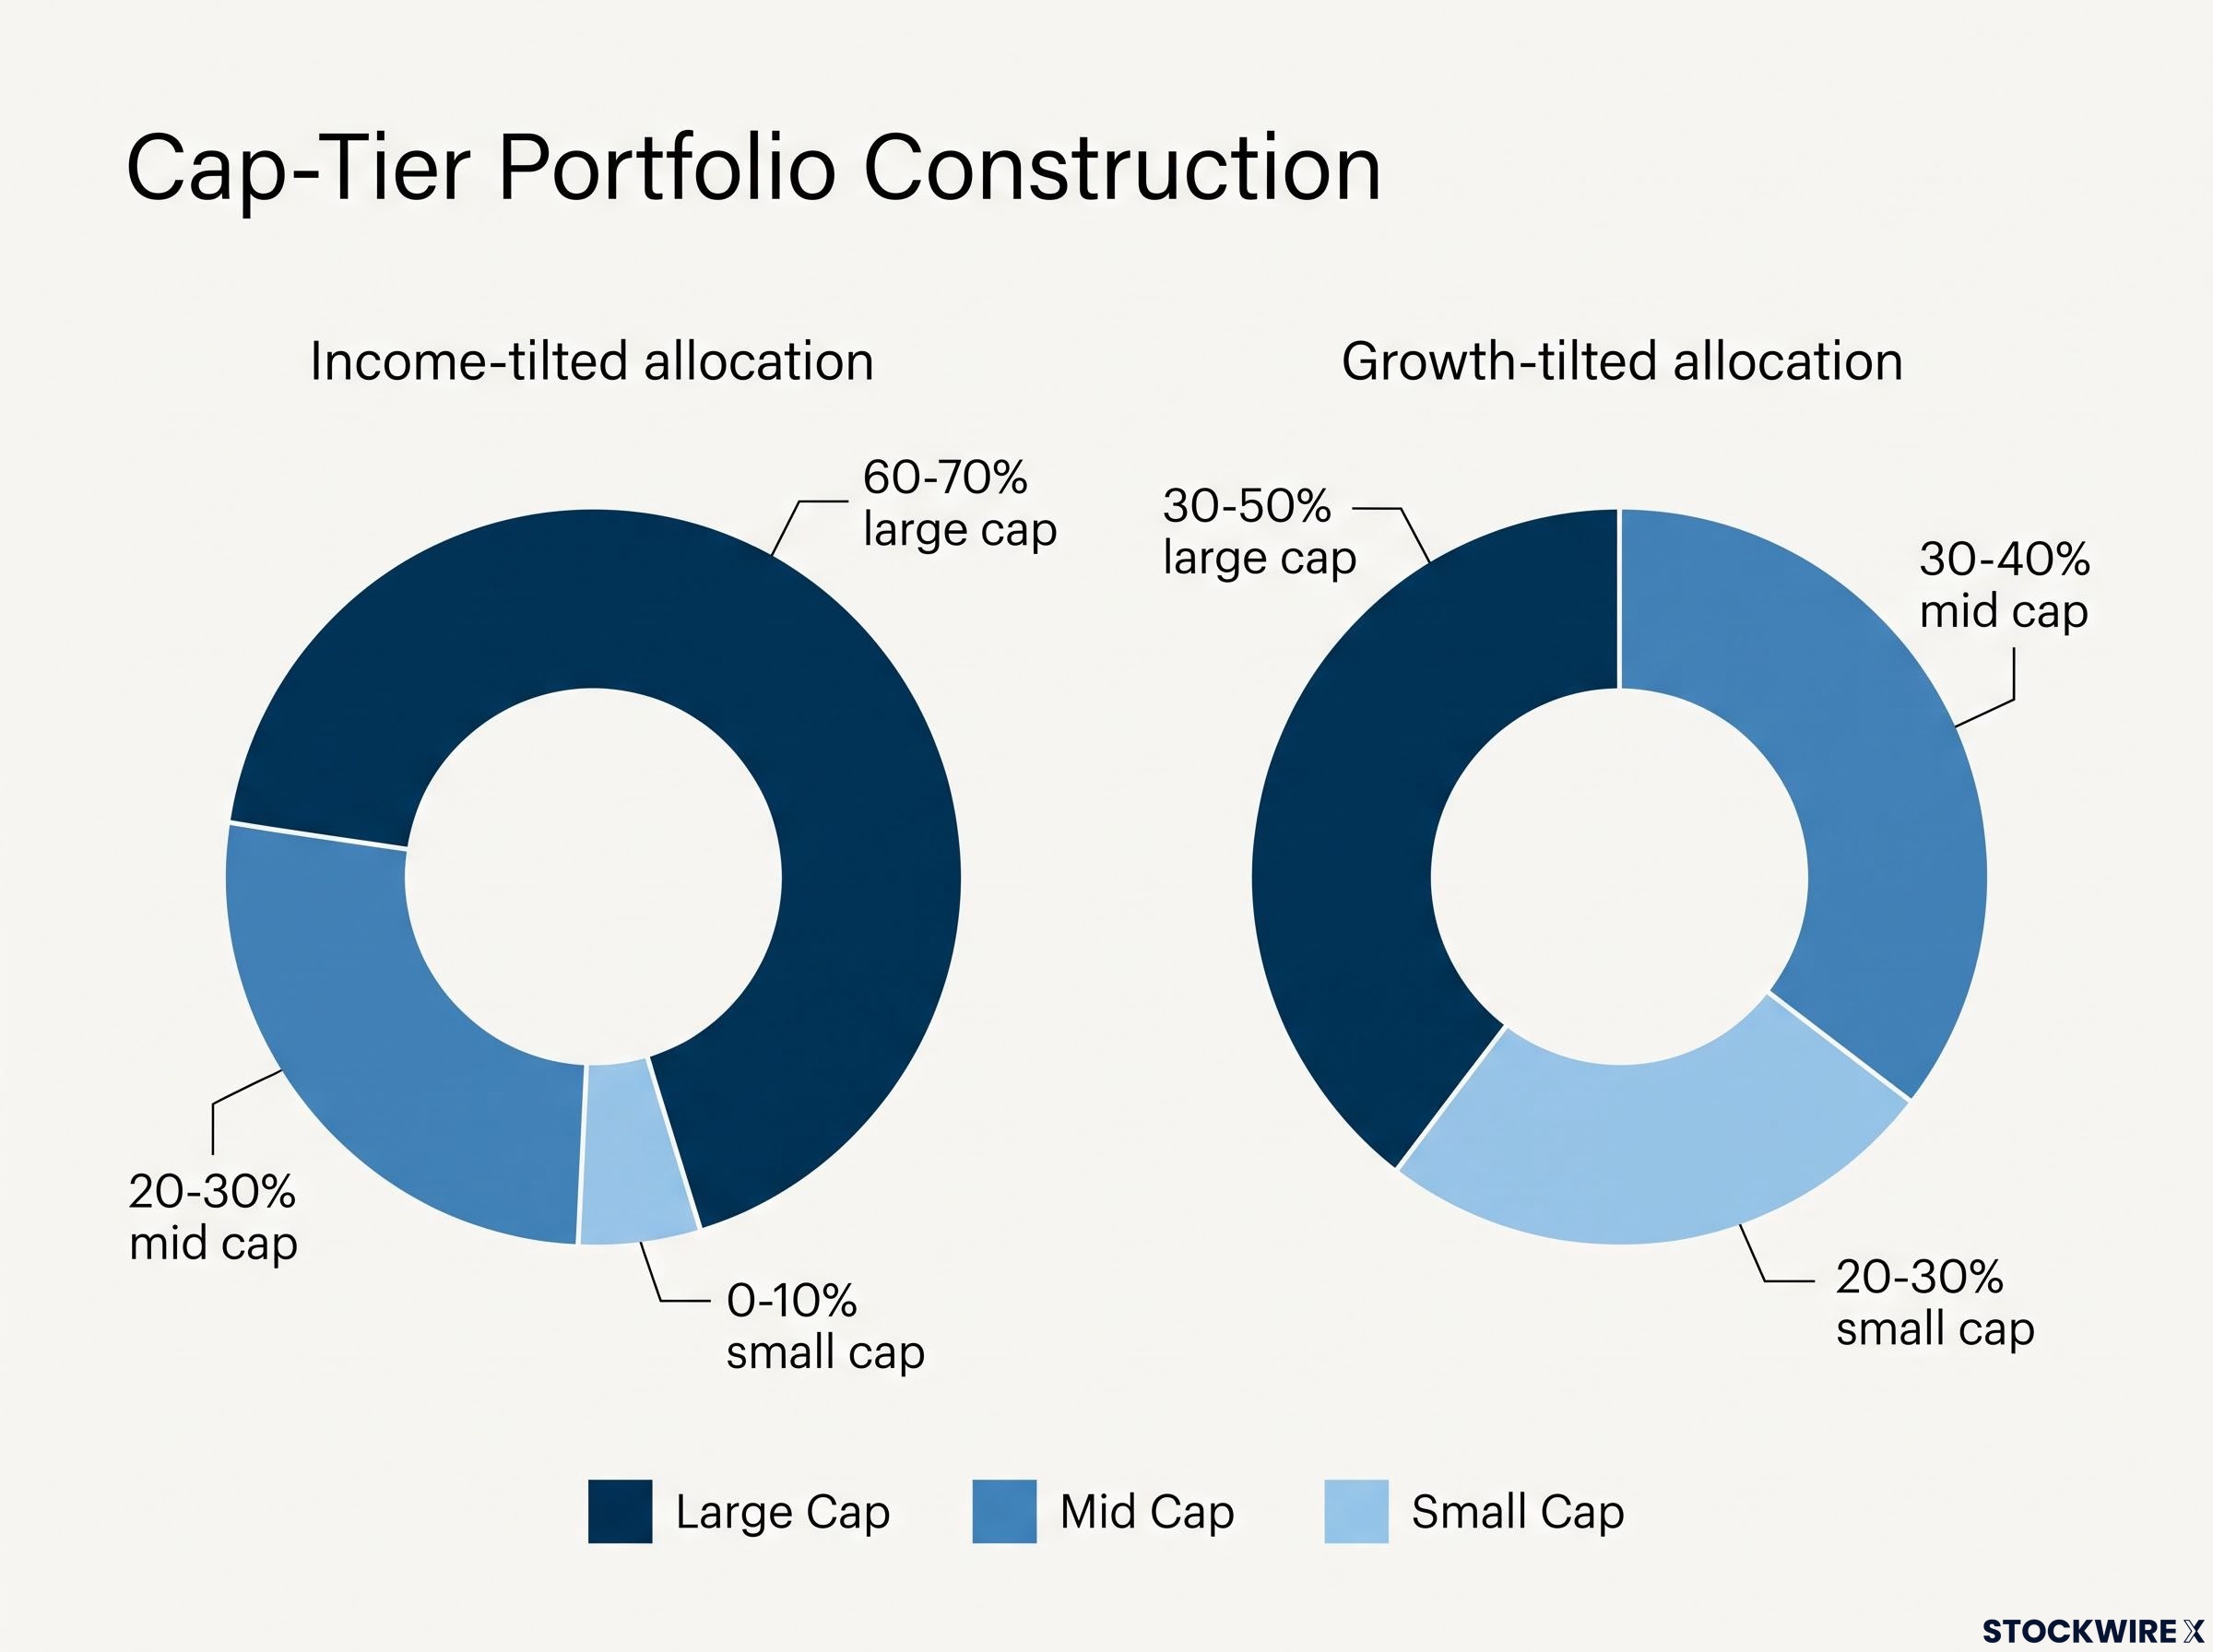
Cap-tier diversification is a deliberate portfolio construction choice, not a natural outcome of buying more stocks. Two illustrative frameworks show how the mix changes depending on your objectives.
Cap-weighted concentration is more extreme than the company count implies: the top 10 stocks in the ASX 200 accounted for 48.6% of the index as of May 2026, meaning a standard domestic ETF places nearly half of your local equity exposure into a handful of banks and miners before you have made a single active decision.
Income-tilted allocation: 60-70% large cap, 20-30% mid cap, 0-10% small cap.
Growth-tilted allocation: 30-50% large cap, 30-40% mid cap, 20-30% small cap.
These are general examples for thinking through trade-offs, not personal financial advice. The right mix depends on your time horizon, income needs, and tolerance for volatility.
Three questions to apply to your own holdings right now:
- What is your current cap-tier mix across all Australian share holdings?
- Does that mix match your investment objectives, time horizon, and risk tolerance?
- Are you overexposed to a single tier, particularly through the concentration risk embedded in broad Australian share funds via financials and materials?
If you cannot answer the first question, that itself is a finding worth acting on.
How ETFs make cap-tier investing accessible
The previous section raises an obvious practical question: how do you actually get exposure to each tier without researching hundreds of individual companies?
Exchange-traded funds (ETFs) tracking specific ASX indices provide basket exposure to each cap tier in a single trade. Each major index corresponds to a slice of the market, and understanding the index architecture tells you exactly which slice any given ETF covers.
| Index | Companies Covered | Cap Tier Relevance | Key Use Case |
|---|---|---|---|
| S&P/ASX 200 | Top 200 by float-adjusted market cap | Large and upper mid cap | Core Australian equity exposure; approximately 80% of total ASX market cap |
| S&P/ASX Small Ordinaries | Members of the ASX 300 that fall outside the ASX 100 | Small and mid cap benchmark | Targeted exposure to the smaller end of the market |
| All Ordinaries | Approximately top 500 companies | Broader market coverage | Estimated 80-90% of total ASX market cap (unverified estimate) |
All major ASX indices are free-float, market-cap weighted and periodically rebalanced. That rebalancing has practical consequences for how your portfolio evolves: as a company’s market cap climbs from small cap territory into the mid cap range, it will eventually migrate into different index products. An ETF tracking the Small Ordinaries will drop that company from its holdings once it outgrows the index, while an ASX 200 fund will pick it up once it qualifies. Passive investing is not quite as passive as it sounds.
One important caveat: index methodology, fees, and holdings differ across ETF providers even when the index labels sound similar. Always read the product disclosure statement before investing to understand exactly what you are buying.
ETF portfolio structure choices, particularly the split between domestic and international funds and the number of funds held, affect fee drag, tax administration complexity, and how easy it is to maintain your target cap-tier allocation during periods of market volatility.
This article is for informational purposes only and should not be considered financial advice. Investors should conduct their own research and consult with financial professionals before making investment decisions.
Putting cap tiers to work in your Australian share portfolio
Market capitalisation is not just a data point you glance at on a stock screener. It is a portfolio construction lens. Once you understand it, you can deliberately balance stability, income, and growth rather than defaulting to whatever the market-cap-weighted index happens to hold.
The right cap-tier mix is personal. It depends on your time horizon, your income needs, and how much volatility you can genuinely tolerate, not in theory, but in practice when your portfolio drops 15% in a quarter.
Your next step is straightforward: review your current holdings and identify your actual cap-tier exposure. Is it intentional, or is it a side effect of whichever fund you happened to buy first? That single question is where most investors discover the gap between the portfolio they think they have and the one they actually own.
—