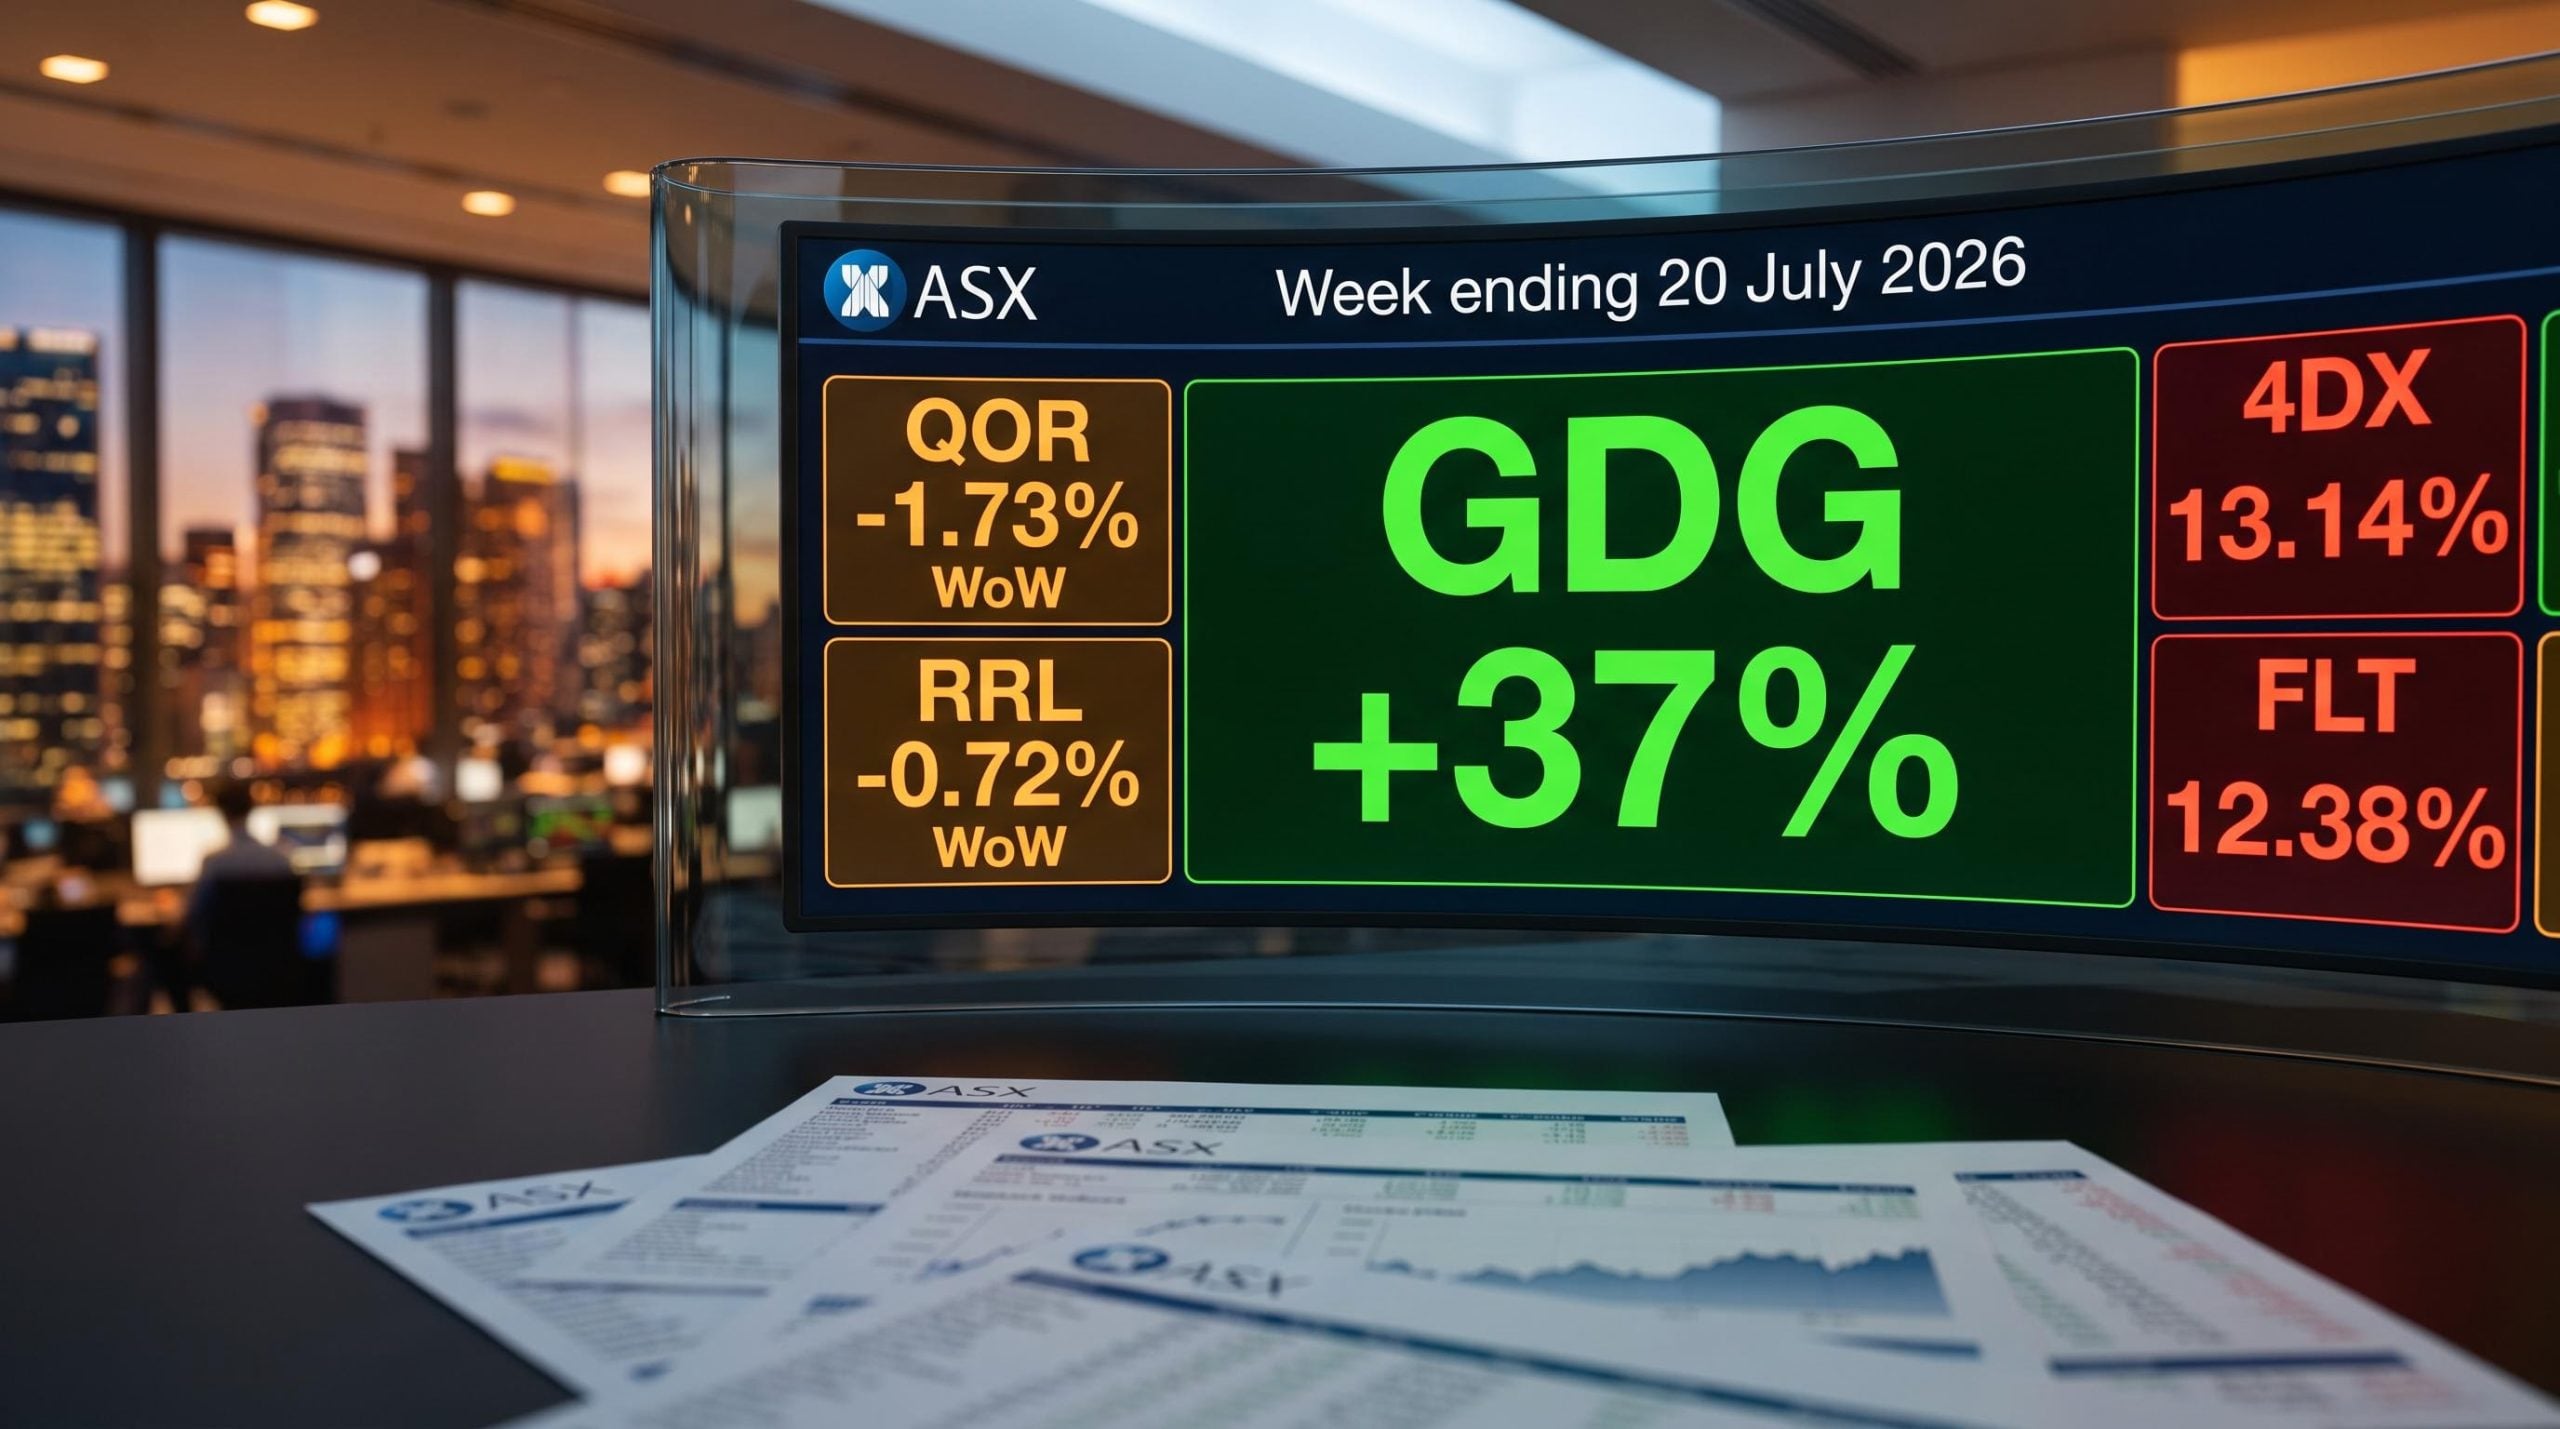
Short interest data published in a routine ASIC report can, in the right week, reveal a completed merger, a botched guidance call, and the early signs of a potential short squeeze all at once. The week ending 20 July 2026 delivered exactly that kind of snapshot.
Three very different corporate catalysts produced three structurally distinct short-covering events in the same reporting period. A merger forced mandatory position closures. A guidance miss triggered profit-taking by bears who had already been paid. A funds-under-management surprise sent a heavily shorted stock up 37% in a single session. Alongside those, a cluster of rising short positions in gold juniors and biotech names pointed to where institutional capital is building fresh conviction against specific companies.
Here is what the data actually tells you about how professional investors responded to each event, what distinguishes a structural short decline from a sentiment-driven one, and what to watch for when the next ASIC release lands. The goal is a diagnostic lens you can reuse, not just a list of numbers.
How short selling works on the ASX (and why the data is worth reading)
Short selling is the process of borrowing shares, selling them on market, then buying them back later to return to the lender. If the price falls in between, the short seller keeps the difference as profit. If it rises, they absorb the loss.
Short interest, expressed as a percentage of shares on issue (the total number of shares a company has outstanding), lets you compare positioning across companies of different sizes. A 5% short interest in a $10 billion company represents far more capital at risk than 5% in a $50 million company, but the percentage tells you the same thing about the proportion of the register that is actively bet against.
On the ASX, significant short positions are reported to ASIC and then aggregated by third-party analysts, but with a lag of several days. That lag is the single most important practical limitation for retail readers: by the time you see the data, the stock may have already moved on a catalyst the numbers do not yet capture.
ASIC’s reporting regime requires disclosure of all on-market short sales regardless of size, a transaction-granular standard that makes Australia’s short interest data more comprehensive than equivalent US or UK systems, though it does not eliminate the lag that separates reported positions from real-time market activity.
Two things to internalise before the case studies. First, the reporting lag means you are always reading a slightly dated picture. Second, the direction of short interest alone does not tell you whether to be bullish or bearish. Rising shorts could mean new conviction against the stock, or hedging around a corporate event. Falling shorts could mean bears are capitulating, or they could mean bears already got paid and are locking in profits. Context is everything.
ASIC’s short selling reporting regime requires holders of significant short positions to report daily, with aggregated data published after a processing lag that creates the timing gap between real-world position changes and what retail readers ultimately see in the data.
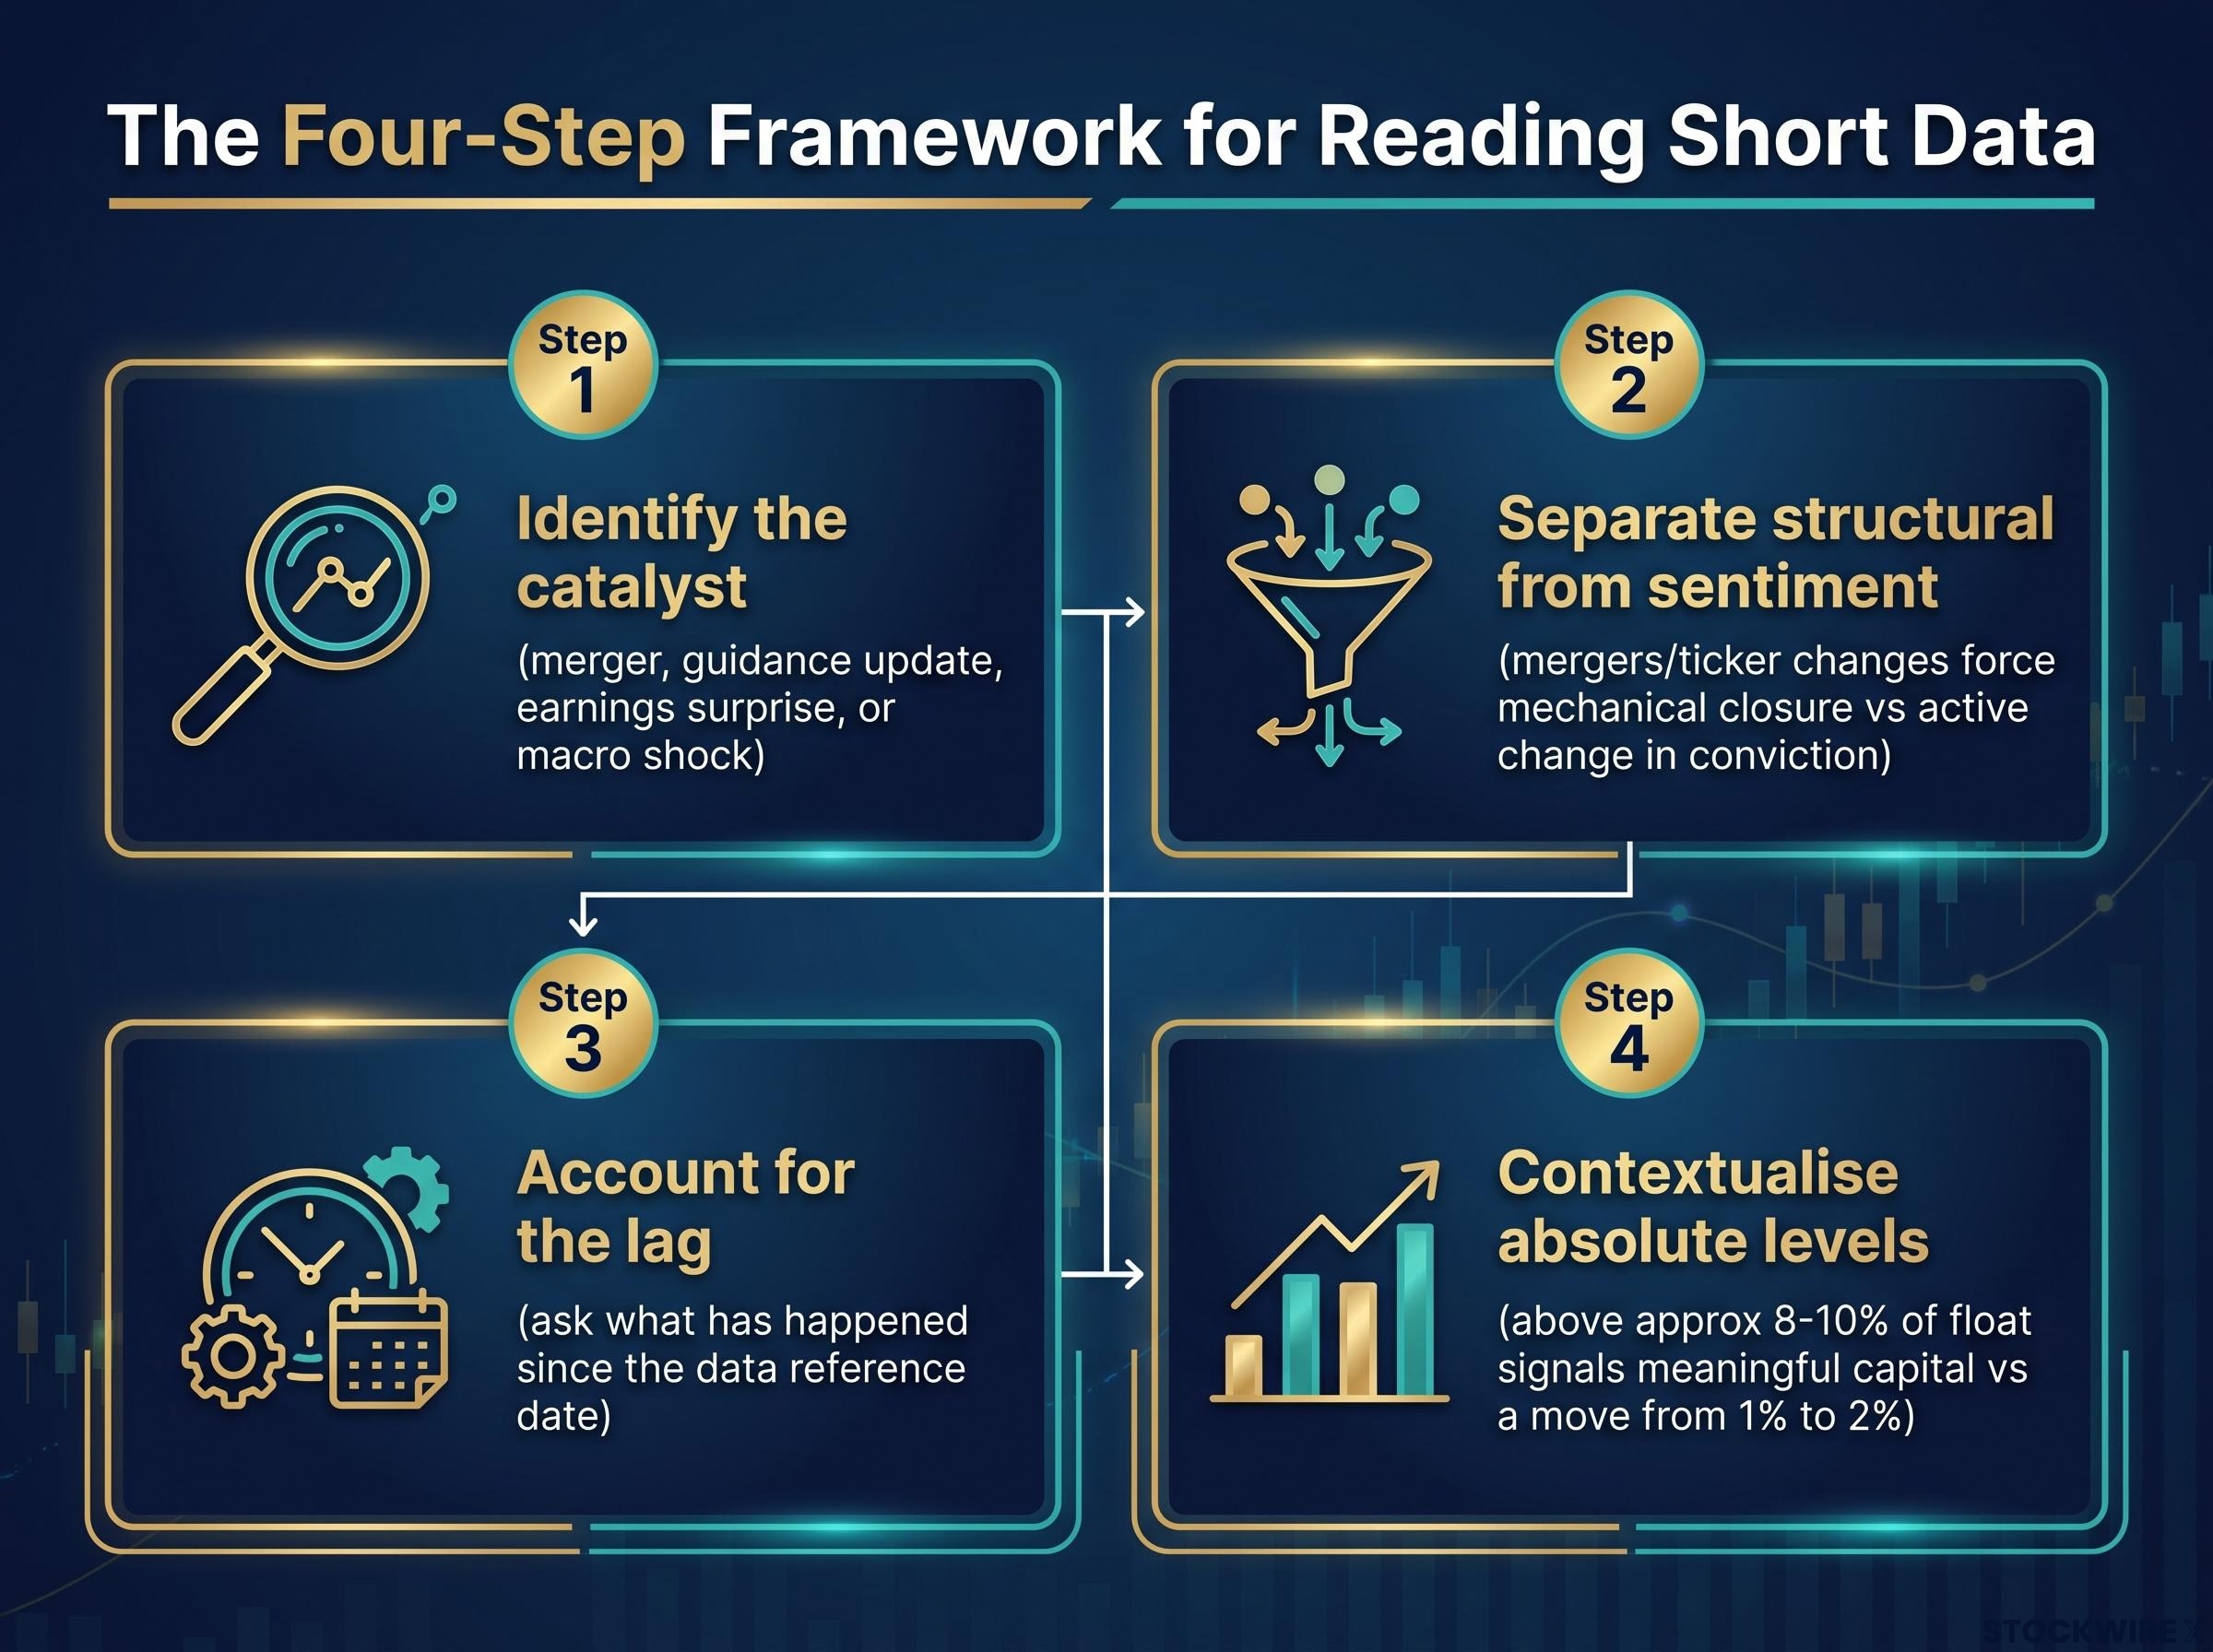
The four-step framework for reading short data
- Identify the catalyst: large moves in short interest almost always tie back to a specific event, whether a merger, guidance update, earnings surprise, or macro shock
- Separate structural from sentiment moves: mergers and ticker changes force mechanical closure of positions, which tells you nothing about the fundamental view; sentiment-driven moves reflect an active change in conviction
- Account for the lag: always ask what has happened to this stock since the data’s reference date, because the answer may already have changed the short picture
- Contextualise absolute levels: short interest above approximately 8-10% of float signals that a meaningful share of institutional capital is actively positioned against the stock, which carries different implications than a move from 1% to 2%
When big ASX news breaks, our subscribers know first
Qoria’s short collapse: what a completed merger actually signals
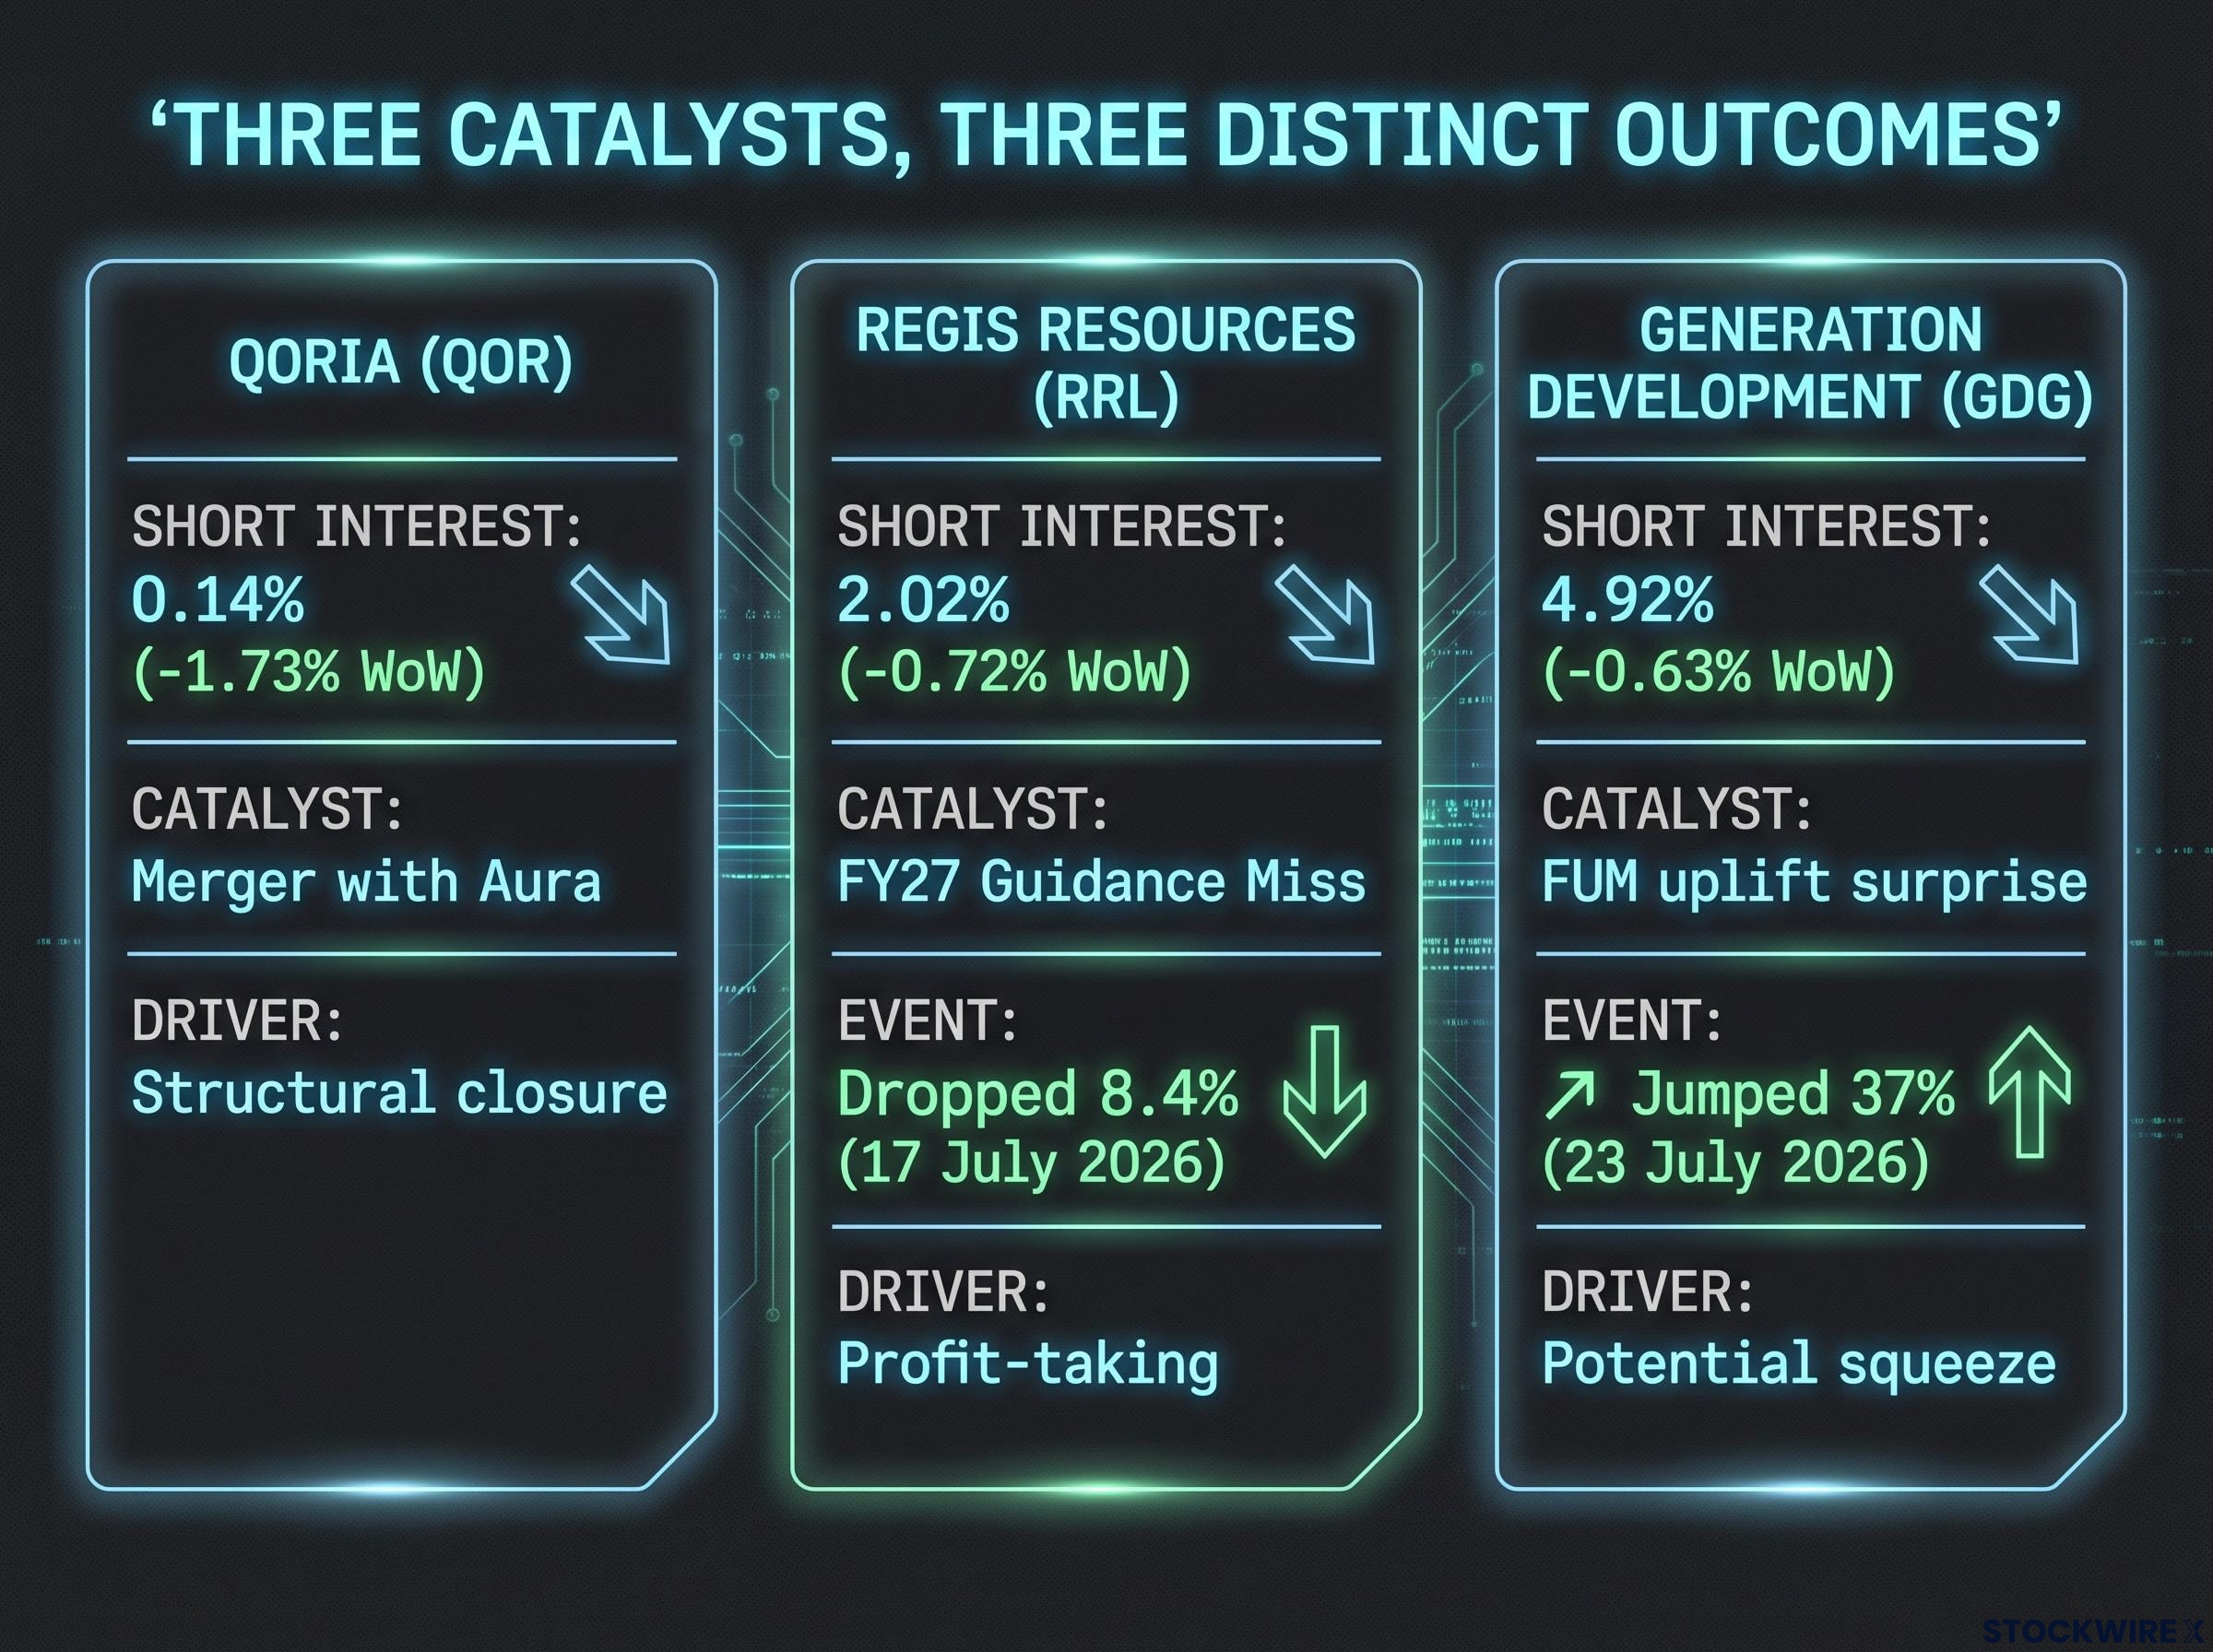
Qoria’s short interest fell to 0.14%, down 1.73% week-on-week and 3.23% month-on-month, the sharpest decline in the entire reporting period. On the surface, that looks like a dramatic shift in sentiment. It was not.
Qoria completed its merger with Aura, with the combined entity beginning to trade under the new ASX ticker AXQ via CDIs (Chess Depositary Interests, which are instruments that allow foreign-structured securities to trade on the ASX). Conditional CDI trading commenced from 9 July 2026, and the merger completed around 17 July 2026. When the old security ceased to exist, every short position in QOR had to be closed mechanically. There was no option to roll those positions to the new ticker in this type of corporate restructure.
The more telling data point sits in the new entity. AXQ was already accumulating modest short interest, around mid-single-digit basis points and rising in mid-July, suggesting that some bearish positioning is re-emerging in the combined company.
Corporate actions, whether mergers, demergers, or schemes, are among the most reliable short-position reset triggers on the ASX. Sharp moves in short interest around these events often tell you more about structure than fundamentals.
Takeover-driven short closures follow a consistent structural logic: once deal certainty shifts decisively in favour of completion, the risk-reward on maintaining a short position collapses and mechanical unwinding begins regardless of any fundamental view on the target, a pattern visible in the Atlas Arteria data where short interest nearly halved in a single week after IFM secured control.
For you as an investor, the practical takeaway is direct: large short declines around corporate actions are structural housekeeping, not a signal to buy. Always check what the new entity’s short interest looks like before drawing any conclusion about sentiment.
Regis Resources and the guidance miss: when short covering follows bad news
Here is a contradiction worth sitting with. Regis Resources dropped approximately 8.4% on 17 July 2026 after releasing FY27 guidance that missed analyst expectations across production volume, costs, and capital expenditure. The stock was punished. Yet short interest fell to 2.02%, down 0.72% week-on-week and 1.09% month-on-month.
Normally, a guidance shock of that severity attracts more shorts. The fact that short interest declined tells you something specific about timing: who held the short, and when they built it.
Three readings are plausible. First, pre-positioned shorts took profit after the guidance miss delivered exactly the price drop they had been betting on. The trade worked; they closed it. Second, some of the short building had occurred in prior weeks, meaning positions had already partly unwound before the announcement date. Third, new shorts may yet enter at post-selloff prices, but that activity would only appear in subsequent ASIC reports because of the lag.
Why falling short interest after bad news can be misleading
The profit-taking explanation is the most important one for retail investors to understand. If a bearish thesis plays out and the stock drops, covering is de-risking after a successful trade. It is not a bullish signal. It is bears collecting their winnings.
The watch-forward point matters too. If new shorts appear at post-guidance prices in the next ASIC release, that would confirm ongoing bearish conviction rather than a resolved trade. If positioning stays light, it implies the market thinks the damage is largely absorbed.
Generation Development Group: FUM surprise, a 37% rally, and the squeeze question
Generation Development Group entered late July with short interest already falling meaningfully. At 4.92%, it was down 0.63% week-on-week and a substantial 4.27% month-on-month, suggesting bears had been steadily de-risking through June and into July.
Then, on 23 July 2026, GDG jumped approximately 37% in a single session after disclosing a substantial quarter-on-quarter uplift in funds under management (FUM, the total value of assets a fund manager oversees on behalf of clients), well ahead of what the market had been pricing in.
Here is where the lag matters most. ASIC’s reporting cycle runs roughly four days behind real time, which means the short figures from the week ending 20 July were already finalised before the 23 July rally occurred. Any forced covering that followed the surge will only become visible in the subsequent release.
The question the next release will help answer is structural: was the 37% surge primarily forced covering, or genuine fundamental re-rating? If covering was a significant share of the buying, that demand source disappears once shorts are largely gone, making the re-rating potentially fragile. If fundamental buyers dominated, reduced short interest simply removes an overhang and supports the new valuation.
For GDG specifically, the next ASIC short data release is one of the more informative data points you can monitor. The magnitude of the short interest decline will help distinguish between a squeeze-driven rally and a fundamentals-driven re-rating.
| Stock | Short Interest | WoW Change | MoM Change | Catalyst Type |
|---|---|---|---|---|
| Qoria (QOR) | 0.14% | -1.73% | -3.23% | Merger (structural closure) |
| Regis Resources (RRL) | 2.02% | -0.72% | -1.09% | Guidance miss (profit-taking) |
| Generation Development (GDG) | 4.92% | -0.63% | -4.27% | FUM surprise (potential squeeze) |
Where institutional bears are adding: gold juniors, biotech, and structural sceptics
The declining shorts tell one set of stories. The rising shorts tell another, and this week the cluster logic is unusually clear.
Gold sector shorts: execution risk, not commodity bearishness
Four gold names saw rising short interest in the same period, despite a broadly supportive gold price backdrop through 2026. That distinction matters: the bet here is on management and operational failure, not on the commodity itself.
Genesis Minerals (GMD) sits at 8.62% short interest, up 0.95% week-on-week and 2.66% month-on-month. GMD is in the process of completing its tie-up with Vault Minerals, and part of the increase in short positioning likely reflects arbitrage hedging around that transaction rather than a straightforward directional view on the business.
Pantoro Gold (PNR) at 2.38%, up 0.93% week-on-week, has shed approximately 58.5% of its value year-to-date after a string of quarterly results that fell short of expectations. The June quarter and FY26 outcome missed guidance targets due to contractor underperformance, geotechnical complications at deeper levels underground, and difficulties sourcing sufficient labour. This is a situation where shorts persist: ongoing execution risk, no clear near-term fix, and limited positive catalysts.
Ora Banda Mining (OBM) at 4.28%, up 0.53% week-on-week and 1.17% month-on-month, and Kingsgate (KCN) at 2.61%, up 0.69% week-on-week and 0.72% month-on-month, round out the gold names drawing increased bearish positioning.
When shorts build in a sector despite favourable commodity tailwinds, the bet is on company-specific execution failure. That distinction matters for how you should respond to any bullish gold price thesis in these individual names: a positive view on the commodity does not automatically translate into a positive view on the stock.
Early stress signals in short data tend to precede price dislocations by days or weeks rather than hours, a lead-time advantage that institutional investors exploit systematically, as the Lotus Resources case illustrates: short interest had already reached approximately 11% before the stock fell 34% in a single session on 30 April 2026.
Biotech, travel, and the ASX itself
Development-stage biotech names with cash burn and binary clinical milestones frequently attract elevated short interest due to valuation and funding risk.
4DMedical (4DX) at 13.14% short interest (up 1.14% week-on-week and 2.09% month-on-month) is the second-highest absolute short position in the dataset after Flight Centre. That level signals sharply divided institutional sentiment. Immutep (IMM) saw the largest week-on-week increase of any stock in the rising cohort at +1.24%, bringing its short interest to 3.64%. Clarity Pharmaceuticals (CU6) at 8.19% and Imugene (IMU) at 1.17% complete the biotech names with rising short exposure.
Flight Centre (FLT) at 12.38% short interest, up 0.57% week-on-week and 0.89% month-on-month, carries persistent bearish positioning that reflects structural scepticism about the long-term economics of its model. ASX Ltd at 6.36%, up 0.69% week-on-week, is often treated as a macro proxy: a vehicle for expressing bearish views on Australian equity market volumes and listings activity.
| Stock | Short Interest | WoW Change | MoM Change | Sector |
|---|---|---|---|---|
| Immutep (IMM) | 3.64% | +1.24% | +1.05% | Biotech |
| 4DMedical (4DX) | 13.14% | +1.14% | +2.09% | Biotech |
| Genesis Minerals (GMD) | 8.62% | +0.95% | +2.66% | Gold |
| Pantoro Gold (PNR) | 2.38% | +0.93% | +0.57% | Gold |
| ASX Ltd (ASX) | 6.36% | +0.69% | +0.83% | Exchange / Macro proxy |
| Kingsgate (KCN) | 2.61% | +0.69% | +0.72% | Gold |
| Imugene (IMU) | 1.17% | +0.63% | -0.13% | Biotech |
| Flight Centre (FLT) | 12.38% | +0.57% | +0.89% | Travel |
| Clarity Pharma (CU6) | 8.19% | +0.57% | +1.08% | Biotech |
| Ora Banda (OBM) | 4.28% | +0.53% | +1.17% | Gold |
What to watch when the next ASIC data drops
The three case studies above each leave an unresolved question, and the next ASIC short data release will help answer each one. Here is what to look for:
- GDG short interest collapse or stabilisation: A sharp further decline would confirm that the 23 July rally was substantially squeeze-driven. Stabilisation or a modest further dip would point to a more fundamentals-led re-rating, which is generally more durable.
- RRL new short entry or continuation: If new shorts appear at post-guidance prices, bearish conviction is ongoing and the guidance miss opened a new chapter rather than closing one. If positioning stays light, the market may view the damage as largely priced in.
- GMD and gold positioning through the merger: Whether shorts keep building through the Vault Minerals merger process will clarify whether this is mainly arbitrage hedging or a broader valuation concern about the combined entity.
The GDG release is especially informative because the four-day lag means last week’s figures captured none of the forced covering that likely followed a 37% single-session move.
Short data is most useful not as a standalone signal but as a live record of how quickly professional capital updates its views when corporate facts change. Each new ASIC release either confirms or challenges the interpretation you formed from the last one.
Reading the July data as a whole: what it tells you, and what it does not
The week ending 20 July 2026 contained a structural reset (Qoria), a successful bearish trade being closed (Regis), and a potential squeeze still unresolved (GDG). The aggregate short data number for the week, taken as a single figure, would have told you almost nothing. The stories sit inside the individual moves.
Two tools separate signal from noise: catalyst identification and lag awareness. Apply them to every ASIC release and the numbers start functioning as a diagnostic rather than a raw sentiment score.
That said, short data has clear limits. It does not reveal individual short seller identities. It does not confirm whether new positions are being built right now, only what was reported as of the reference date. And it cannot predict whether a squeeze will sustain or retrace.
- Short data does not tell you who is short, only how much of the register is short
- The reporting lag means every reading is slightly stale by the time you see it
- Direction alone (rising or falling) is ambiguous without a catalyst to contextualise it
- High absolute levels flag risk but do not guarantee a squeeze or a decline
The reporting lag functions as an early warning tool only if readers track ASX company announcements in parallel with published short figures, because the T+4 ASIC disclosure cycle means events such as Lotus Resources retracting its quarterly production data had already moved the stock before retail investors could read the short interest confirmation.
The data referenced covers the week ending 20 July 2026, with week-on-week and month-on-month comparisons sourced from Market Index reporting by Kerry Sun, published 28 July 2026. The next ASIC release will carry the answers to the open questions this one raised. That is where these stories continue.
This article is for informational purposes only and should not be considered financial advice. Investors should conduct their own research and consult with financial professionals before making investment decisions.
Past performance does not guarantee future results. Short interest data is subject to reporting lags and should be interpreted alongside broader market and company-specific context.
—