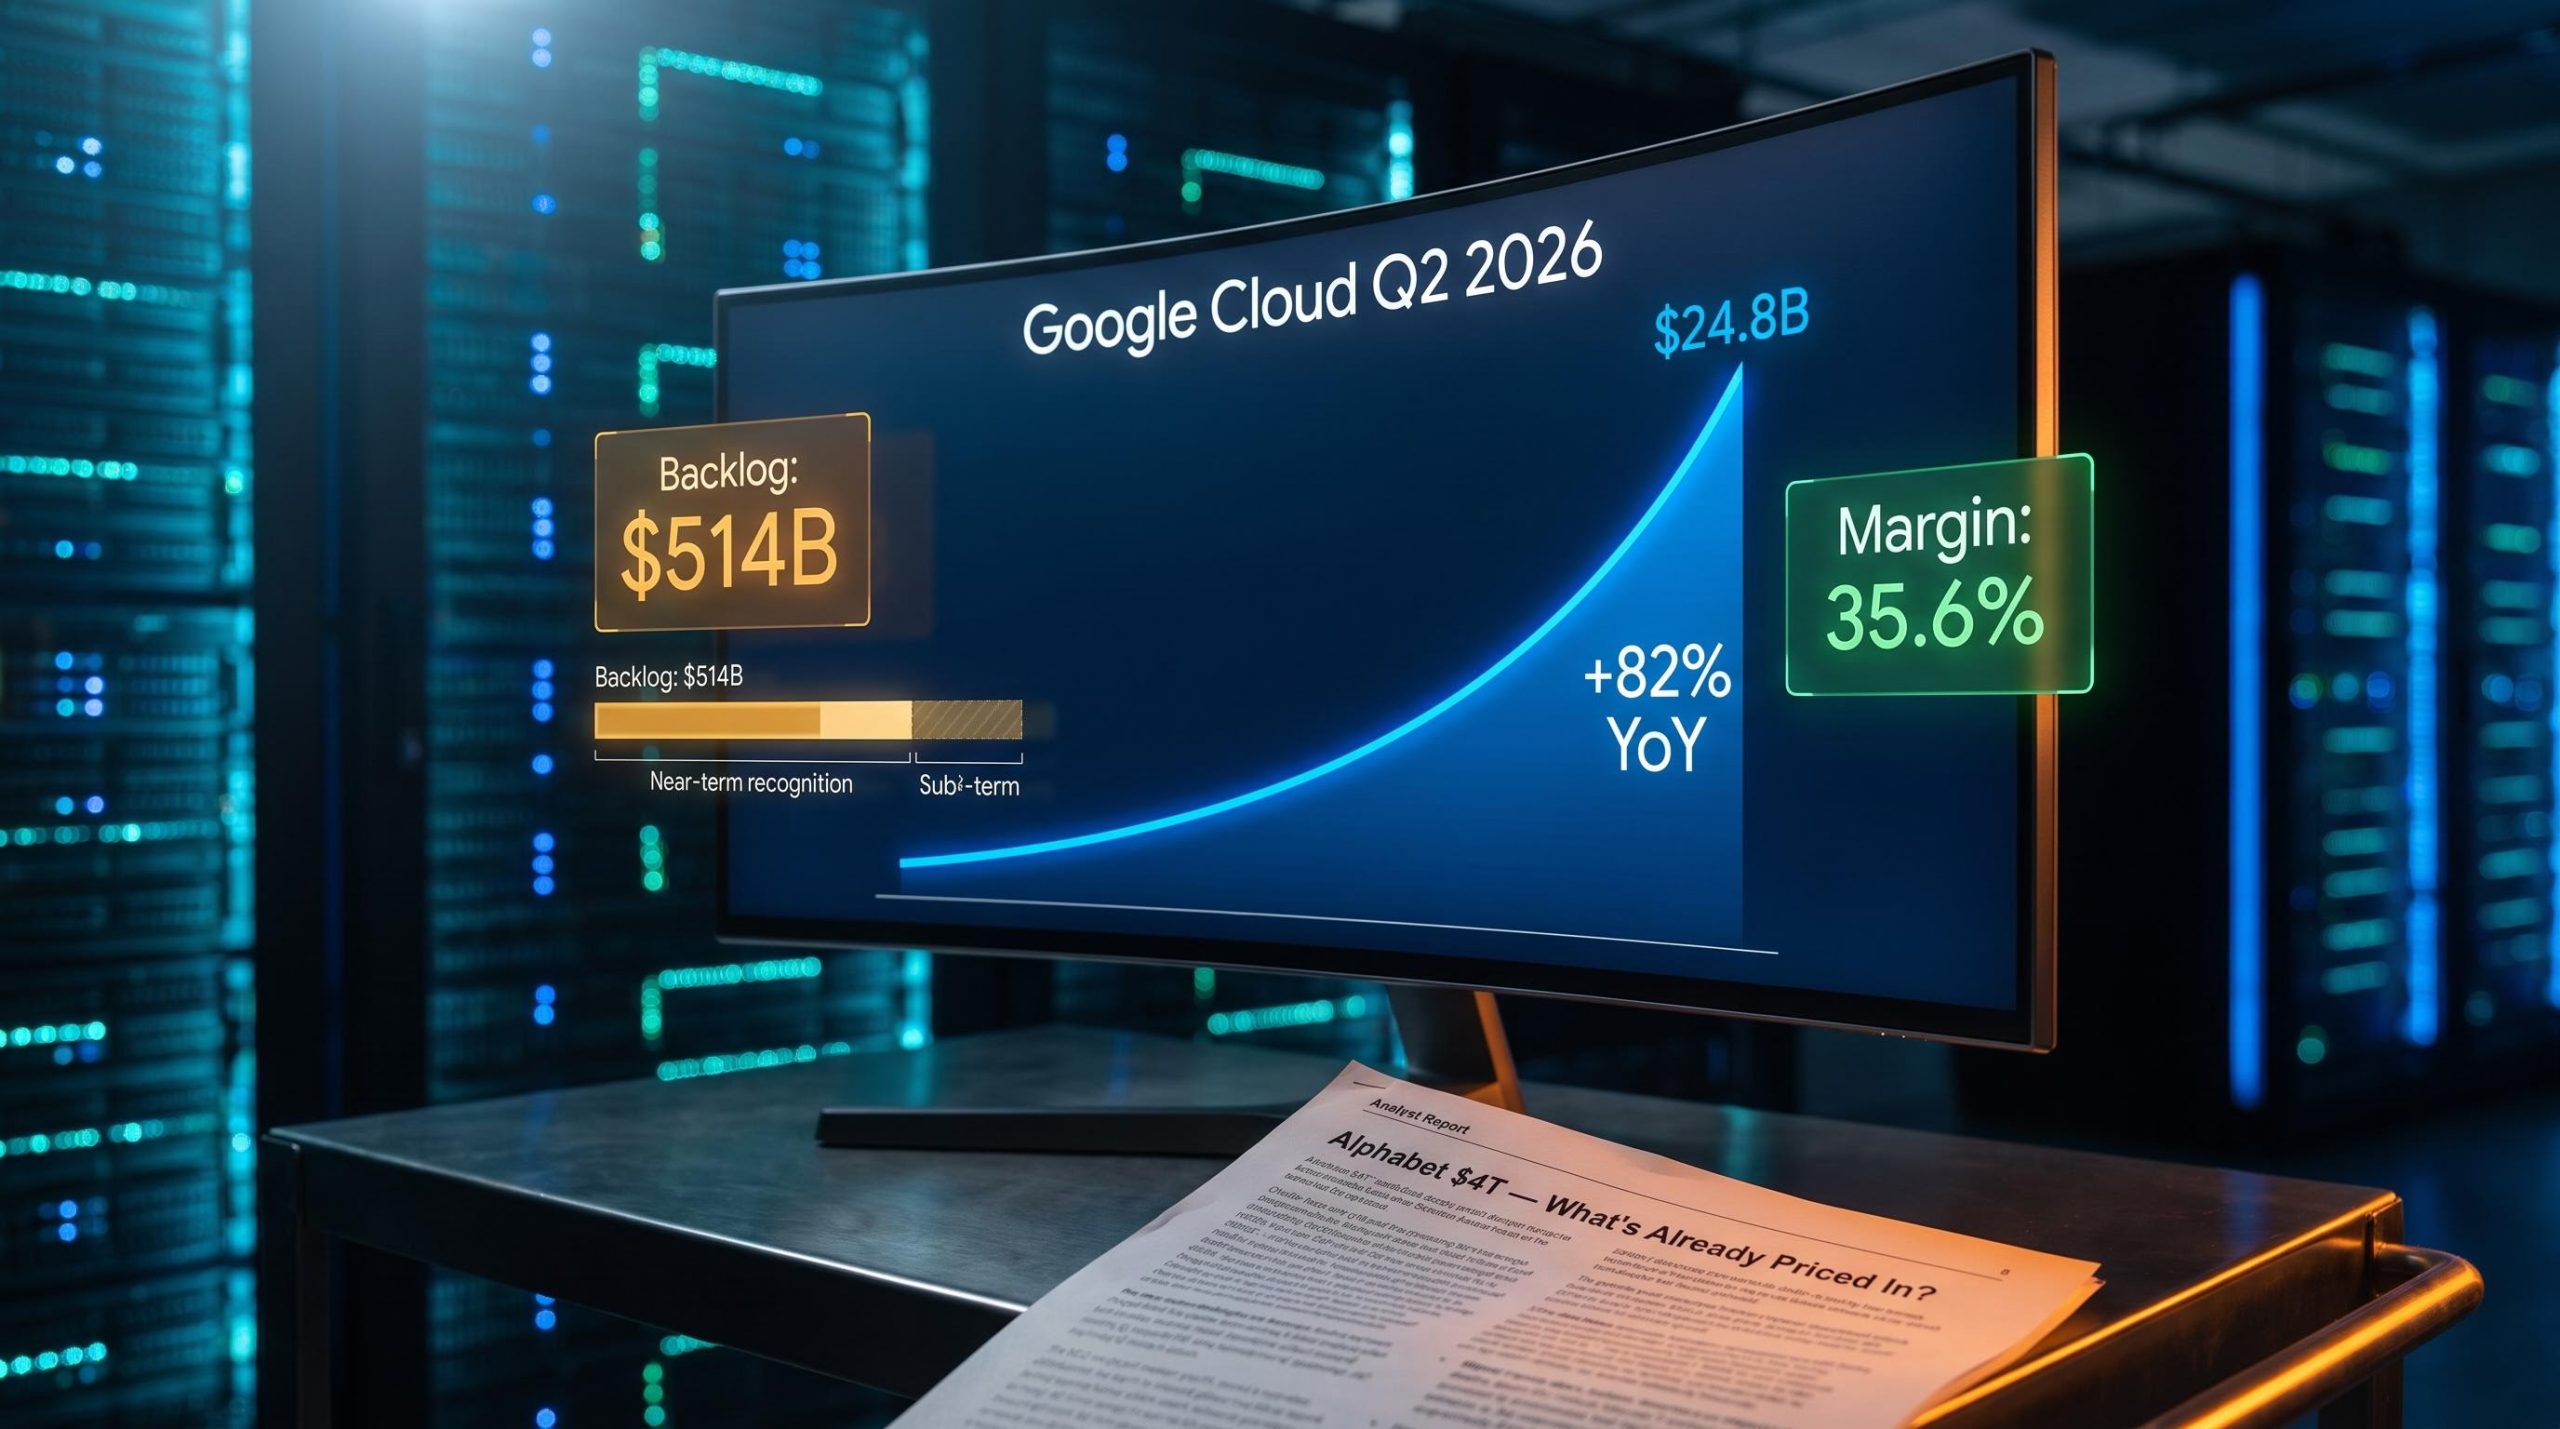
Google Cloud posted $24.8 billion in quarterly revenue, growing 82% year over year. Operating margins nearly doubled to 35.6%. The backlog sits at $514 billion. And the stock is priced at approximately $4 trillion in market capitalisation.
That is an extraordinary set of numbers attached to an extraordinary valuation. The question worth asking is not whether Google Cloud is delivering; it plainly is. The question is whether that delivery has been fully absorbed into the current share price.
Here is a framework for evaluating what Cloud’s Q2 2026 performance actually changes about the Alphabet investment thesis, what remains genuinely uncertain, and how to size a position based on what the data supports rather than what the narrative suggests.
What Google Cloud’s Q2 numbers actually show
The headline figures earn their own moment:
- Revenue: $24.8 billion, up 82% year over year
- Operating margin: 35.6%, up from approximately 20.7% a year ago
- Approaching a $100 billion annual run rate
Cloud supplied almost two-thirds of Alphabet’s added operating profit year over year, making it the single largest source of incremental value creation in the company.
The acceleration is real. Q1 2026 came in at approximately $20 billion, growing 63% year over year. Moving from 63% to 82% in a single quarter, while expanding margins simultaneously, is rare at this scale.
But context matters. In Q1, management had already disclosed a backlog nearing $462 billion with more than 50% expected to be recognised within 24 months. Sophisticated investors tracking that backlog would have partially anticipated this step-up. The quarter confirmed the trajectory; it did not blindside the market. That distinction matters when you are deciding how much incremental conviction to assign.
When big ASX news breaks, our subscribers know first
How a $514 billion backlog creates certainty now and uncertainty later
The backlog’s near-term reliability is difficult to argue with. According to management, over half of the $514 billion total is scheduled for recognition across the coming two years, meaning the next two to three years of Cloud revenue growth are grounded in binding contracts, not projections.
| Metric | Q2 2025 | Q1 2026 | Q2 2026 |
|---|---|---|---|
| Cloud Revenue | — | ~$20B (+63% YoY) | $24.8B (+82% YoY) |
| Cloud Operating Margin | ~20.7% | — | 35.6% |
| Cloud Backlog (RPO) | ~$106B | ~$462B | ~$514B |
| Backlog Coverage (annualised) | — | ~6 years | ~5 years |
The year-over-year backlog growth of approximately 385-390% is staggering. But the sequential picture tells a different story. The Q2 addition of roughly $52-54 billion is large in absolute terms, yet represents a meaningful deceleration from the prior surge that took backlog from $106 billion to $462 billion.
The Q1 2026 backlog dynamics tell an important part of this story: Cloud’s operating margin expanded from approximately 18% to 32.9% in a single quarter, a move that prompted Goldman Sachs to characterise the tripling of cloud operating income as a game-changer for Alphabet’s multiple, establishing the baseline from which Q2’s acceleration should be measured.
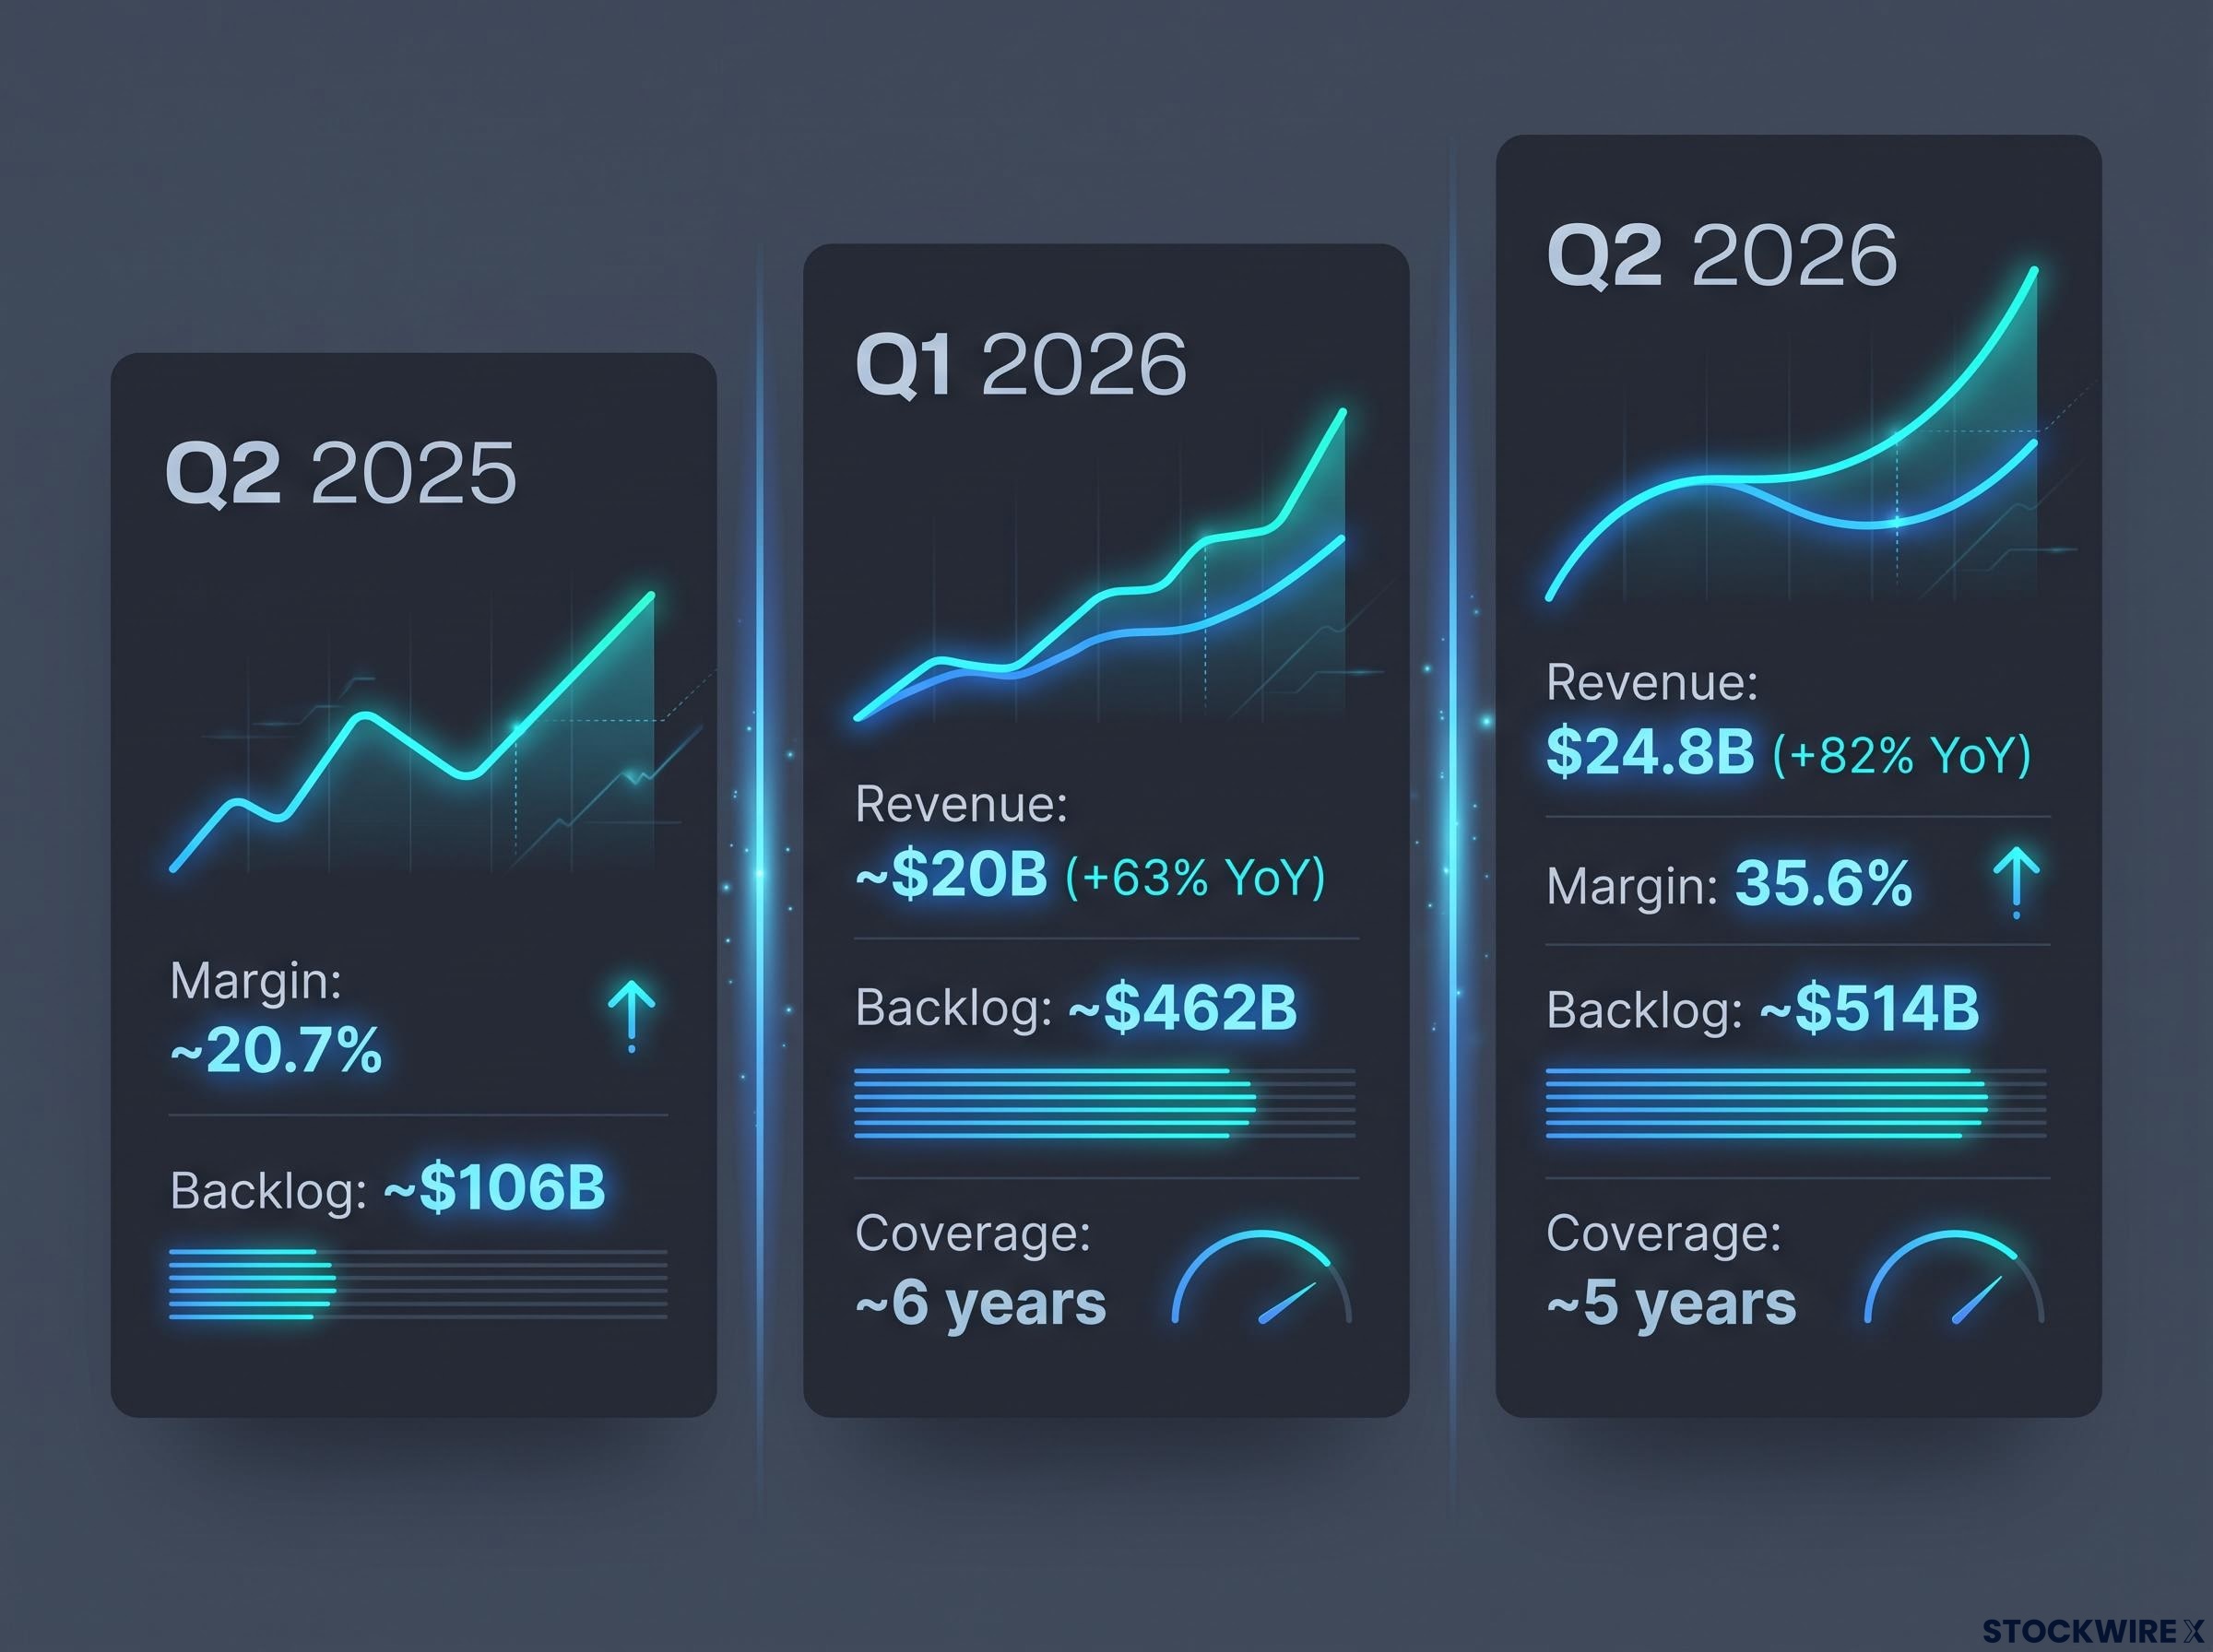
The coverage ratio shift, from approximately six years to just over five, is not a sign of backlog weakness. It reflects revenue catching up to backlog, which is exactly what healthy conversion looks like. The question is whether the sequential pace of new commitments can reaccelerate. Achieving the most aggressive five-year targets, with Cloud annual revenue in the $255-300 billion range, would almost certainly demand a backlog approaching $1 trillion or beyond. That scale of commitment is not yet visible in the current trajectory.
Why backlog composition matters for margin assumptions
Not all backlog is created equal. A growing portion now includes direct TPU hardware sales, which are lumpier and carry different margin and renewal characteristics than recurring GCP service contracts. The majority of backlog remains typical cloud infrastructure agreements, but monitoring the compositional split in future quarters matters for margin modelling.
Understanding Google Cloud’s role in Alphabet’s business (and why it dominates the investment thesis)
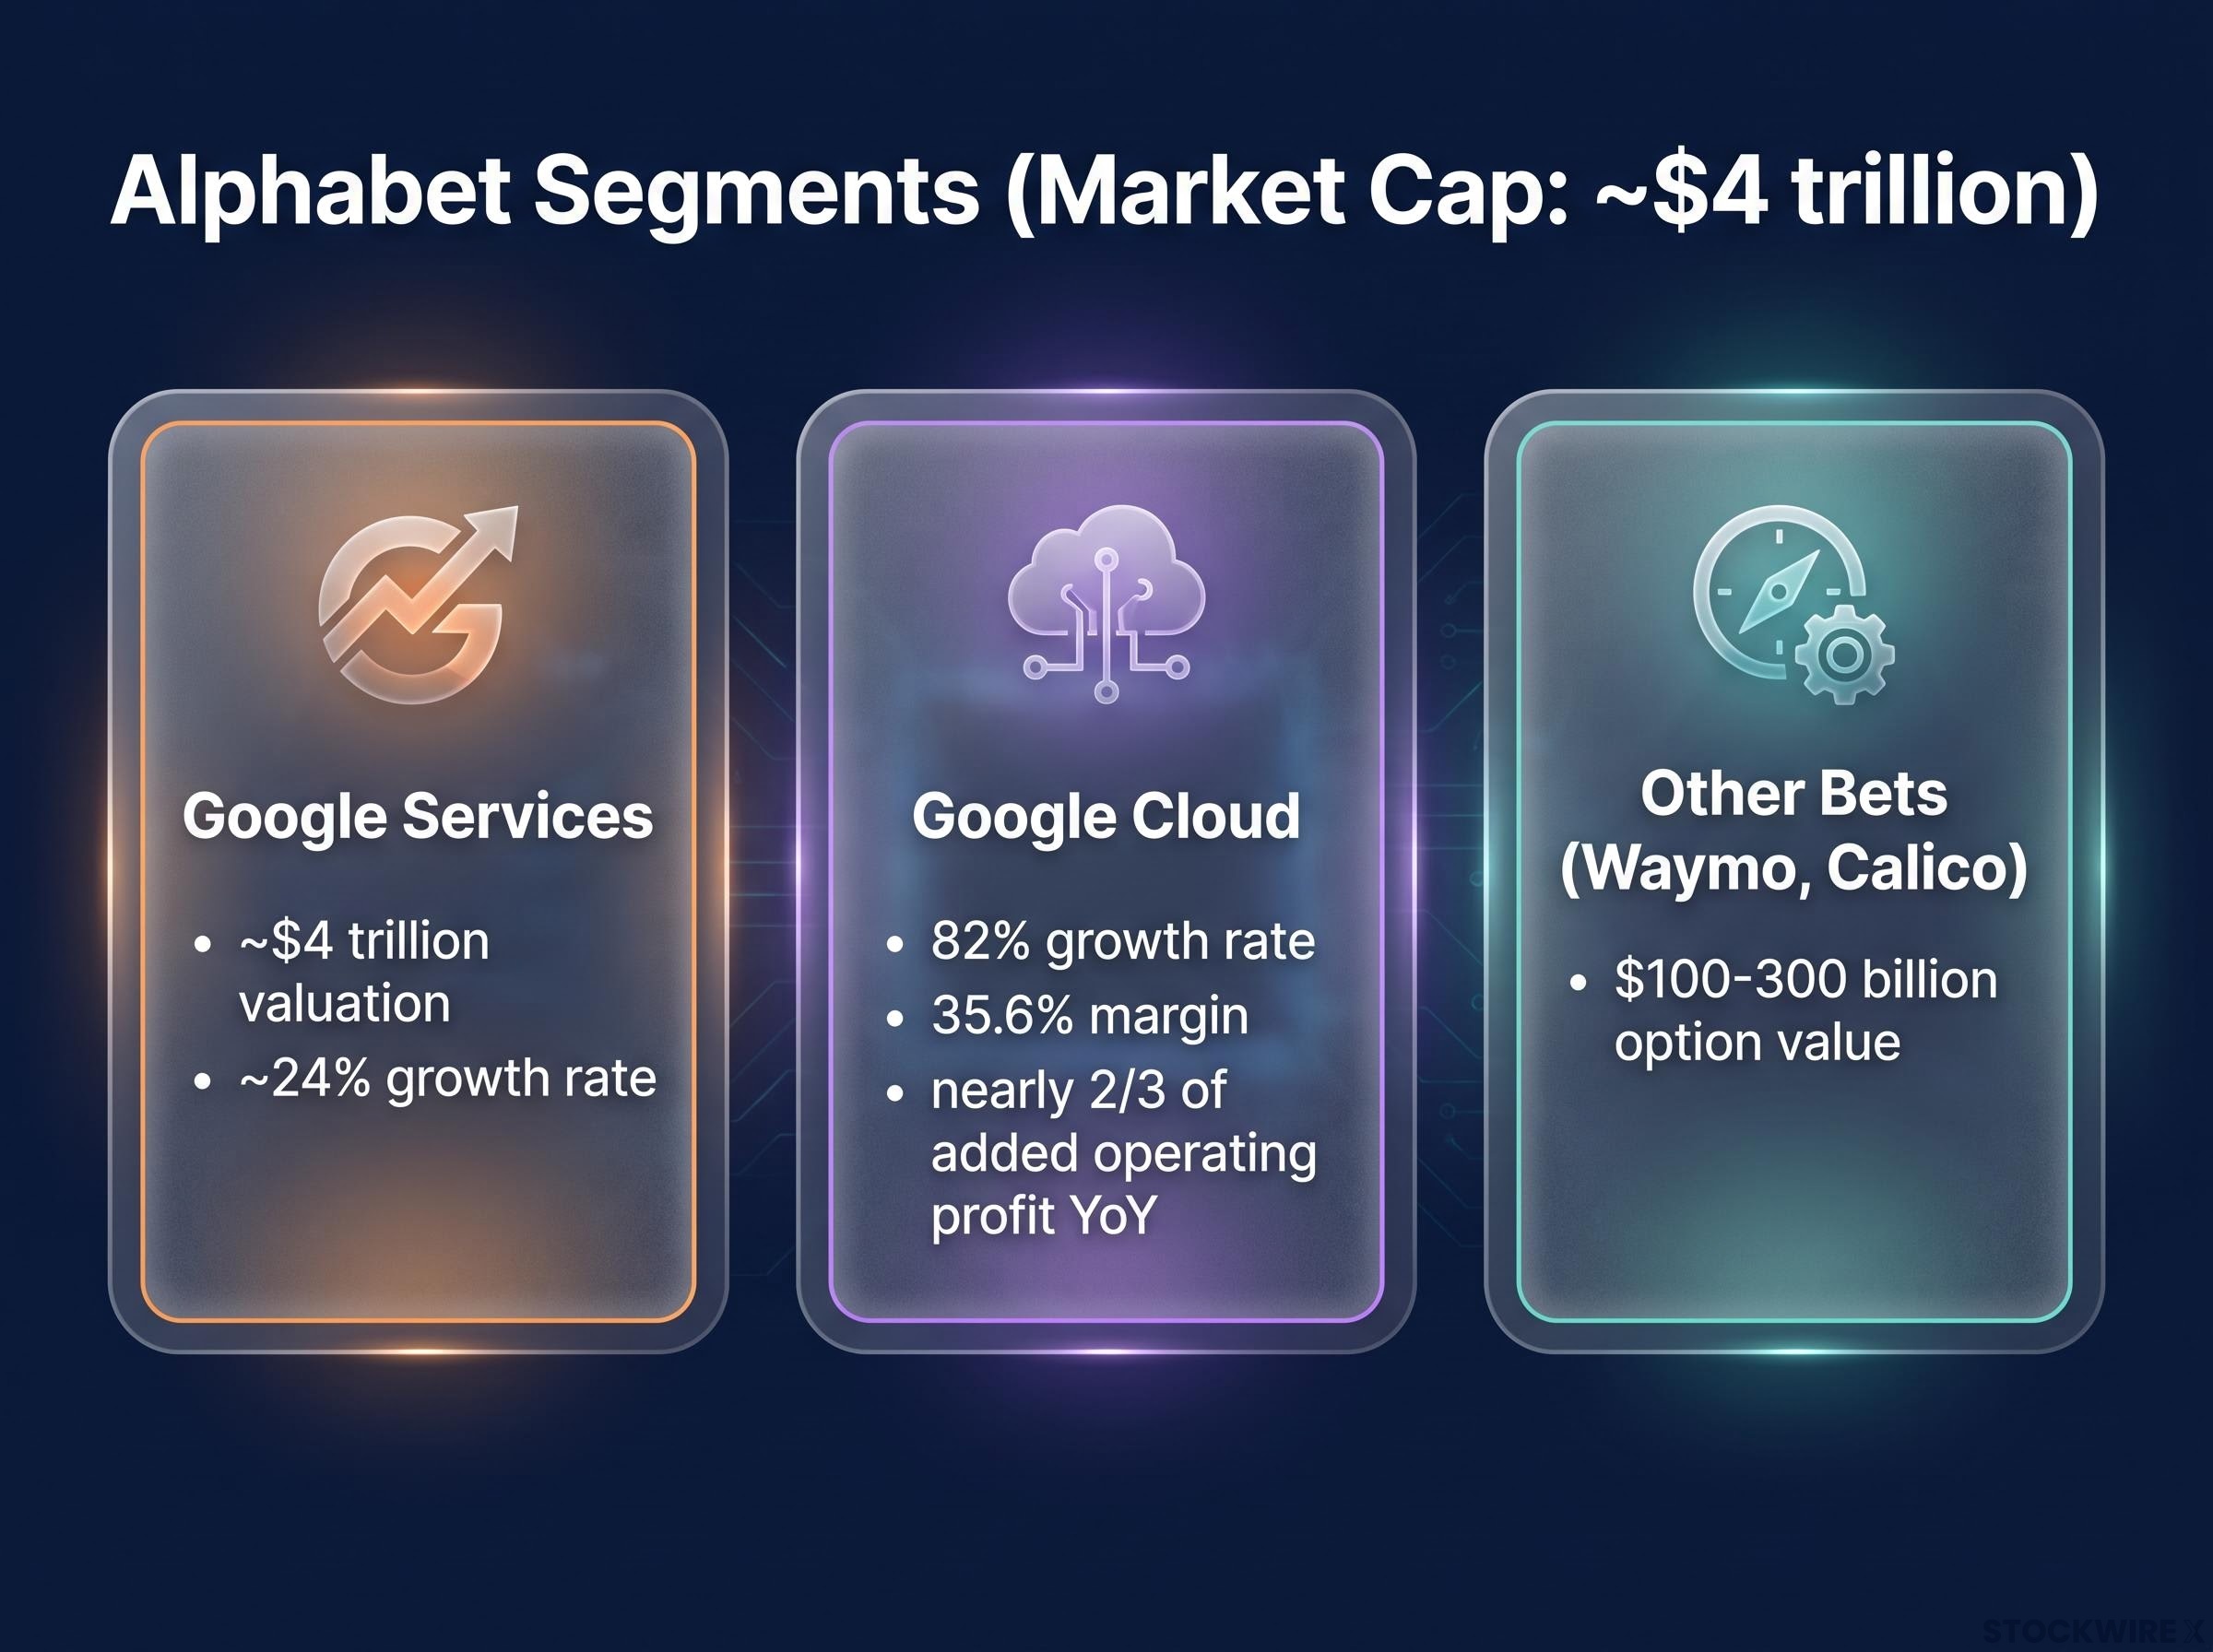
Alphabet operates across three segments, and understanding their relative weight is what makes the valuation argument in the next section land clearly.
- Google Services (Search, YouTube, advertising): Generates the majority of revenue and operating income. In analyst frameworks, Services is estimated to account for approximately $4 trillion of current valuation. Growth runs at the company-wide rate of roughly 24%, well below Cloud.
- Google Cloud: Growing at 82% with 35.6% margins. Supplied nearly two-thirds of added operating profit year over year. This is where incremental return lives.
- Other Bets (Waymo, Calico, and others): Estimated option value of $100-300 billion. Not yet generating profits that support clear valuation.
Because Google Services already accounts for the lion’s share of current enterprise value, incremental upside from today’s price is largely a bet on Cloud. A strong advertising quarter helps, but it does not move the needle the way Cloud trajectory does. That is the structural reality investors need to internalise.
What $195-205 billion in capex signals about confidence and risk
Alphabet lifted its full-year 2026 capex outlook to $195-205 billion, roughly $15 billion above previous guidance. The company has indicated that AI infrastructure demand is running ahead of available data centre capacity, leading it to draw on external provider capacity in the near term while its own build-out continues.
This is both a bullish signal and a risk factor. If AI demand sustains, the investment generates outsized returns. If demand plateaus before the capacity comes online, the infrastructure spend will produce below-target returns. The capex commitment is a measure of management conviction; any future downward revision would be a meaningful negative signal.
Can Cloud’s 35% margins survive the capacity wave coming in 2027-2028?
The margin story is defensible today. Capacity constraints give cloud providers pricing leverage. AI workloads, both training and inference, are deeply integrated into customer workflows, creating high switching costs. Gemini Enterprise adoption is widespread among Fortune 100 companies, reinforcing near-term pricing power.
That is the supply-constrained environment. It will not last forever.
Alphabet, Microsoft, and Amazon are each committing tens of billions annually in AI-related capex. New data centre capacity will begin arriving at scale in the 2027-2028 window. When supply constraints ease, price competition historically re-emerges. Prior to the AI-driven surge, AWS operated for several years with margins broadly in the 20-30% band, and today’s Cloud margins have already moved above that range.
Combined hyperscaler capex commitments reached $130 billion in Q1 2026 alone, with full-year 2026 projections across Amazon, Microsoft, Alphabet, and Meta now sitting at approximately $725 billion, a figure that puts Alphabet’s own $195-205 billion guidance in competitive context and signals that the new data centre capacity arriving in 2027-2028 will be substantial across the entire sector.
The recommended modelling approach is straightforward:
- Bear case (20-25% margins): Competitive normalisation plays out as new capacity floods the market and enterprise customers push harder on price.
- Base case (approximately 30% margins): Pricing power moderates but AI workload stickiness preserves a premium above historical cloud infrastructure levels.
- Bull case (35%+ margins): Supply constraints persist longer than expected, and Google’s AI platform differentiation sustains premium pricing.
The central unresolved question is whether today’s Cloud margin level reflects a durable shift in the economics of AI workloads, or a temporary peak tied to constrained supply. That distinction carries enormous weight: the answer shapes tens of billions in annual operating income at Cloud’s projected scale.
The difference between 25% and 35% operating margins at $100+ billion in revenue is enormous. That single variable, more than any revenue growth assumption, is the most leveraged input in any five-year Cloud valuation model.
What the valuation requires you to believe about the next five years
At approximately a $4 trillion market capitalisation, what does Cloud need to deliver for Alphabet to generate attractive returns from here?
| Scenario | Cloud Revenue (5 years) | Required CAGR | Margin Assumption | Implied Return |
|---|---|---|---|---|
| Conservative | ~$60-65B | ~20% | 25-30% | Flat to low single digits (real) |
| Bull Case | $255-300B | 40-60%+ | 30%+ | High-teens annualised |
Reaching the high-teens return scenario demands a confluence of conditions that are individually plausible but collectively demanding: sustained hypergrowth in revenue, margins holding well above historical cloud norms, and premium multiples maintained throughout, all across a full five-year horizon.
The five-year return arithmetic at a $4 trillion-plus valuation is demanding regardless of which input assumptions a model uses: reaching the high-teens annualised return scenario requires Alphabet to nearly double its market capitalisation within five years, a calculation that places the bull case’s probability in sharp relief against historical base rates for large-cap compounders.
The conservative scenario is not pessimistic. A 20% CAGR from $24.8 billion produces a business generating $60-65 billion in Cloud revenue, which is a strong outcome by any historical standard. It simply may not generate meaningful returns above what is already priced in.
The bull case requires 40-60%+ sustained annual growth, margins holding near 30% or better, a backlog moving toward $1 trillion, and a market willing to maintain premium multiples. History suggests those conditions rarely coincide for a full five-year stretch.
There is also a macro dimension. Advertising still underpins the majority of Alphabet’s consolidated earnings. A recession cutting ad revenue by 15-20% would simultaneously compress earnings, multiples, and the capital available to fund Cloud’s buildout. Regulatory risk, while currently assessed as low probability for structural remedies, remains a non-trivial tail factor at this valuation.
The DOJ antitrust remedies against Google, finalised in September 2025, prohibit exclusive default search contracts and require Google to share query data with rivals, giving the regulatory tail risk mentioned in valuation models a concrete and enforceable shape.
Sizing the position to match what the data actually supports
Two investor profiles emerge from this analysis, and neither is wrong.
Conditions supporting a meaningful long position:
- High confidence that Cloud sustains 20-25%+ annual growth for at least five years
- Conviction that margins hold near 30% or above as new capacity enters the market
- Belief that the market will continue rewarding large-cap AI infrastructure with premium multiples
- Comfort with advertising cyclicality and regulatory tail risk at current valuation levels
Conditions supporting a core holding rather than a concentrated bet:
- Recognition that backlog growth is already moderating sequentially
- Acknowledgement of realistic margin normalisation risk as hyperscaler capacity expands
- Awareness that the two-to-three year Cloud story is well-supported but the five-year ultra-bull case rests on extrapolation
- Preference for position sizing that reflects risk-reward balance rather than best-case conviction
The practical question is not buy or sell. It is how much. Your position size should reflect your actual conviction in each of the specific assumptions the bull case requires, not your confidence in the quality of the business in isolation. Quality and valuation are separate questions, and at $4 trillion, they are pulling in different directions.
For investors exploring how Alphabet fits within a broader AI portfolio allocation, our deep-dive into Alphabet versus Nvidia positioning examines how Gemini’s 750 million monthly active users and Waymo’s robotaxi revenue vector extend the investment case beyond Cloud and Search into segments that analysts believe remain largely unpriced at current valuations.
Three data points to watch before the next quarter confirms or challenges the thesis
- Sequential backlog addition in Q3 2026: The Q2 figure of approximately $52-54 billion is the reference point. Acceleration back above $60-70 billion would strengthen the five-year bull case; deceleration below $40 billion would meaningfully widen the uncertainty band around long-term revenue projections.
- Cloud operating margin trajectory: Sustained margins at or above 32-33% into a quarter where new capacity comes online would signal structural pricing power rather than cyclical tailwinds. Compression toward 28-30% would be consistent with normalisation beginning earlier than expected.
- Advertising revenue trend: Any material deceleration in Search and YouTube growth would compress Alphabet’s multiple across all segments and reduce the capital available to fund continued Cloud investment. The $195-205 billion capex commitment makes advertising health a funding question, not just an earnings question.
Tracking these three indicators each quarter converts a single analysis into a repeatable evaluation framework, one that lets you adjust conviction and position size as the thesis confirms or weakens rather than reacting to headline growth numbers that were partially visible in advance.
The numbers are extraordinary. The entry point is too.
Google Cloud has delivered results that confirm a structural shift in Alphabet’s business. 82% revenue growth, 35.6% margins, and a $514 billion backlog are not incremental improvements. They represent a company that has become one of the world’s most important AI infrastructure providers.
The stock’s valuation reflects most of that shift already. The two-to-three year Cloud story is strong and well-supported by binding contracts. The five-year ultra-bull case requires assumptions that are achievable but not probable as a single base case. Where you land on those assumptions, specifically and honestly, is the hinge point for how much Alphabet to hold.
What the business has built is genuinely impressive. The harder question is how much of that achievement is already embedded in a $4 trillion valuation, and only your honest assessment of each specific assumption can resolve it.
This article is for informational purposes only and should not be considered financial advice. Investors should conduct their own research and consult with financial professionals before making investment decisions. Past performance does not guarantee future results. Financial projections are subject to market conditions and various risk factors.