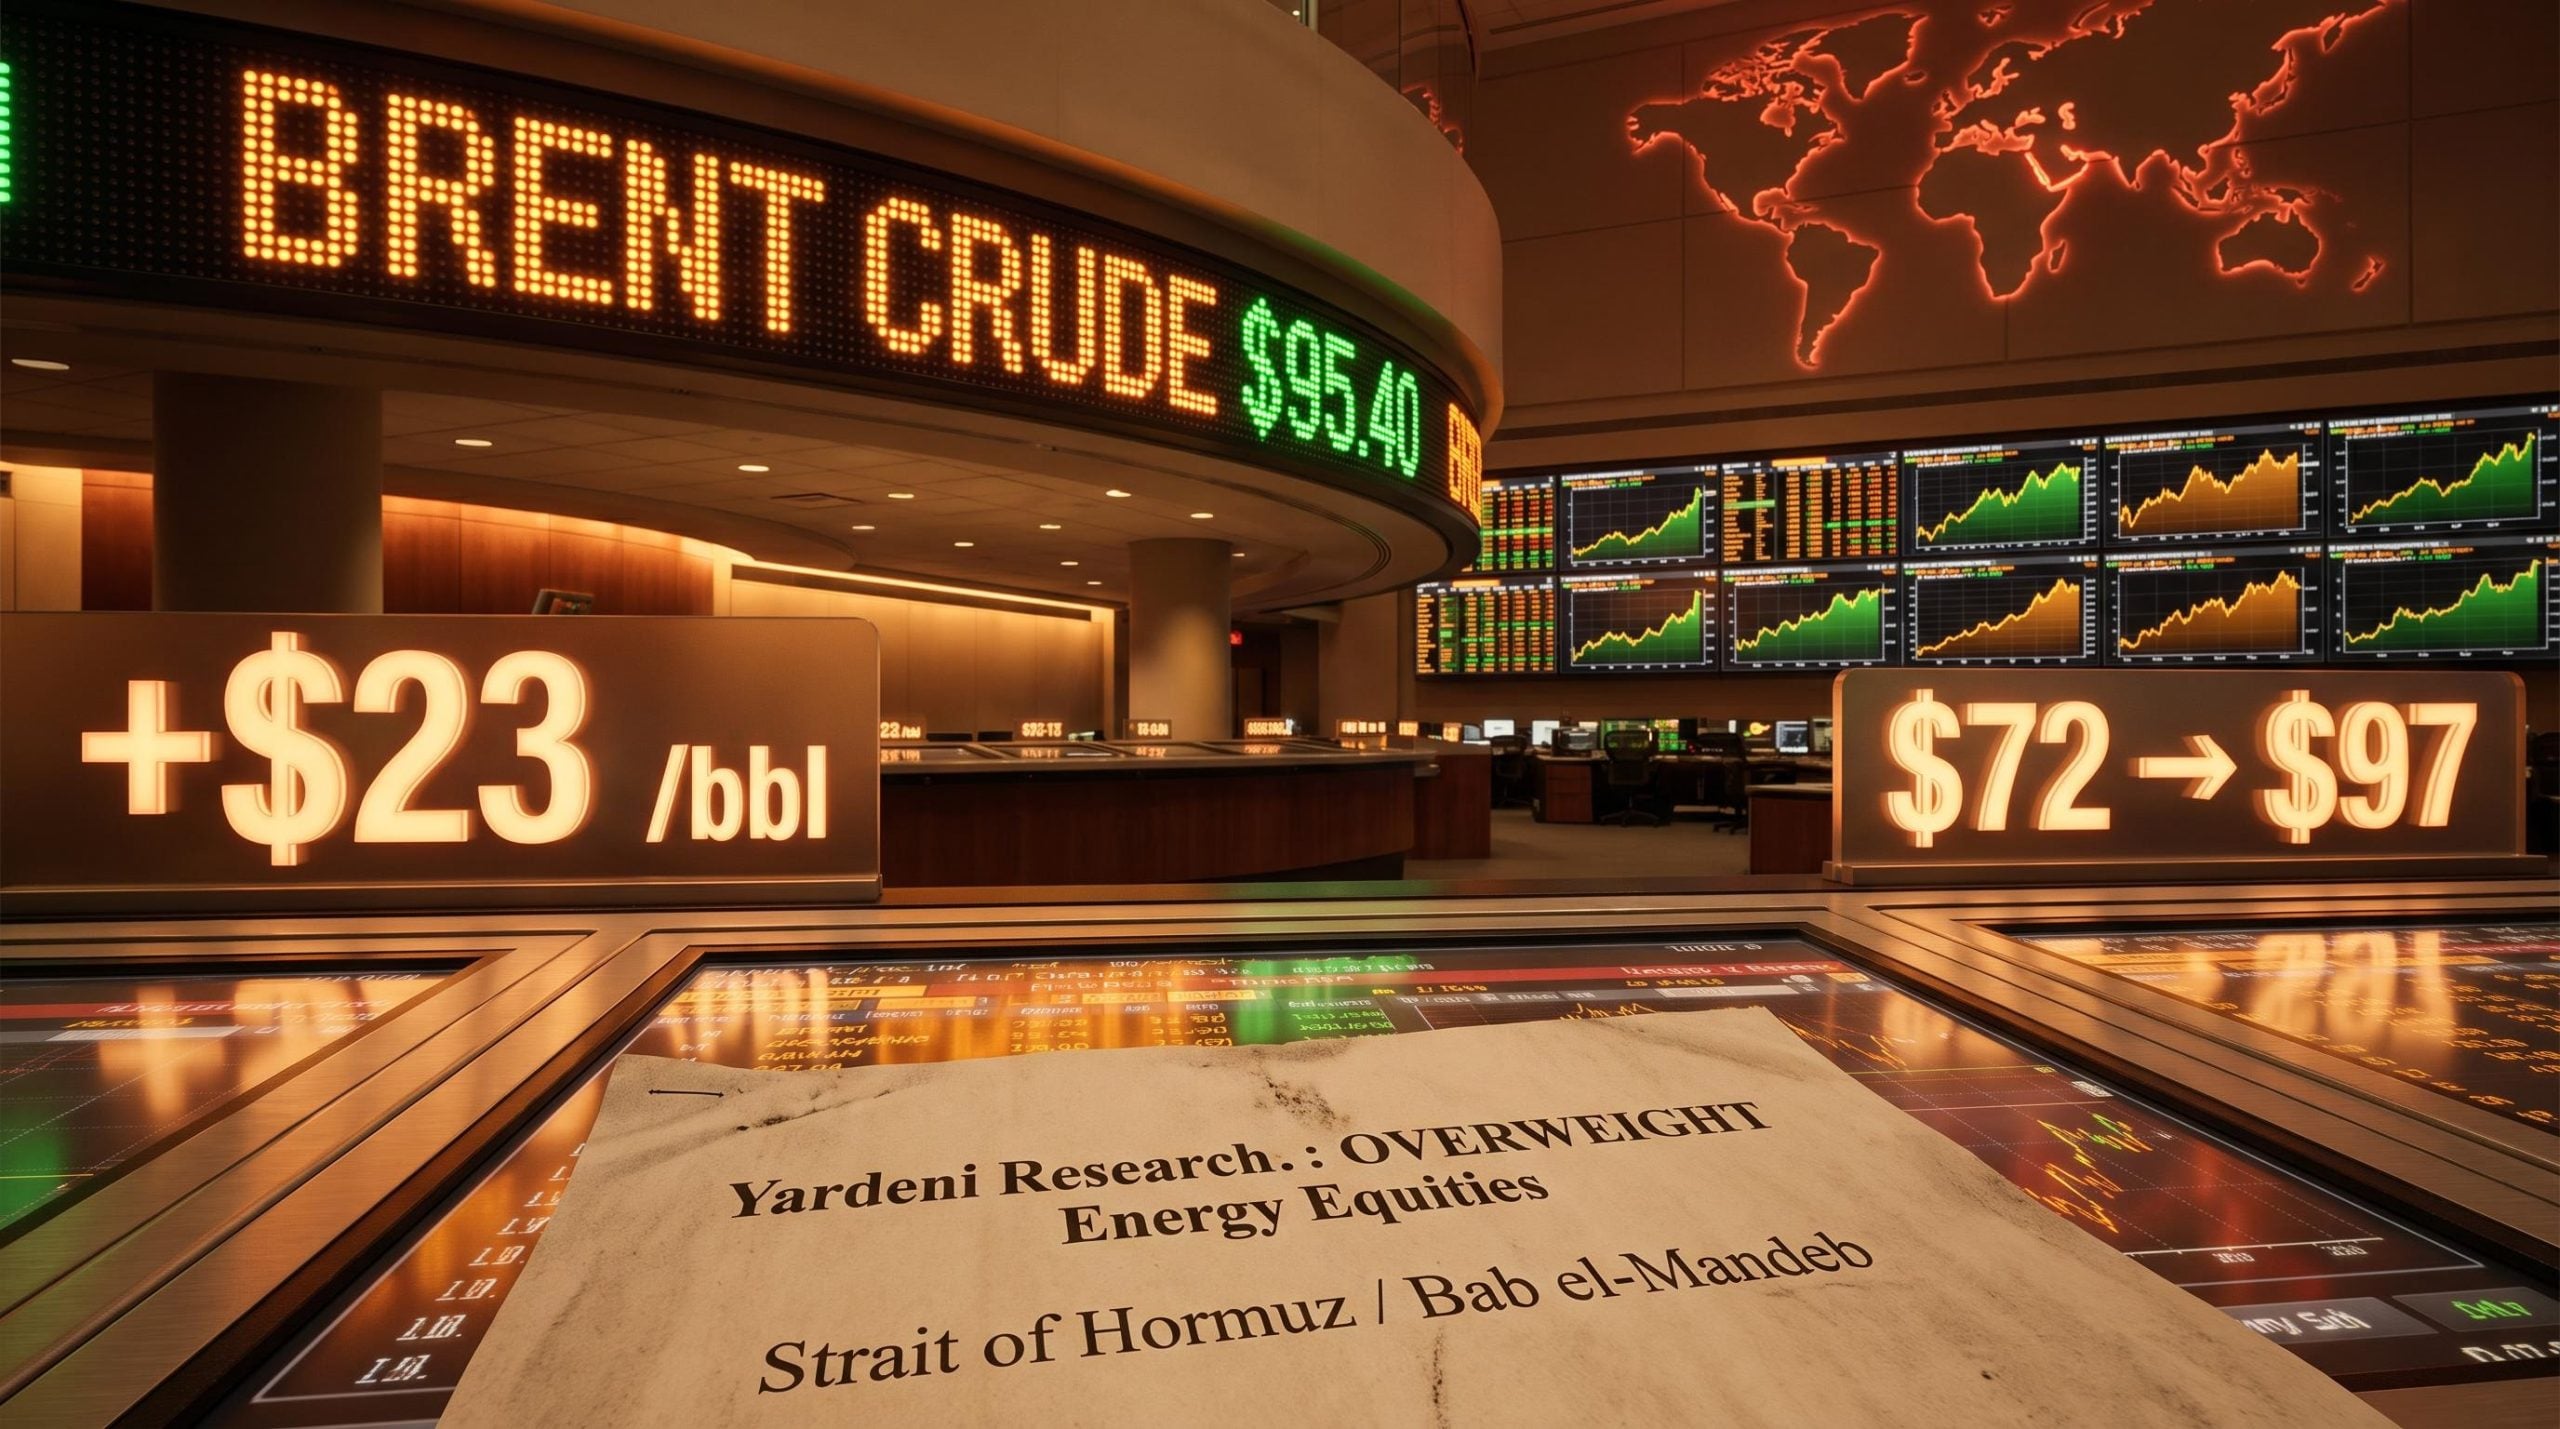
Brent crude has recovered more than $23 per barrel in under two months, climbing from roughly $72 in June 2026 to approximately $95 by late July 2026, with intraday readings touching $97-$98. The driver is not demand. It is geography.
Two of the world’s most critical oil transit chokepoints, the Strait of Hormuz and the Bab el-Mandeb, are simultaneously under geopolitical pressure. Houthi forces have declared a naval blockade against Saudi Arabia. The U.S.-Iran conflict has raised the probability of supply disruption across key production hubs. Analysts are openly using the word stagflation again, and central banks that had hoped to cut are watching the energy component of inflation reassert itself independently of anything demand-side policy can control.
Here is why this specific configuration of risks changes the calculus for portfolio positioning, and why Yardeni Research has placed an overweight on energy equities, viewing the sector as a dual-purpose instrument capable of hedging inflation while absorbing the impact of geopolitical shocks. The analysis covers the mechanics of how oil prices transmit into broader inflation, why energy stocks sit on the right side of that transmission, and what practical exposure choices look like along the energy value chain.
From $72 to $97: what the oil rally is actually telling you
The speed of the move matters as much as the direction. Brent crude fell to approximately $72 per barrel in June 2026, a level that priced in a fragile ceasefire and fading risk appetite. Six weeks later, crude is trading around $95, with intraday prints toward $97-$98, the highest since May. That is not a demand recovery. It is a risk premium being rebuilt in real time.
Brent crude recovered from approximately $72 in June 2026 to $95-$98 by late July 2026, its highest levels since May.
What makes this repricing structurally different from earlier false starts is the simultaneity. Two chokepoints are under active pressure at the same time:
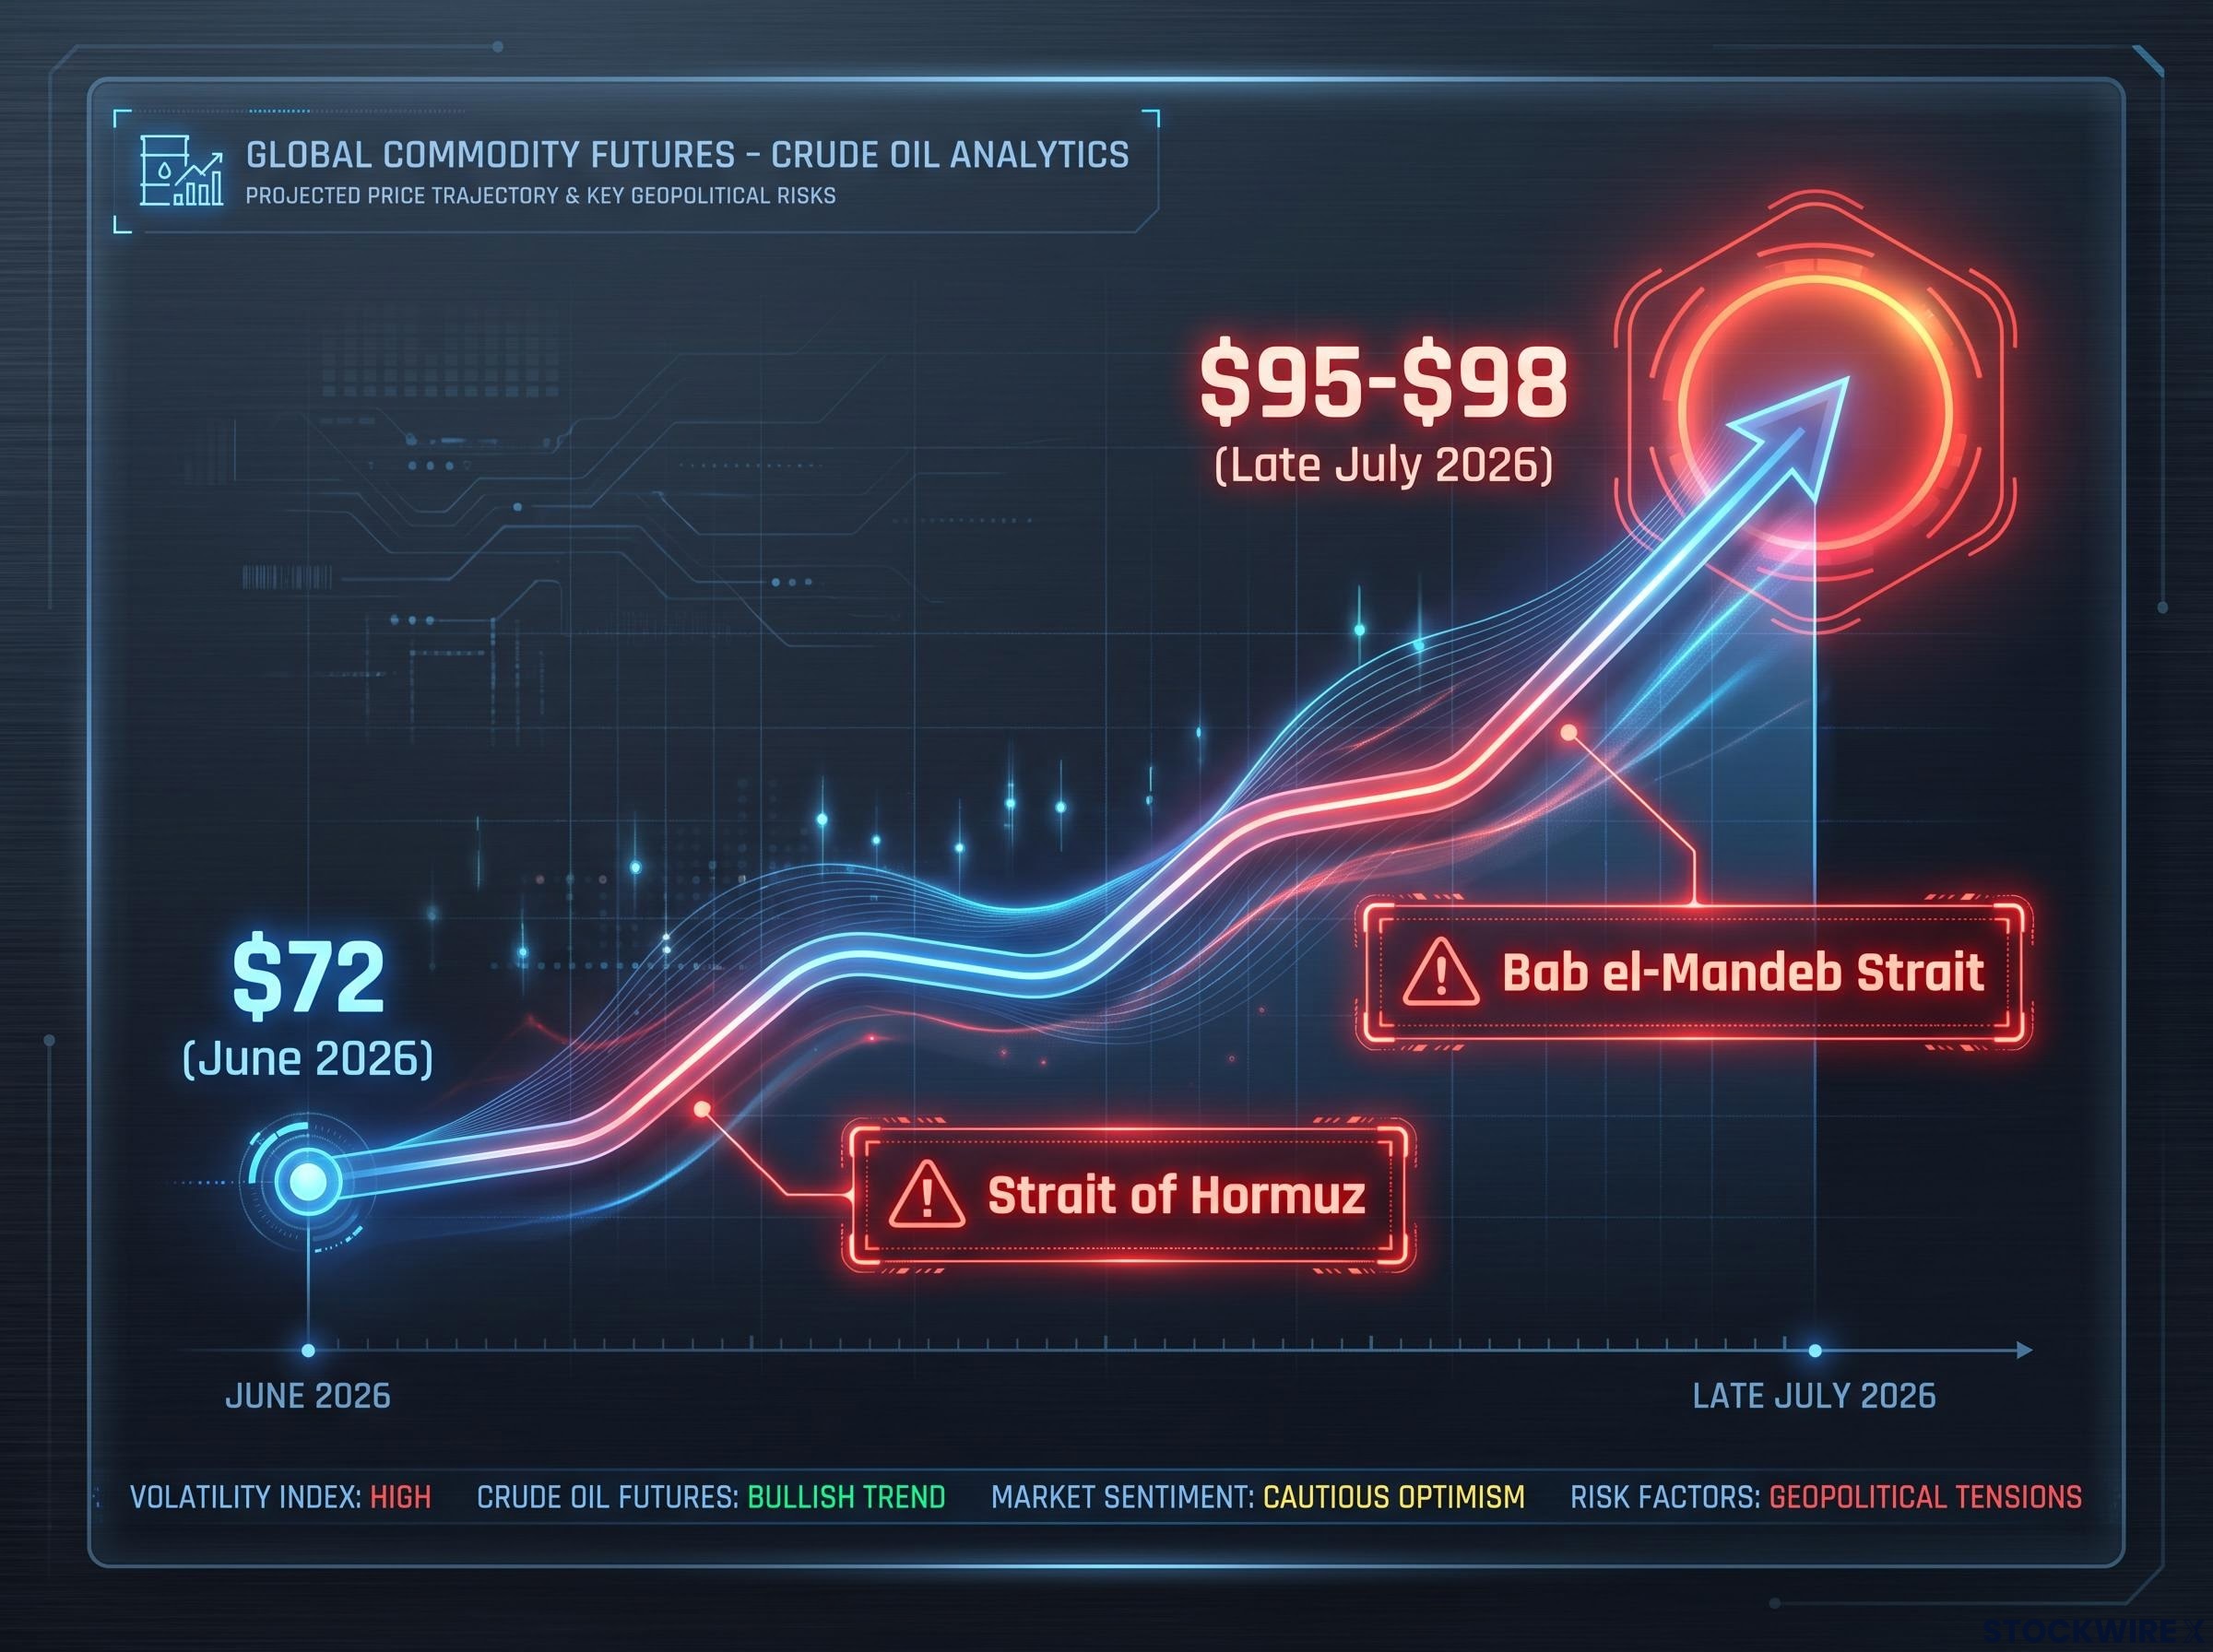
- Strait of Hormuz: The narrow waterway through which roughly a fifth of global oil supply transits daily. The U.S.-Iran conflict has raised the probability of sustained disruption to tanker traffic and regional production infrastructure.
- Bab el-Mandeb Strait: The chokepoint connecting the Red Sea to the Gulf of Aden. Houthi forces have declared a naval blockade against Saudi Arabia and threatened shipping, including Saudi oil tankers, transiting the strait.
One chokepoint under pressure is a headline. Two under concurrent stress is a supply architecture problem. Yardeni Research and other major institutions are treating the persistence of these risks as the baseline scenario, not the tail risk. That distinction is what separates a temporary spike from a rally with structural staying power, and it shapes how long any portfolio positioned around it needs to hold.
The Hormuz risk premium has structural staying power beyond any single diplomatic exchange; the near-total withdrawal of commercial war-risk insurance effectively closed the strait to standard commercial traffic even during periods when physical passage was technically possible, creating a supply architecture constraint that persists well after headline tensions subside.
When big ASX news breaks, our subscribers know first
How an oil spike becomes an inflation problem across the whole economy
Oil does not stay in the oil market. It migrates into the price of nearly everything, and it does so through channels that monetary policy cannot easily reach.
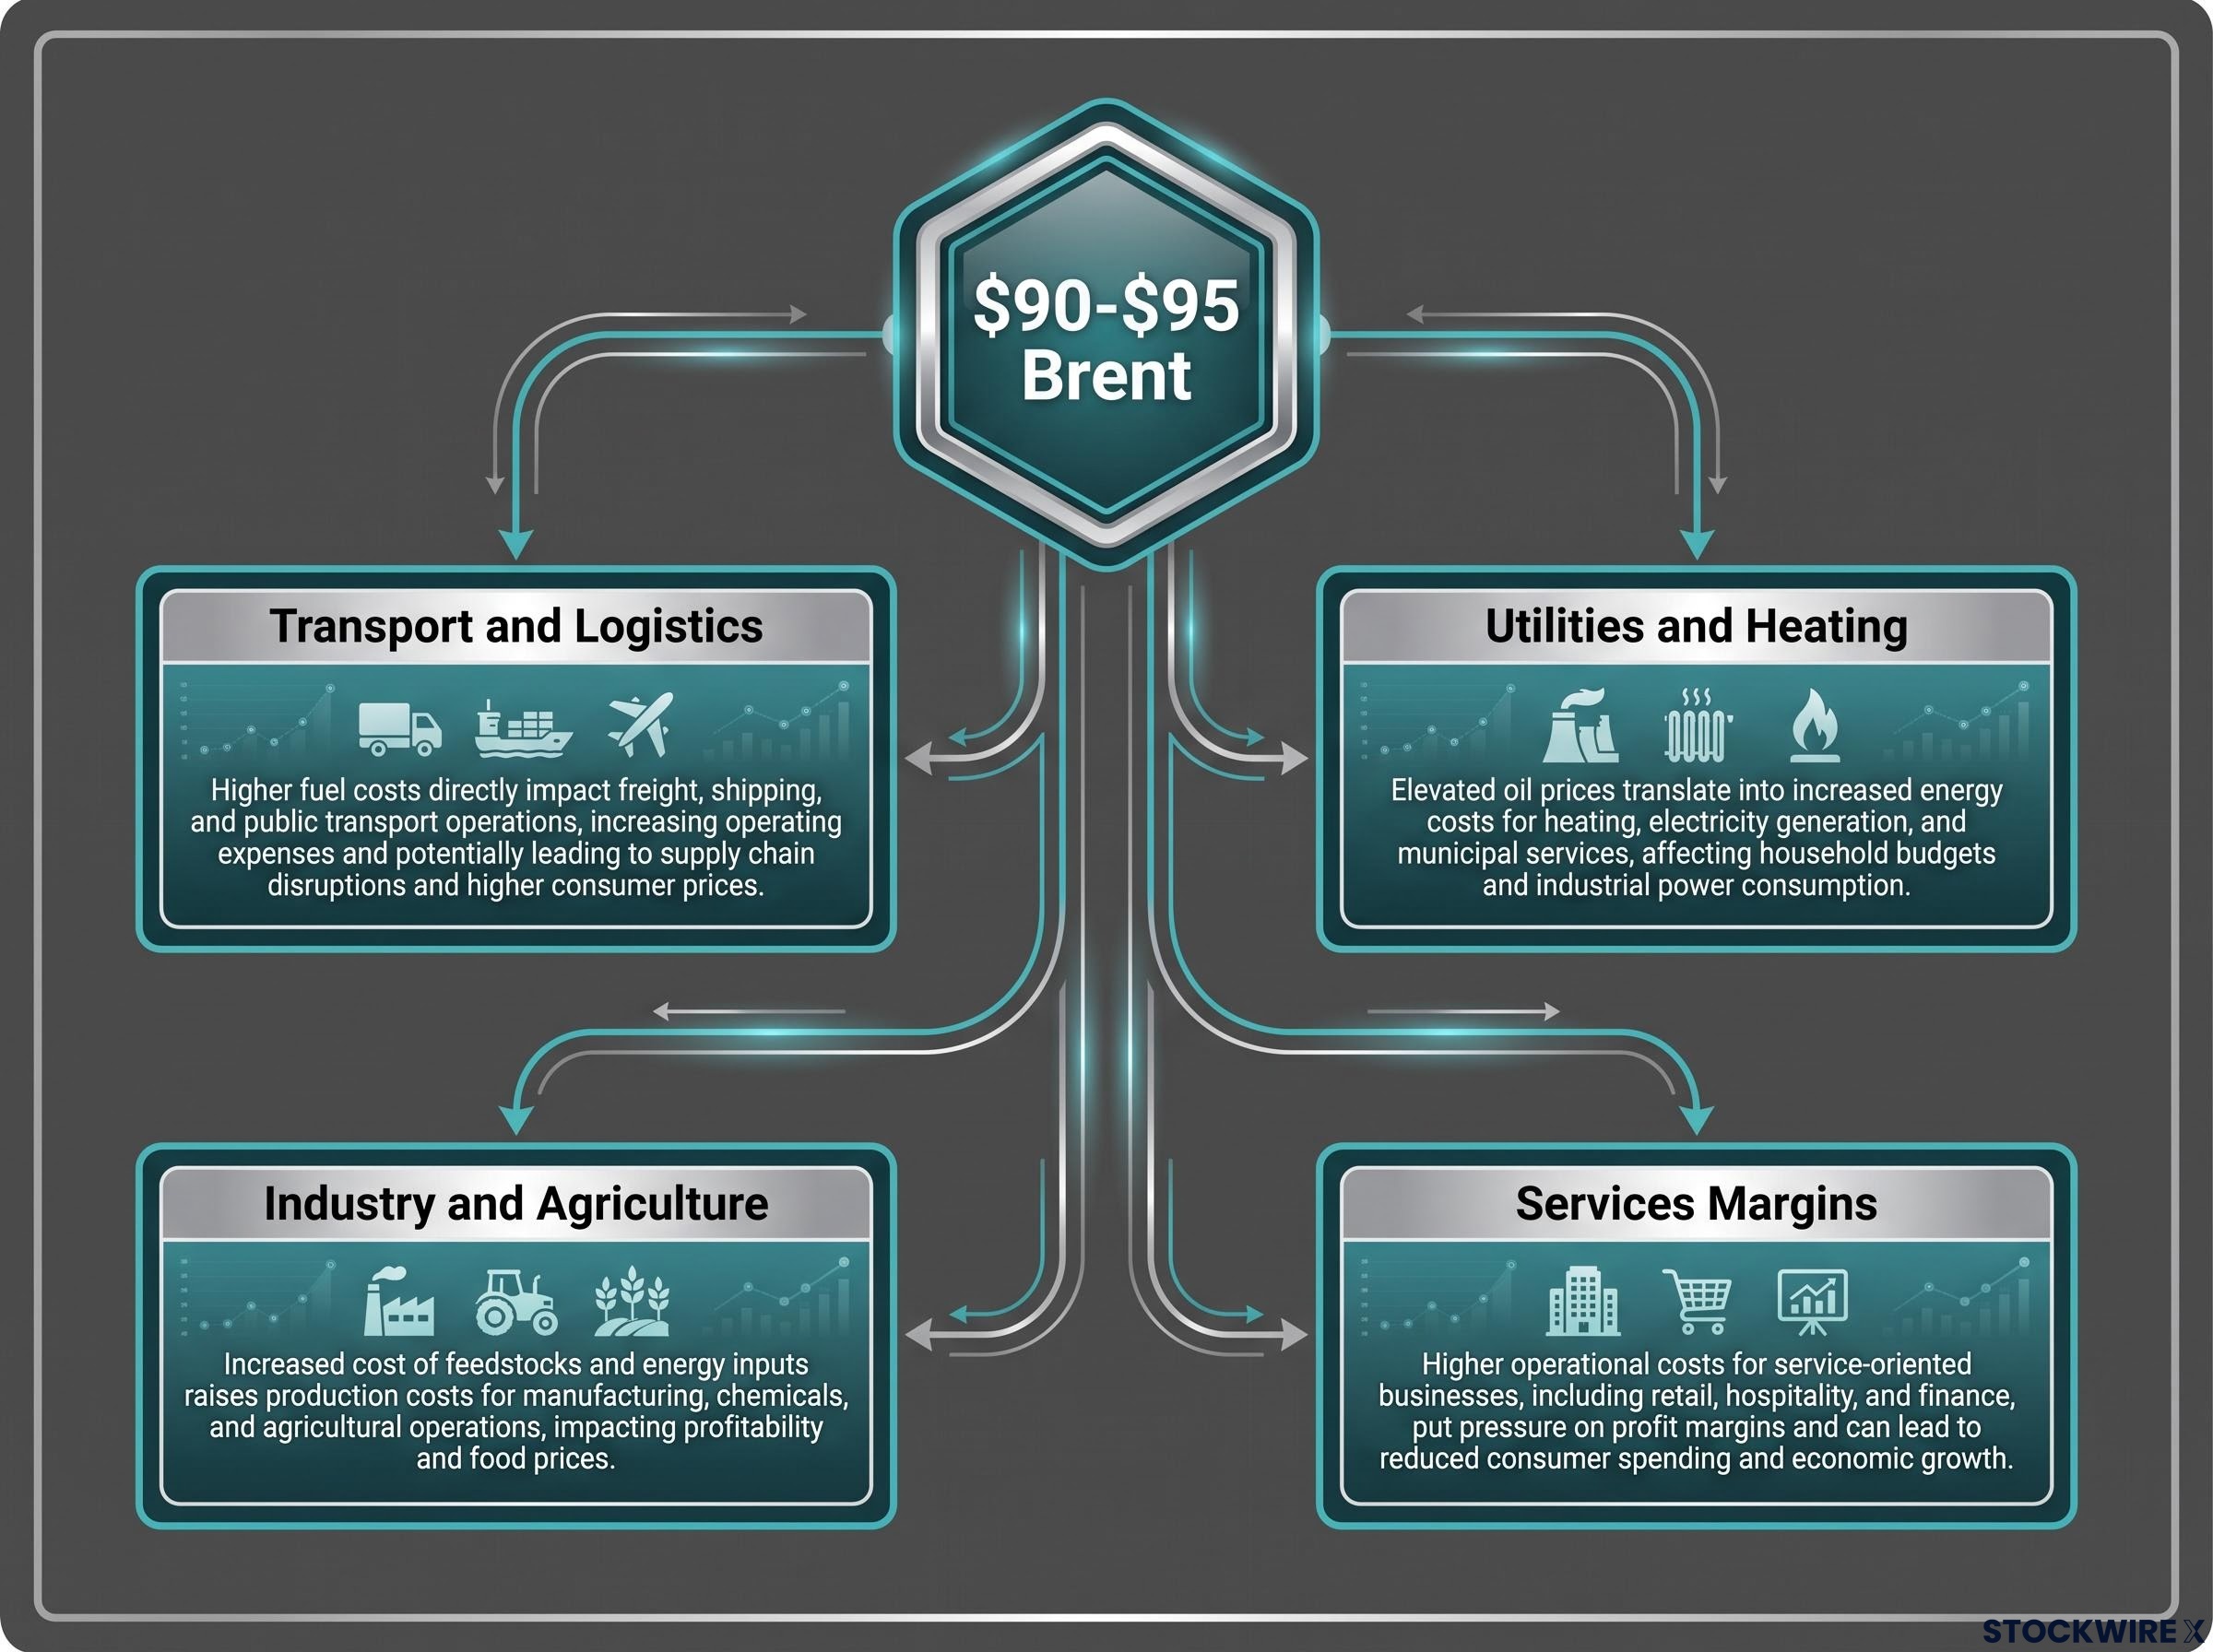
The transmission runs through four main paths. Each one compounds the others.
| Transmission Channel | Mechanism | Inflation Effect |
|---|---|---|
| Transport and Logistics | Fuel is a major input cost for trucking, shipping, and aviation. Higher crude raises freight costs across the supply chain. | Freight cost increases are built into the delivered price of nearly every physical good. |
| Utilities and Heating | Higher fossil fuel prices translate directly into electricity, gas, and heating bills across multiple economies. | Household energy costs rise, compressing budgets and lifting measured CPI. |
| Industry and Agriculture | Energy is a core input for industrial production and fertiliser manufacturing. Fuel powers farm equipment. | Manufacturing and food production cost bases rise simultaneously. |
| Services Margins | Airlines, industrials, and other energy-intensive service sectors face margin compression and often respond with price increases. | Inflation migrates from goods into services, making it more persistent and harder to dismiss. |
Each channel on its own is manageable. Together, at $90-$95 Brent and above, they amount to a broad-based inflationary impulse that central banks cannot solve with interest rate policy. Rate hikes suppress demand. They do nothing about a supply shock originating at a maritime chokepoint.
The indirect transmission channel, where elevated energy costs flow through logistics, agriculture, and manufacturing on a 6-12 month lag, means the full inflationary weight of sustained $90-$95 Brent has not yet appeared in CPI data, making the current inflation readings an understatement of the pressure still building through the pipeline.
Analysts warn that Brent holding above $90-$95 is reviving stagflationary shock fears: higher inflation combined with weaker growth, driven by supply constraints that central banks cannot target.
If you hold a bond-heavy or cash-heavy portfolio, the implication is direct. The inflation protection those assets are expected to provide depends on central banks cutting rates or inflation declining on its own. When the energy component re-accelerates independently of demand conditions, neither pathway is available. Rate-cutting windows narrow or close entirely.
Why energy equities sit on the right side of the inflation shock
The problem the previous section outlined is the same dynamic that makes energy equities structurally attractive in this environment. Owning energy equities is, in structural terms, owning a piece of the mechanism generating the inflation that is eroding the real value of bonds and cash elsewhere in the portfolio.
The logic rests on four features that work together:
NBER research on asset classes as inflation hedges finds that an energy inflation shock is associated with a 4.0 percent increase in energy sector returns, providing empirical grounding for the structural case that owning energy equities during a supply-driven price surge is a genuine hedge rather than a correlated bet.
- Direct commodity leverage: Energy producers’ revenues and operating cash flows rise with the same crude price that compresses consumer purchasing power and lifts inflation readings. The relationship is direct, not lagged.
- Positive correlation with energy-driven inflation: Energy is a major component of headline inflation baskets. When energy prices are the dominant driver of a CPI upside surprise, energy producers are among the few equity segments that benefit from the shock rather than absorbing it.
- Geopolitical risk premium persistence: As long as Hormuz and Bab el-Mandeb remain under pressure, the risk premium embedded in oil prices gives energy sector earnings and valuations a structural tailwind tied directly to the uncertainty investors want to hedge against.
- Dividend and buyback carry cushion: Many large-cap energy companies entered this phase with strong balance sheets and robust capital-return programmes, often paying above-market dividend yields and running sizable buyback programmes. Even if crude stabilises rather than climbs further, those payouts provide a floor under total returns.
The operating leverage dynamic sharpens the case. Many integrated majors and upstream producers built their 2026 budgets around $75-$80 oil. With Brent sustaining at $95-$97, the gap between the planning baseline and the realised price generates material earnings and free cash flow upgrades that were not in consensus estimates.
Yardeni Research frames its overweight recommendation around precisely this logic: energy equities function simultaneously as an inflation hedge and a geopolitical shock absorber because the same price action that damages the rest of the portfolio feeds directly into energy sector cash flows.
Mapping exposure along the energy value chain
An energy overweight is not a monolithic bet. The energy sector contains distinct segments, each with a different relationship to the crude price and a different role in a portfolio. The choice of where to take exposure is itself a portfolio decision.
| Segment | Brent Price Sensitivity | Defensive Characteristic |
|---|---|---|
| Integrated Majors | Moderate; diversified across upstream, refining, and chemicals | Strong cash-return policies, diversified revenue streams |
| Upstream Producers | High; the most direct leverage to Brent crude moves | Limited diversification, higher volatility |
| Oilfield Services | Moderate to high; tied to drilling activity and capital expenditure cycles | Benefits from sustained activity, not just price spikes |
| Midstream and Pipelines | Low; fee-based cash flows with less direct commodity sensitivity | Steadier income, lower volatility, more defensive profile |
| Sector ETFs | Moderate; blended exposure across the value chain | Diversification without individual-stock concentration risk |
Upstream exposure is the higher-conviction, higher-volatility bet on Brent. If crude moves from $95 to $110, upstream producers capture the most upside. Midstream is a more defensive carry play: lower sensitivity to spot prices, steadier fee-based revenues, and less downside if crude pulls back.
Sector ETFs provide inflation hedge exposure across the energy value chain without concentrating risk in a single company or sub-sector.
Neither option is generically right. The choice depends on whether you are hedging against further escalation (upstream) or building a steadier inflation-correlated income stream (midstream), or blending the two through broad sector ETF exposure.
What can go wrong with an energy overweight
The overweight logic is sound in this environment. It is not bulletproof. Three risk categories deserve attention before sizing any position:
- Government policy responses. Governments have levers. Strategic petroleum reserve releases can cap extreme upside in crude prices and, by extension, producer earnings. Windfall tax changes are a jurisdiction-specific risk that can redirect cash flows away from shareholders. Export restrictions can alter the supply dynamics that support the premium. None of these eliminate the hedge, but they can compress its upside.
Strategic petroleum reserve releases have proven insufficient to offset disruptions at this scale: IEA and SPR releases totalling approximately 280 million barrels failed to halt inventory drawdowns running at more than double the previous record pace, confirming that government policy levers are a price ceiling, not a supply solution, when physical chokepoint constraints are this severe.
- Demand destruction. Very high sustained oil prices eventually moderate their own effectiveness as a hedge. At some threshold, consumers and businesses reduce consumption, industrial activity slows, and the demand destruction itself lowers crude prices. History shows this is a lagging effect, but it is a real constraint on how long an extreme overweight remains optimal.
- Accelerated energy transition investment. Sustained high fossil fuel prices tend to accelerate capital flows into alternative energy sources and efficiency technologies. Over a longer time horizon, this can erode the structural risk premium embedded in oil prices, reducing the hedging value of traditional energy equities.
These are not reasons to avoid the overweight. They are reasons to treat it as a dynamic hedge rather than a permanent unconditional long position. Sizing, time horizon, and monitoring conditions matter as much as the direction of the bet. For a reader building a serious portfolio position, understanding these constraints is what distinguishes an informed overweight from a momentum trade.
What this environment is actually asking your portfolio to do
The analytical case across the preceding sections reduces to a single portfolio construction principle: in an environment where energy prices are the primary source of inflationary pressure and the primary vector of geopolitical risk, owning the assets that benefit from that pressure is not a speculative bet. It is a structural hedge.
Yardeni Research’s overweight recommendation reflects this dual role. Energy equities function as inflation hedge because their cash flows rise with the same price that lifts CPI. They function as geopolitical shock absorber because escalation at Hormuz or Bab el-Mandeb directly supports the earnings of the companies you hold.
The scenario asymmetry favours the position:
- Escalation path: Shipping routes face sustained disruption, crude pushes higher, and energy equities outperform meaningfully as the rest of the portfolio absorbs inflationary damage.
- De-escalation path: Tensions ease, crude drifts lower, and energy equities likely underperform, but dividends and buybacks cushion the downside, making the cost of having held the hedge relatively modest.
The specific configuration of late July 2026, Brent recovering from $72 to $95-$98, two chokepoints under simultaneous pressure, stagflation warnings live from major institutions, is precisely the environment where the hedging logic is most credible. The question is not whether to hold energy equities. It is how much overweight is appropriate given your specific portfolio context, and whether you are positioned before the risk fully resolves or after.
For investors exploring how portfolio positioning should evolve if diplomatic resolution materialises, our full explainer on the barbell strategy for an oil-down rotation examines how pairing AI and technology exposure with Old Economy cyclicals positions a portfolio to capture the sector rotation that historically follows sustained crude price declines.
This article is for informational purposes only and should not be considered financial advice. Investors should conduct their own research and consult with financial professionals before making investment decisions. Past performance does not guarantee future results. Financial projections are subject to market conditions and various risk factors.