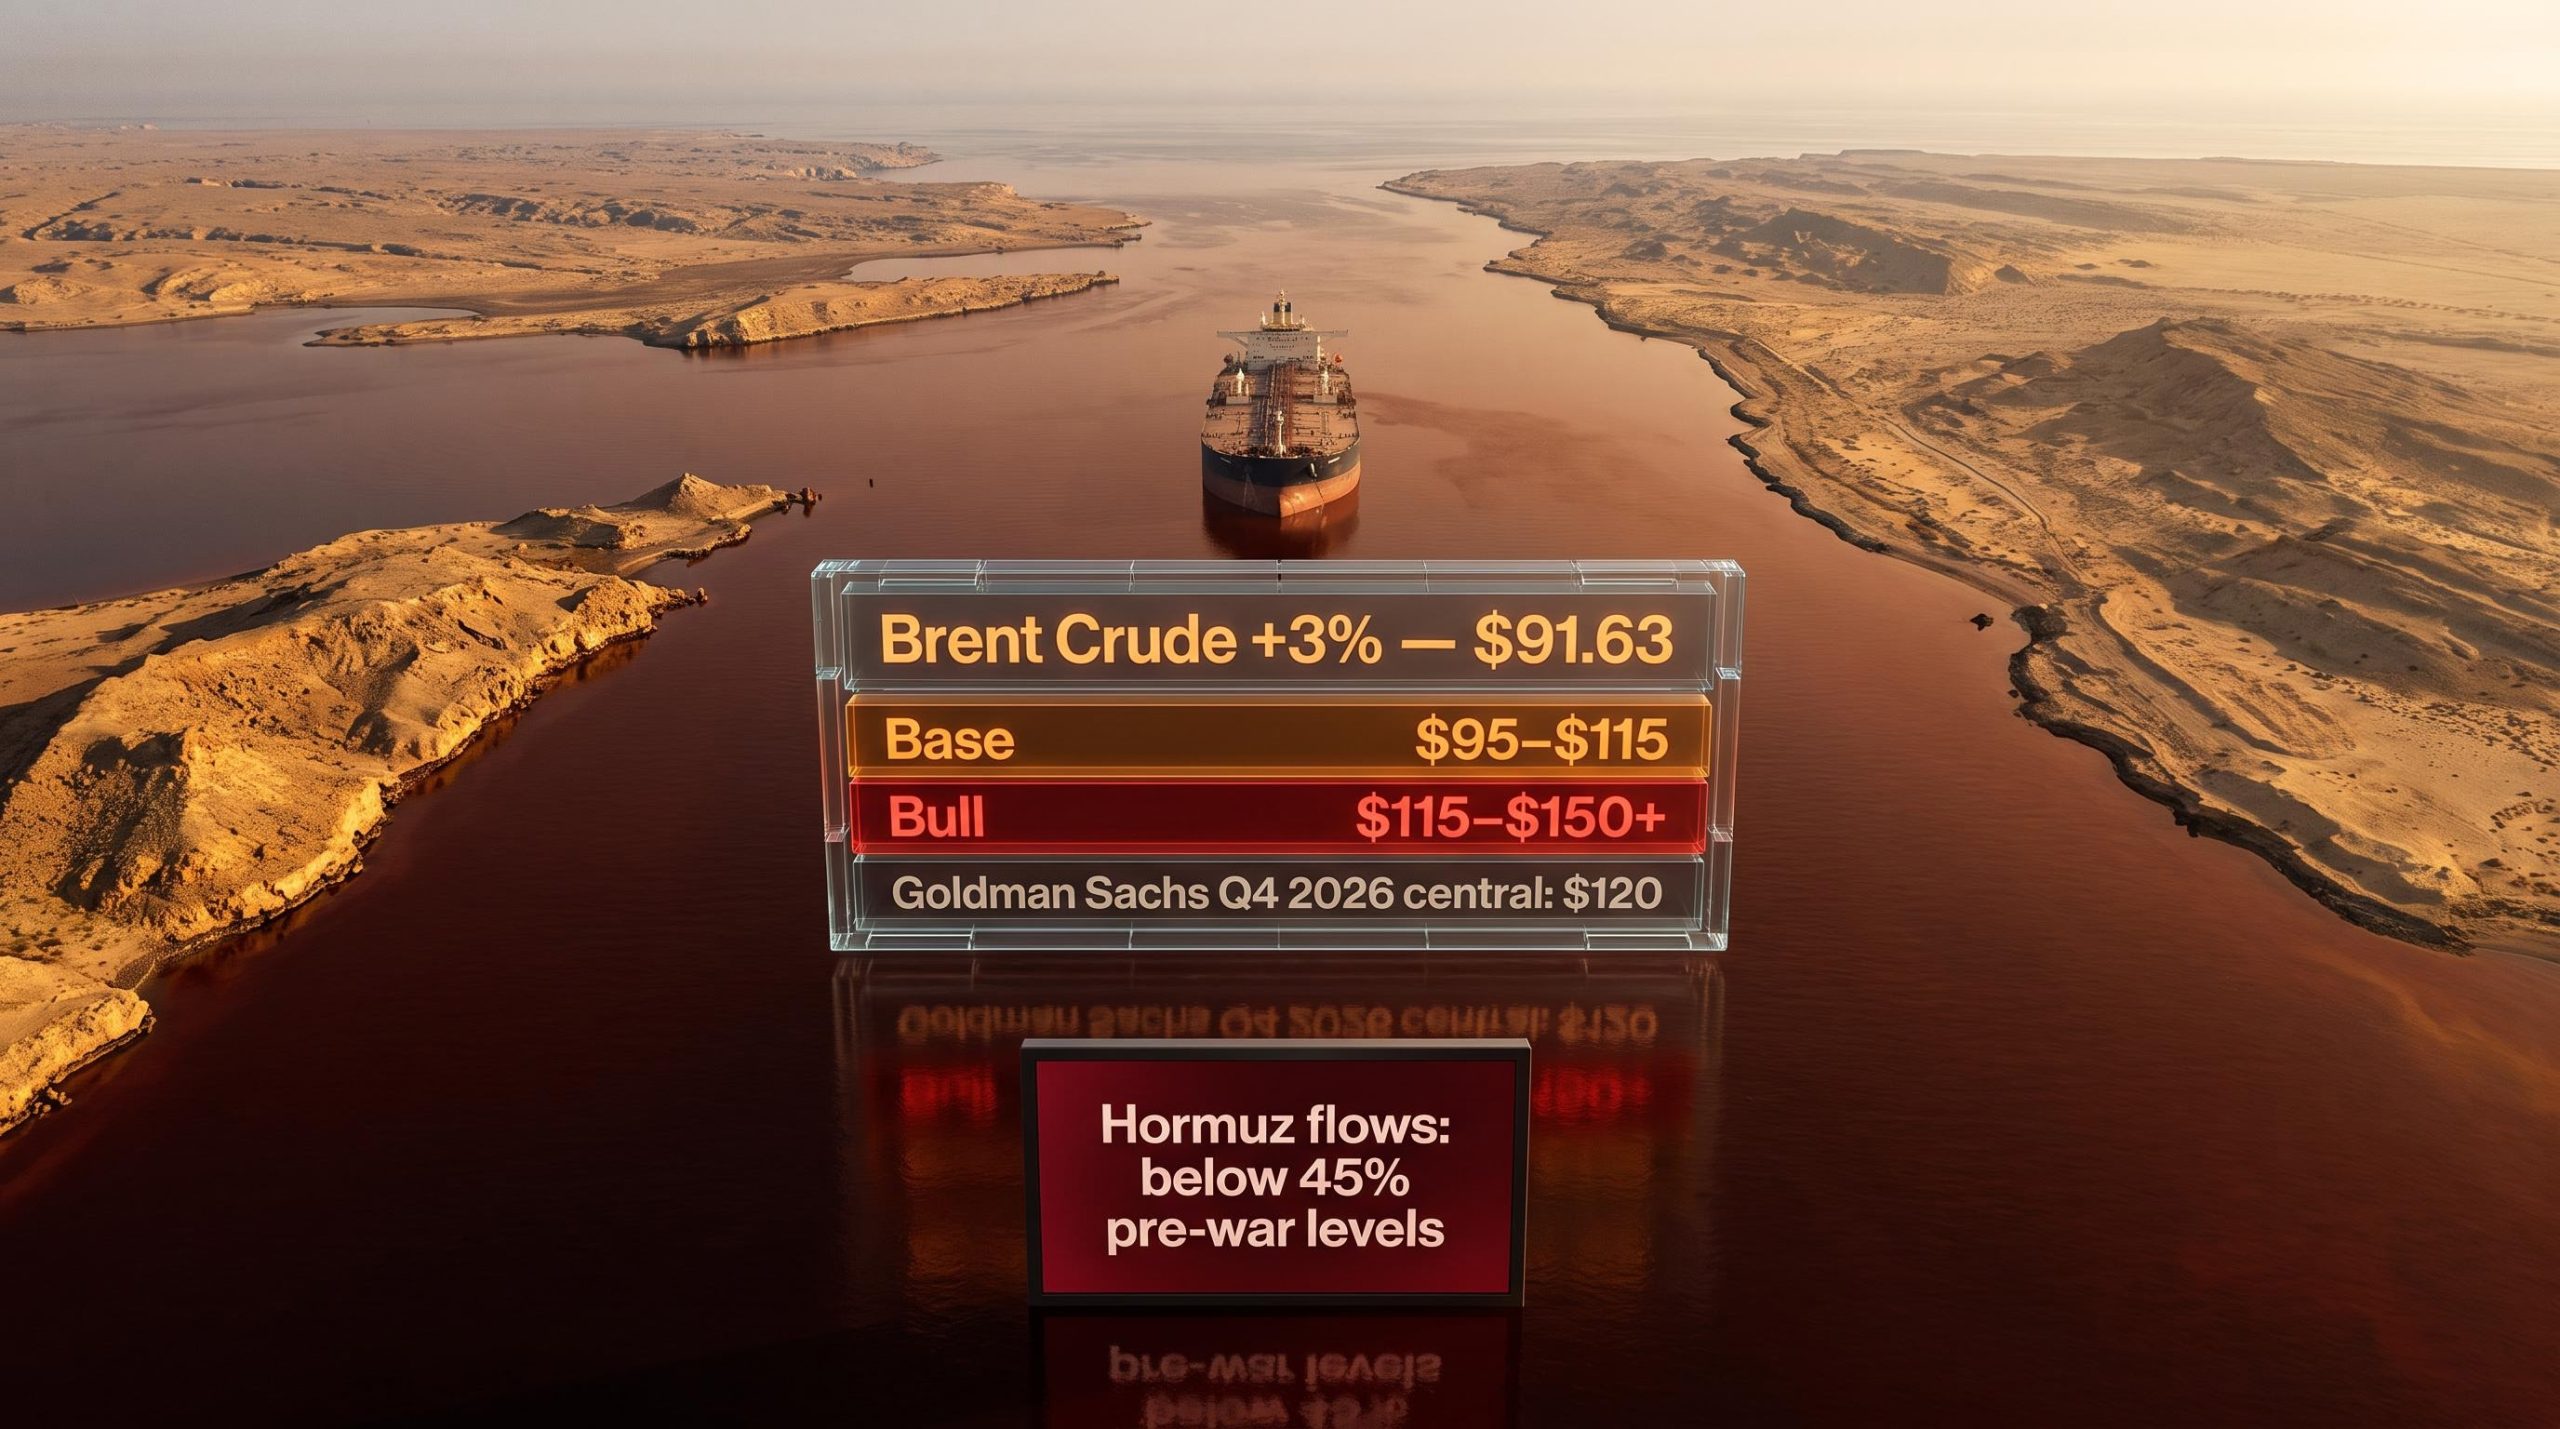
Brent crude posted a 3% advance in overnight trading on 22 July 2026, reaching $91.63 per barrel following US military strikes on Iran. Sharp as that move is, it is not the story.
The story is what it confirms about where prices could go from here. The geopolitical stack is unprecedented in modern oil markets: direct US-Iran military confrontation, a Houthi naval blockade threat targeting Saudi exports, and Hormuz traffic already running well below half its pre-war capacity. Goldman Sachs and other major institutions are now treating $120 Brent as a plausible adverse/upside scenario for Q4 2026, not a tail scenario. Global oil inventories, described by Reuters as “perilously low,” have removed the buffer that historically cushioned markets against sustained supply tightness.
Here is what the data actually tells you about how serious this oil price shock risk is, and what that means for energy prices through the end of 2026. What follows is a breakdown of the mechanism, the institutional scenario range, and the five specific variables that determine whether $120 becomes a floor or a ceiling.
What just happened in the Gulf, and why markets moved the way they did
US military strikes hit Iran on 21 July 2026. Iran’s president characterised the situation as full-scale war. Within hours, Yemen’s Houthi movement threatened to impose a naval blockade on Saudi Arabia. The overnight market response was immediate:
- Brent crude: +3% to $91.63 per barrel
- WTI crude: +2.26% to $84.34 per barrel
- Prior April peak: Brent hit approximately $119.50 intraday in early April 2026, with a wartime peak near $120 in late April and intraday touches to $126
- Q2 2026 context: Brent spent much of the second quarter at or above $100
Iran’s president characterised the situation as full-scale war, a framing that removes the ambiguity markets typically rely on to price in a diplomatic resolution.
The price action matters less than what it confirms. US officials signalled limited enthusiasm for ceasefire terms, and intelligence assessments suggested Iran was unlikely to change posture. That combination means markets cannot price in a near-term diplomatic off-ramp.
The prior April spike is no longer being treated as an aberration. It is being treated as a preview. For anyone watching Brent tick upward by 3% in a single session, the question is not whether this reflects temporary panic; it is whether the conflict pattern that produced $120 in April is now structural.
When big ASX news breaks, our subscribers know first
The Hormuz chokepoint: why 20% of global oil flows through one narrow strait
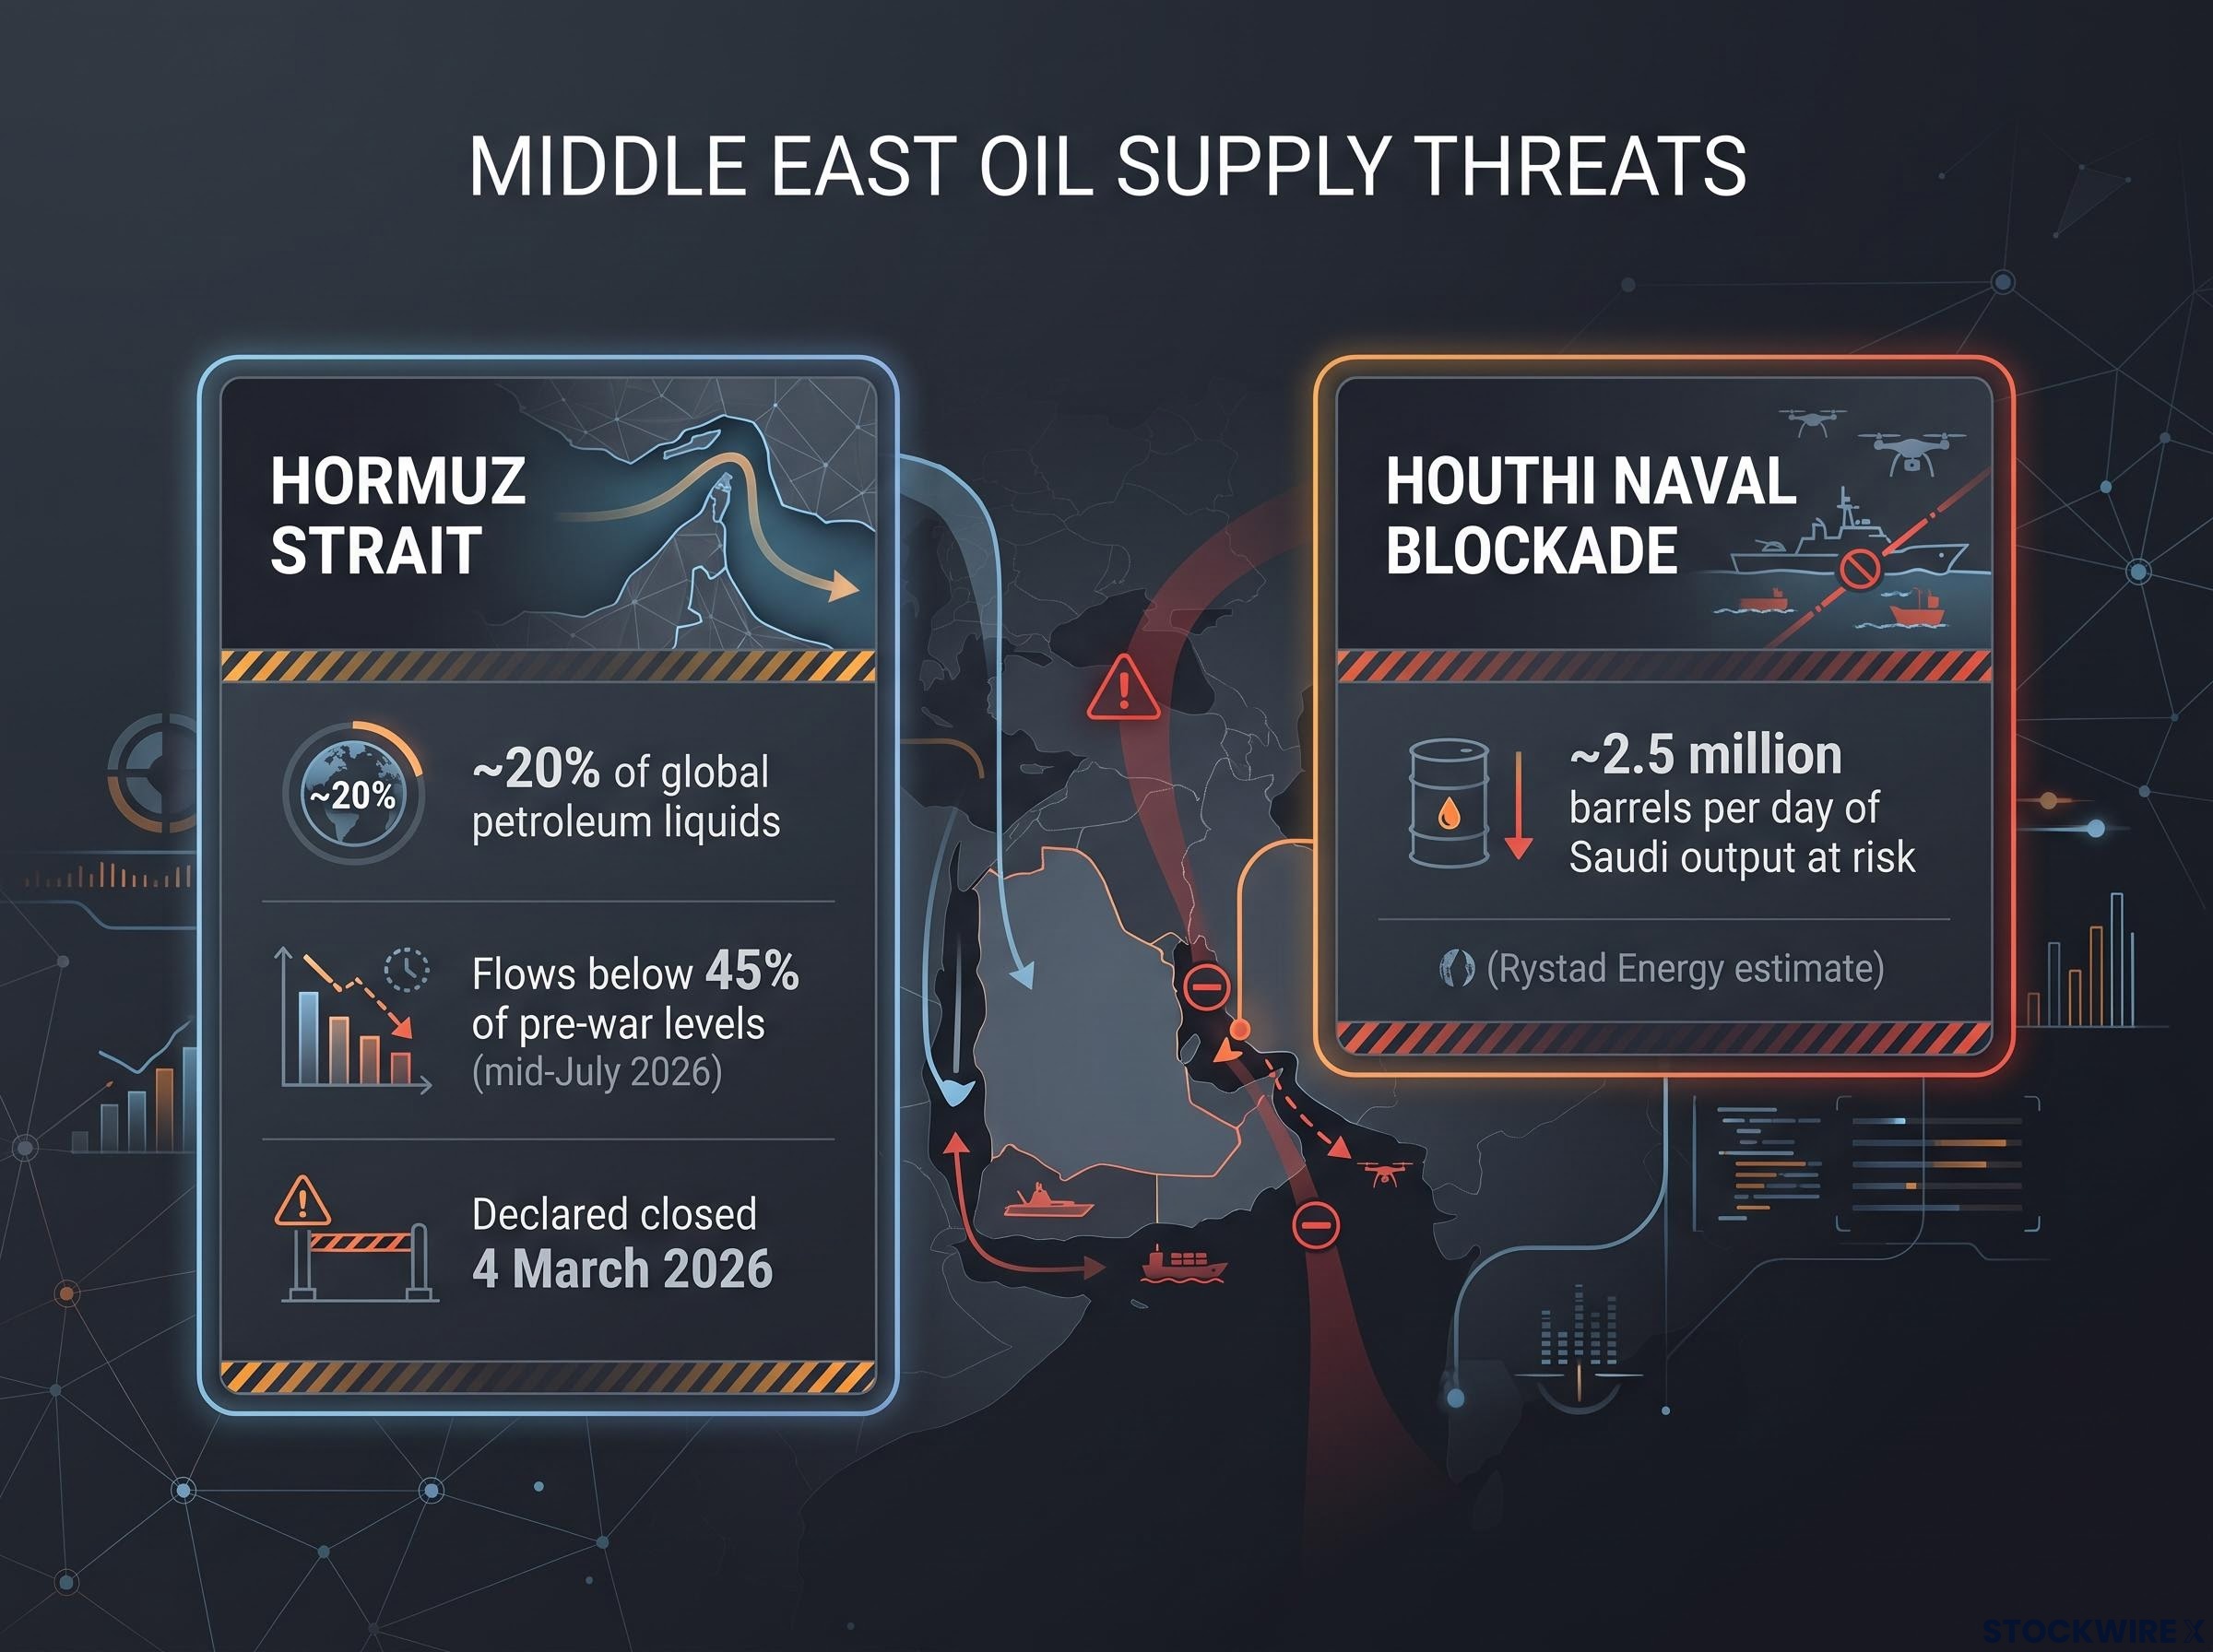
Approximately 20% of the world’s petroleum liquids transit the Strait of Hormuz, which is a narrow waterway between Iran and Oman through which most crude exports from Saudi Arabia, the UAE, Kuwait, Iraq, and Iran must pass. It is the single most critical oil shipping chokepoint on the planet.
The strait was declared closed starting 4 March 2026, with Iran targeting civilian vessels and energy facilities. During the most acute phase from March through April, tanker traffic collapsed, producers were forced to cut output as storage capacity filled, and significant volumes of crude supply were physically removed from the market.
The 57% price surge Brent recorded between late February and mid-May 2026 was driven almost entirely by the effective closure of Hormuz, with the EIA modelling Gulf production shut-ins peaking near 10.8 million barrels per day, a scale that existing bypass pipeline infrastructure could not come close to replacing.
| Threat Vector | Supply at Risk | Status |
|---|---|---|
| Hormuz strait disruption | ~20% of global petroleum liquids | Flows below 45% of pre-war levels as of mid-July 2026 |
| Houthi naval blockade threat | ~2.5 million barrels per day of Saudi output (Rystad Energy estimate) | Threat declared; operational capability demonstrated in Red Sea |
For anyone holding energy equities or commodity-linked assets, this is not a theoretical supply threat. Barrels are already missing from global markets. The question is how many more disappear if the conflict intensifies.
The Houthi dimension: Saudi export risk as a second pressure point
According to Rystad Energy, a Houthi naval blockade would place roughly 2.5 million barrels per day of Saudi production at risk. The Houthis have already demonstrated sustained capability to hit maritime targets in the Red Sea, forcing rerouting and driving insurance premia sharply higher. Markets treat their threats as operationally credible.
Analysts warn that a direct hit on Abqaiq, the world’s largest crude processing plant in Saudi Arabia, could push Brent past $150. This is node risk: markets are pricing not just transit vulnerability through Hormuz but the vulnerability of the processing and export hubs themselves. Two chokepoints, layered on top of each other, in the same conflict theatre.
The $95 to $150 scenario range: where the major banks actually stand
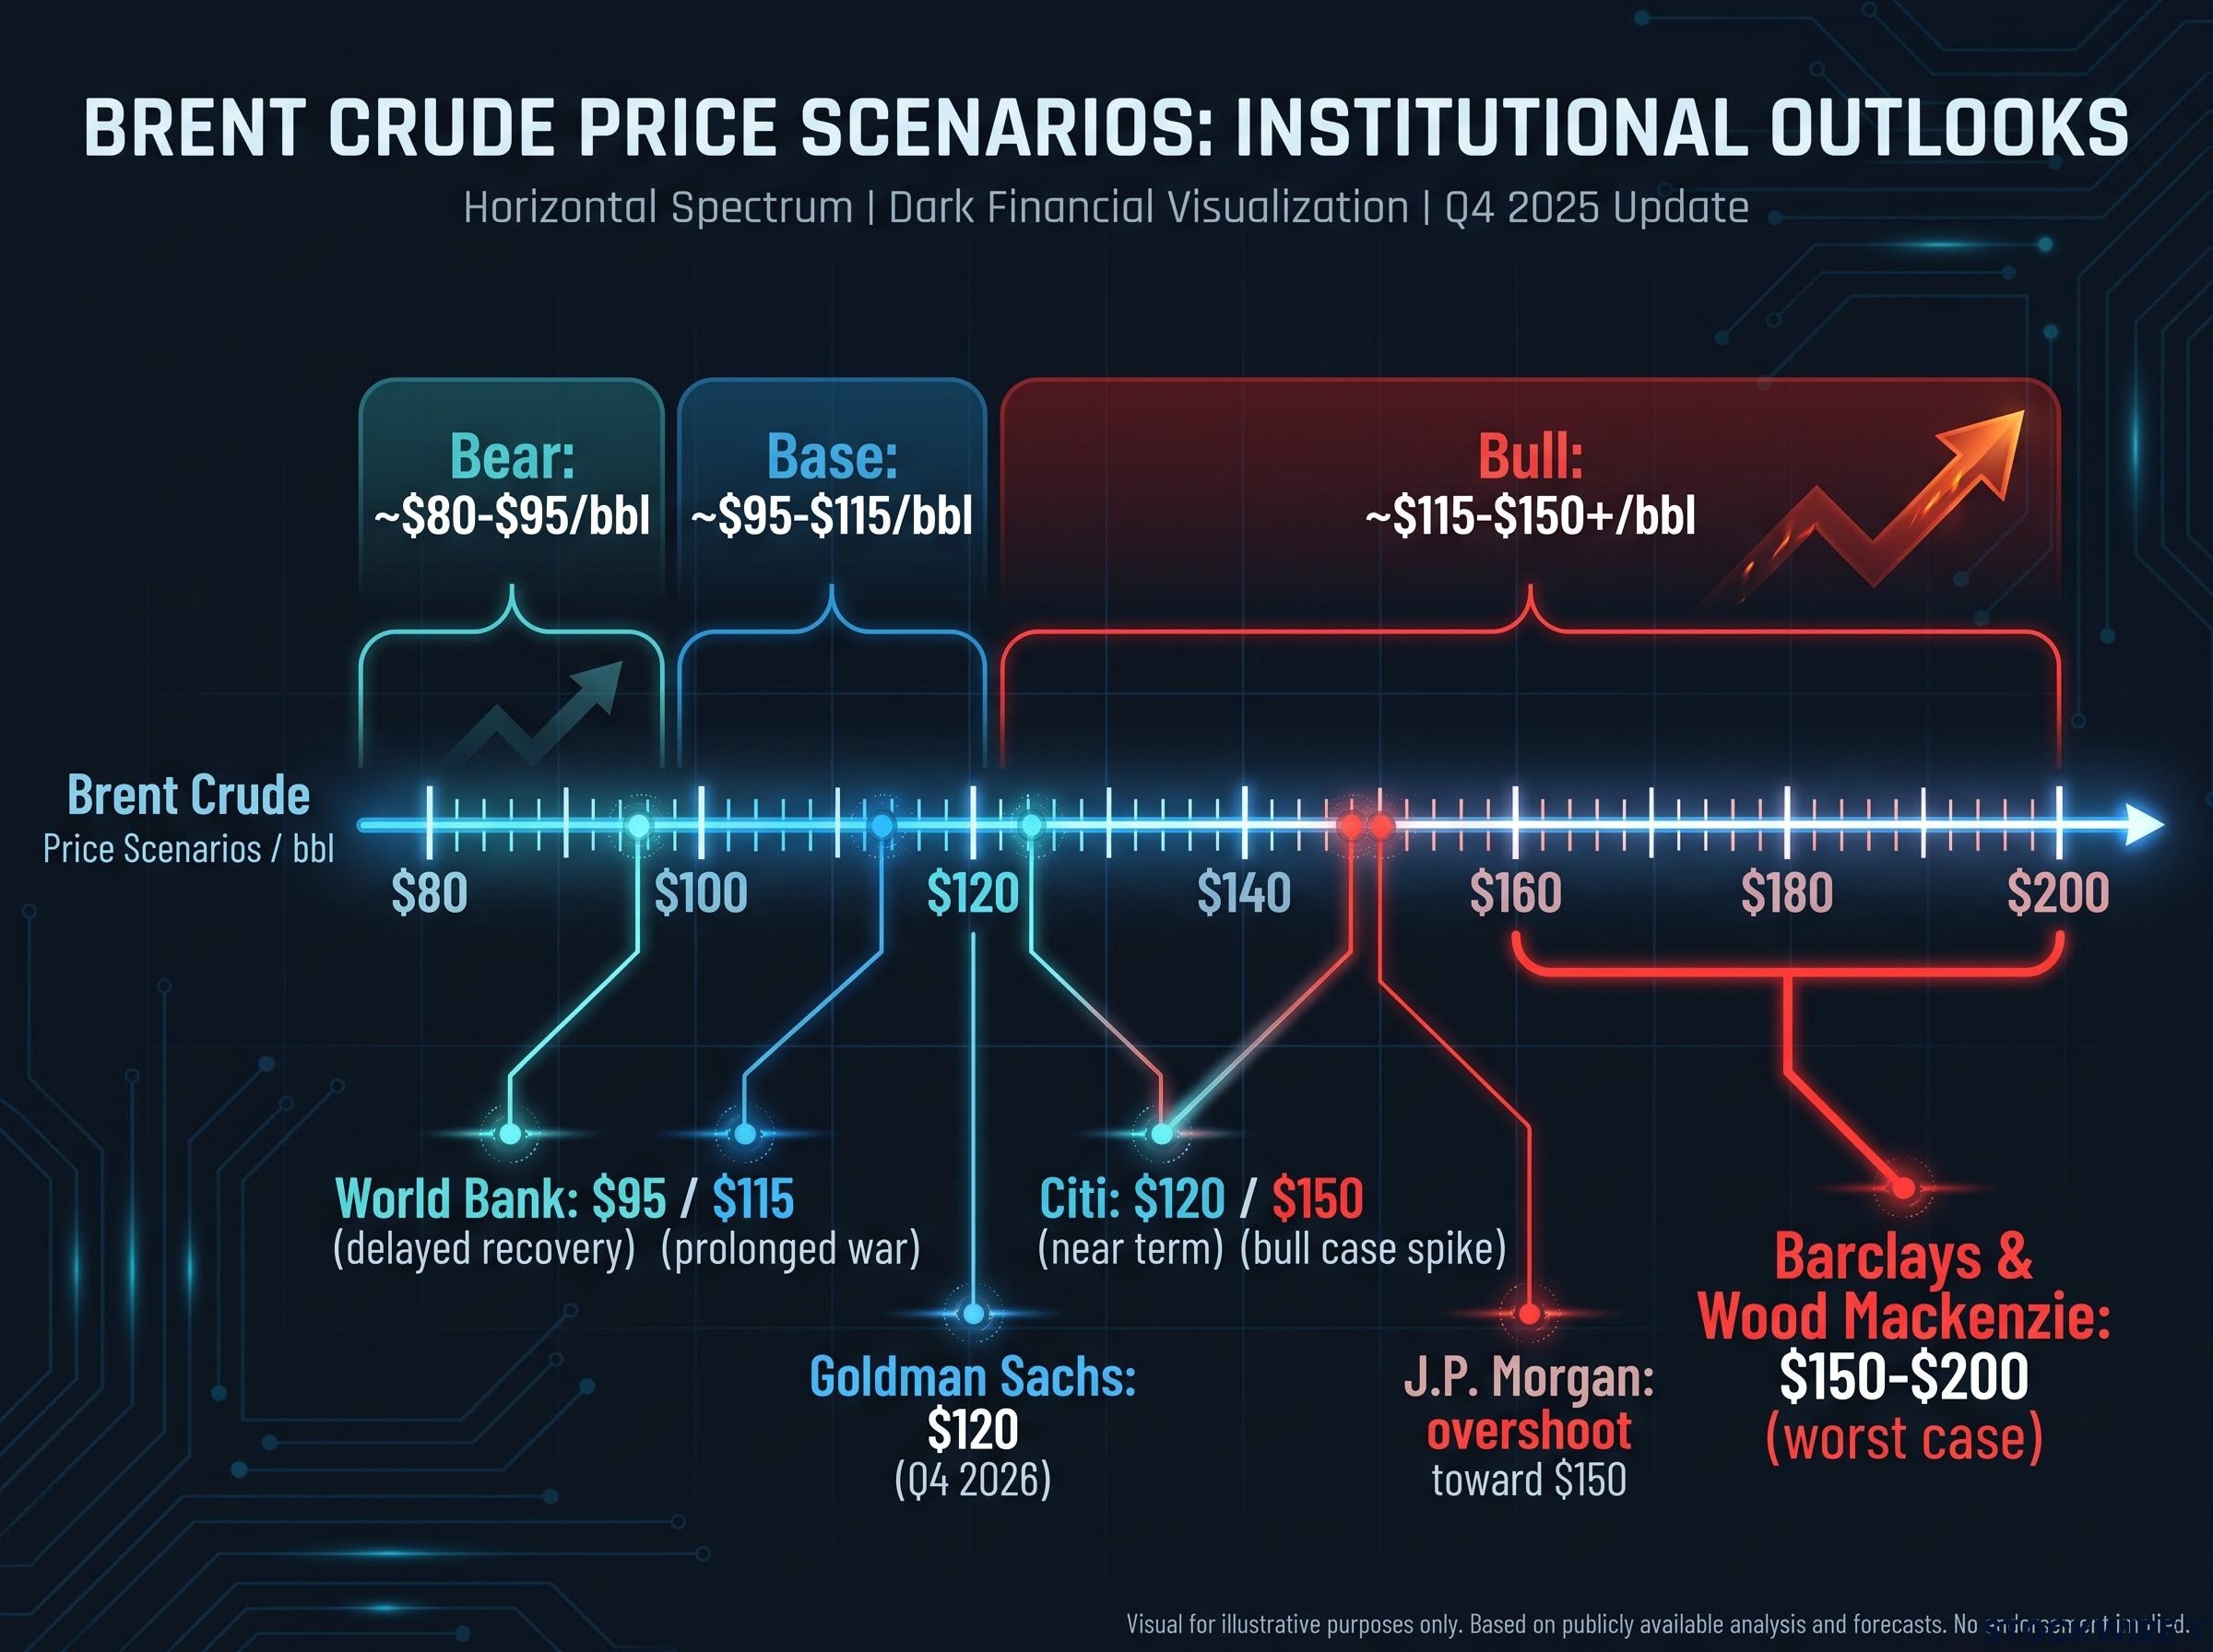
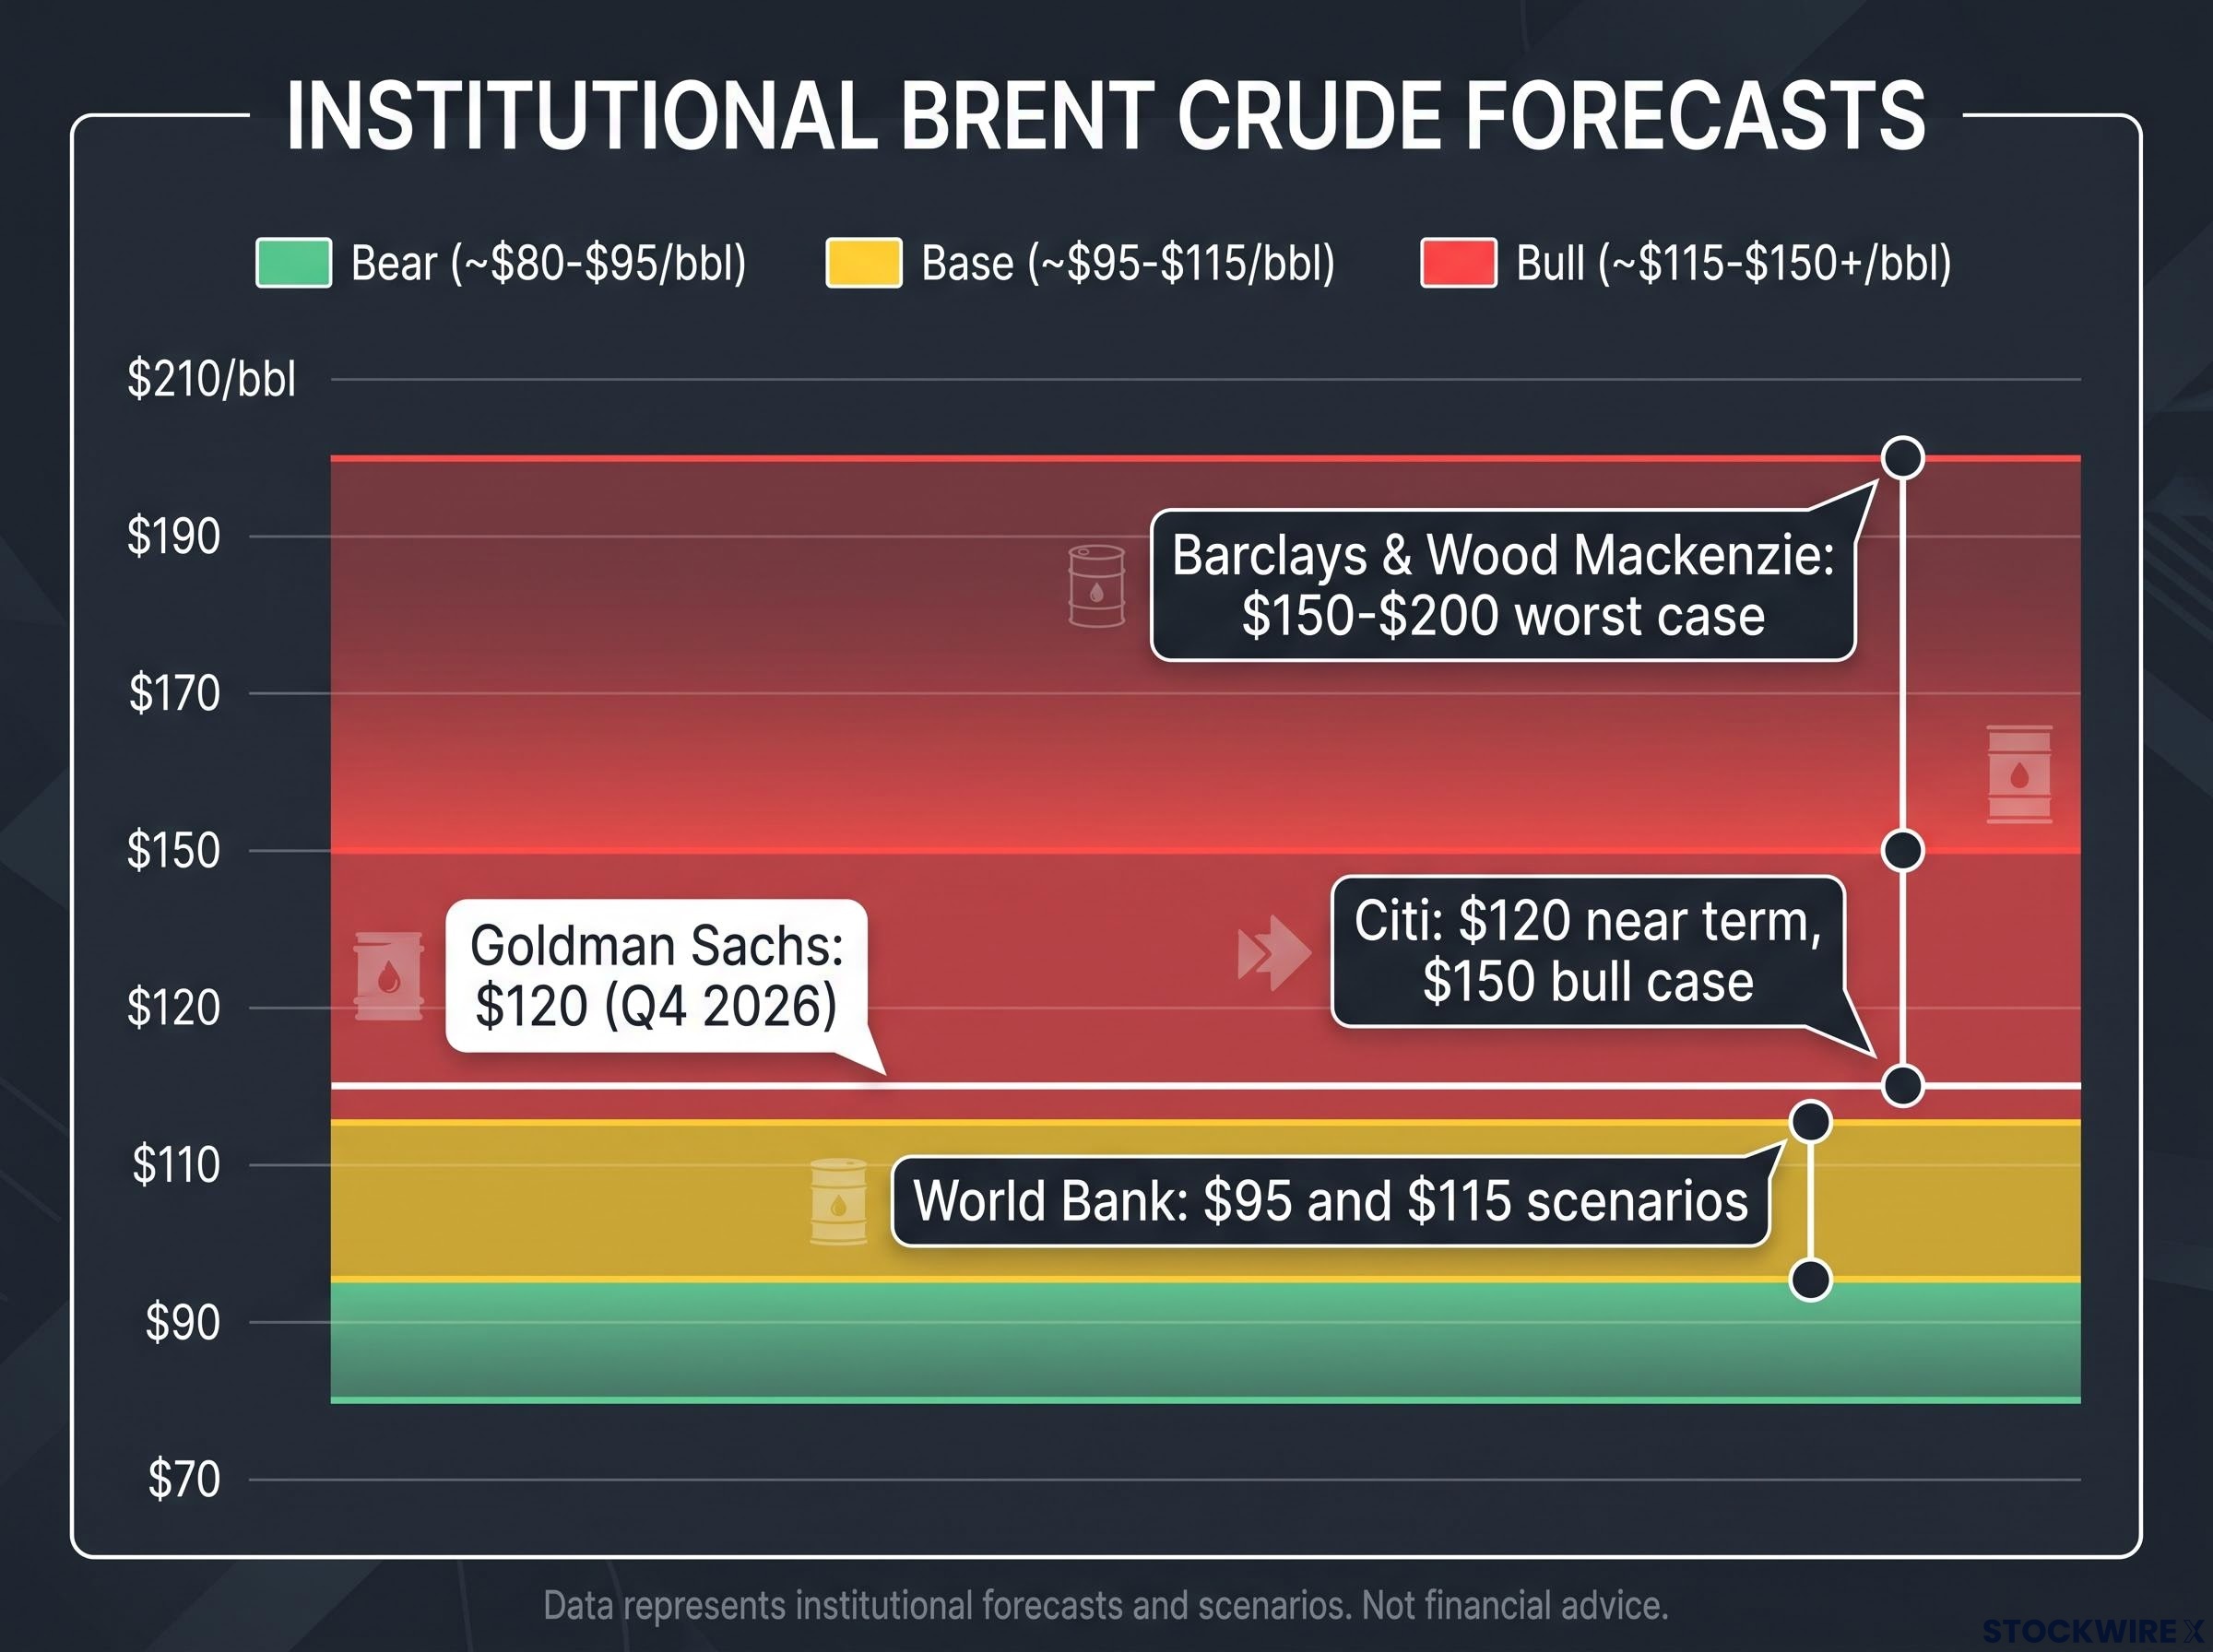
The institutional forecasts are not competing point estimates. They are a spectrum calibrated to escalation, and each step in the conflict maps to a different price band.
| Scenario | Brent Price Range | Key Condition |
|---|---|---|
| Bear (de-escalation) | ~$80-$95/bbl | Hormuz normalises over weeks; no major infrastructure damage; inventories stabilise |
| Base (prolonged but contained) | ~$95-$115/bbl | War continues; Hormuz impaired but not shut; partial OPEC+ response |
| Bull (material supply shock) | ~$115-$150+/bbl | Hormuz heavily constrained; Gulf infrastructure damage; Saudi exports disrupted |
Goldman Sachs places Brent at approximately $120 by Q4 2026 under sustained conflict and Hormuz disruption, making it the institutional focal point. The World Bank estimates $115 in a prolonged war scenario and $95 in a delayed recovery case. Citi sees $120 near term with a bull case spike to $150. Barclays and Wood Mackenzie model $150-$200 in a worst case where Hormuz stays largely closed through end-2026.
J.P. Morgan has warned that Brent could overshoot toward $150 if Hormuz remains effectively shut, characterising the Iran conflict as potentially the largest oil supply shock in modern history.
The convergence of multiple major institutions around the $115-$120 band as a central estimate, not a ceiling, is the signal that matters. For investors assessing energy exposure, $120 Brent should function as a planning assumption rather than a stress test.
The institutional forecast spectrum mapped against the Hormuz closure assigns only a 55% probability to normalisation by mid-June 2026, meaning the market’s own base case has carried substantial downside contingency throughout this crisis, and the $110-$142 range Goldman Sachs attached to a prolonged closure scenario has remained live.
Why this shock is structurally different from prior Middle East flare-ups
Three structural factors separate this episode from prior Gulf tensions that resolved within weeks:
- Direct state-level military confrontation. This is not a proxy conflict. The US, Israel, and Iran are in direct military engagement, which removes the plausible deniability buffer and raises the probability of sustained, state-directed attacks on oil infrastructure and tankers.
- Narrow diplomatic off-ramps. Analysts emphasise that if Hormuz is not meaningfully reopened within one to three weeks, economic damage and elevated prices could persist long after any eventual ceasefire. Once emergency measures are exhausted, there is little additional cushioning available.
- Proven capacity to disrupt shipping at scale. The pattern of attacks has already cut Hormuz traffic to a trickle at points, demonstrating sustained operational capability. Markets therefore treat further threats as credible rather than rhetorical.
That combination, a major producer in direct war, the world’s most critical chokepoint at risk, and limited remaining policy tools, is why major institutions are discussing a potential modern-era oil shock rather than a standard flare-up.
The inventory problem: why low stockpiles amplify every barrel lost
Reuters described global oil stockpiles as “perilously low.” That matters because the same physical disruption produces a vastly different price response depending on inventory levels.
With full stockpiles, a 2-3% loss of global supply is bufferable. Commercial inventories absorb the shock while diplomacy works. Without them, the supply loss transmits directly and immediately to prices.
The main policy tools, strategic petroleum reserve releases, rerouting, and temporary sanctions relief, have limited remaining headroom. The US Strategic Petroleum Reserve was heavily drawn after 2022 and has only been partially replenished. OPEC+ holds spare capacity, but much of it is concentrated in Gulf states where security risk is highest, meaning deployment is constrained by the same environment that created the disruption. This is the multiplier effect: once these buffers are exhausted, every missing barrel hits the market at full force.
Emergency reserve releases totalling approximately 280 million barrels have failed to halt the inventory drawdown, with Saudi Arabia’s crude output collapsing to its lowest level since 1990 and OPEC spare capacity at roughly 0.5 million barrels per day, a buffer negligible against a disruption measured in tens of millions of barrels.
Beyond crude: how the oil shock is repricing gold, copper, and commodity markets broadly
The overnight session on 22 July 2026 showed simultaneous strength across multiple commodity classes, the signature of a broad geopolitical risk repricing rather than a sector-specific move.
| Asset | Price / Level | Overnight Change |
|---|---|---|
| Gold | $4,079.61/oz | +1.79% |
| Silver | $58.79/oz | +4.1% |
| Copper | $6.56/lb | +2.97% |
| Global X Copper Miners ETF | 78.24 | +5.93% |
The transmission mechanism is straightforward: an oil price shock drives inflation expectations higher, which reprices inflation-sensitive assets upward and creates headwinds for energy-importing economies and their currencies. Gold Miners ETF gained 4.88%, Silver Miners ETF rose 5.77%, and Uranium ETF added 4.09%. On the ASX, Sandfire Resources gained 2.4%, Capstone added 3.7%, and BHP rose 1.3%.
The Global X Copper Miners ETF surged 5.93% in the overnight session, yet its price level sits roughly 16% short of the 2 June peak. That gap between the metal’s price (sitting 2% below its all-time record) and the miners’ equity performance tells you markets are not in pure risk-on mode.
The lag between copper’s metal price and copper equities reflects crosscurrents: elevated oil costs, disappointing Chinese economic growth, and a strong US dollar are all limiting equity upside even as the underlying commodity rallies. Sector selection within commodities matters more than a blanket “buy commodities” thesis.
Five variables that will determine whether $120 Brent becomes a floor or a ceiling
Rather than reacting to daily price prints, tracking these five indicators lets you assess whether markets are moving toward or away from the conditions that institutional forecasters associate with sustained $120-plus Brent.
- Hormuz shipping volumes and incidents. Tanker traffic data, attack frequency, and insurance war-risk premia are the leading indicators of supply loss severity. Goldman Sachs flags 70% of pre-war flow levels as the critical threshold; sustained readings below that keep the bull scenario alive.
- Physical supply loss estimates (barrels per day). Analyst estimates currently range around 4.5-5 million barrels per day in war-related disruptions. Sharp upward revisions would push institutional forecasts toward the $120-$150 band.
- Global inventory levels and policy buffers. OECD commercial stock data and strategic petroleum reserve draw rates determine how long elevated prices can be cushioned. With the US SPR only partially replenished, the cushion is thinner than in prior episodes.
- OPEC+ spare capacity deployment. The cartel holds spare capacity, but its concentration in Gulf states means war-related damage or access constraints could erode this buffer when it is most needed.
- Major bank forecast revisions. Revisions from Goldman Sachs, Citi, J.P. Morgan, the World Bank, and the EIA often move market expectations ahead of physical data. The recent trend has been consistently upward.
The most consequential distinction is between markets pricing in risk versus facing a hard constraint from actual missing barrels. Every upward revision to supply loss estimates narrows the gap between where Brent trades now and where the institutional bull case sits.
What the conflict’s trajectory means for energy positioning through Q4 2026
The analytical through-line points in one direction: the triggering events, chokepoint mechanics, institutional scenario range, structural distinctives, and cross-asset repricing all describe a conflict where the risk asymmetry favours further upside for oil prices rather than rapid mean reversion.
The de-escalation scenario is well understood and already partially priced. The escalation scenarios carry the more consequential and less-priced implications. That asymmetry shapes the investor response:
A structural price floor persists even after ceasefire announcements because mine-clearing, port repairs, tanker rescheduling, and war-risk insurance reset on actuarial rather than diplomatic timescales, meaning markets cannot assume a ceasefire equates to immediate supply normalisation.
- Energy equities and commodity-linked assets are natural beneficiaries in bullish oil scenarios but carry elevated volatility and event risk that demands position sizing discipline.
- Inflation-linked instruments, including inflation-linked bonds and certain real-asset exposures, may offer partial hedging value against a sustained $100-$120 oil regime.
- Emerging market energy importers face compounded stress: higher inflation, weaker growth, and balance-of-payments pressure that compounds with each week prices stay elevated.
Brent sits at $91.63 as of 22 July 2026. It touched $126 intraday in April. Goldman Sachs’ $120 Q4 2026 central estimate is the institutional anchor. Whether that level becomes a sustained average depends entirely on whether the five variables outlined above resolve toward escalation or containment.
The practical implication: the risk-reward calculation for energy exposure has shifted. Underweighting energy in this environment carries its own form of asymmetric risk.
This article is for informational purposes only and should not be considered financial advice. Investors should conduct their own research and consult with financial professionals before making investment decisions. Past performance does not guarantee future results. Financial projections are subject to market conditions and various risk factors.