Gold’s most recent high registered an RSI reading of 90. That number has appeared twice before at major gold peaks: 1980 and 2011. Both preceded multi-year bear markets.
A 16 July 2026 research note from Bank of America technical strategist Paul Ciana identified a cluster of concurrent bearish signals in gold, set against a backdrop in which the metal has shed approximately 7.5% since the start of the year and pulled back roughly 16.8% from its three-month high. The tension in BofA’s position is worth understanding clearly: the firm maintains a long-term structurally bullish view on gold while issuing a near-term bear-case warning with specific downside targets as low as $3,315.
This piece walks you through exactly what BofA’s signals are, what its three downside price targets mean in practical terms, and how the firm recommends positioning if gold continues lower. You leave with a concrete map of the bear case and a staged accumulation framework, not just a headline number.
Why gold’s technical picture looks different now than it did six months ago
The surface-level numbers tell one story. The metal has lost around 7.5% since January and sits nearly 16.8% below where it traded three months ago. Those figures, on their own, describe a correction within a bull market that has run for over two years.
BofA’s concern is what sits underneath. The current correction has been running for roughly 24 weeks, whereas the uptrend preceding it stretched across 121 weeks. That ratio matters. BofA’s view is that a pullback this short in duration, measured against the length of the rally it is unwinding, carries a structural argument for further downside, and the firm treats this imbalance as a warning that the selloff may not yet be complete.
The 38.2% Fibonacci retracement level at $4,149 has already given way, a threshold at which corrections frequently find a floor. BofA argues that breach alone is insufficient to conclude the correction is finished. The key data points framing the current setup:
- Year-to-date decline: approximately 7.5%
- Peak drawdown over prior three months: approximately 16.8%
- Current correction duration: approximately 24 weeks
- Prior uptrend duration: 121 weeks
- 38.2% Fibonacci retracement breached at $4,149
The takeaway for anyone watching gold is straightforward: short-term stabilisation around current levels does not, in BofA’s framework, constitute evidence that the trend has reversed. The correction’s brevity relative to the rally it is unwinding is the structural argument for expecting more downside.
When big ASX news breaks, our subscribers know first
What BofA’s bear-case warning is actually based on
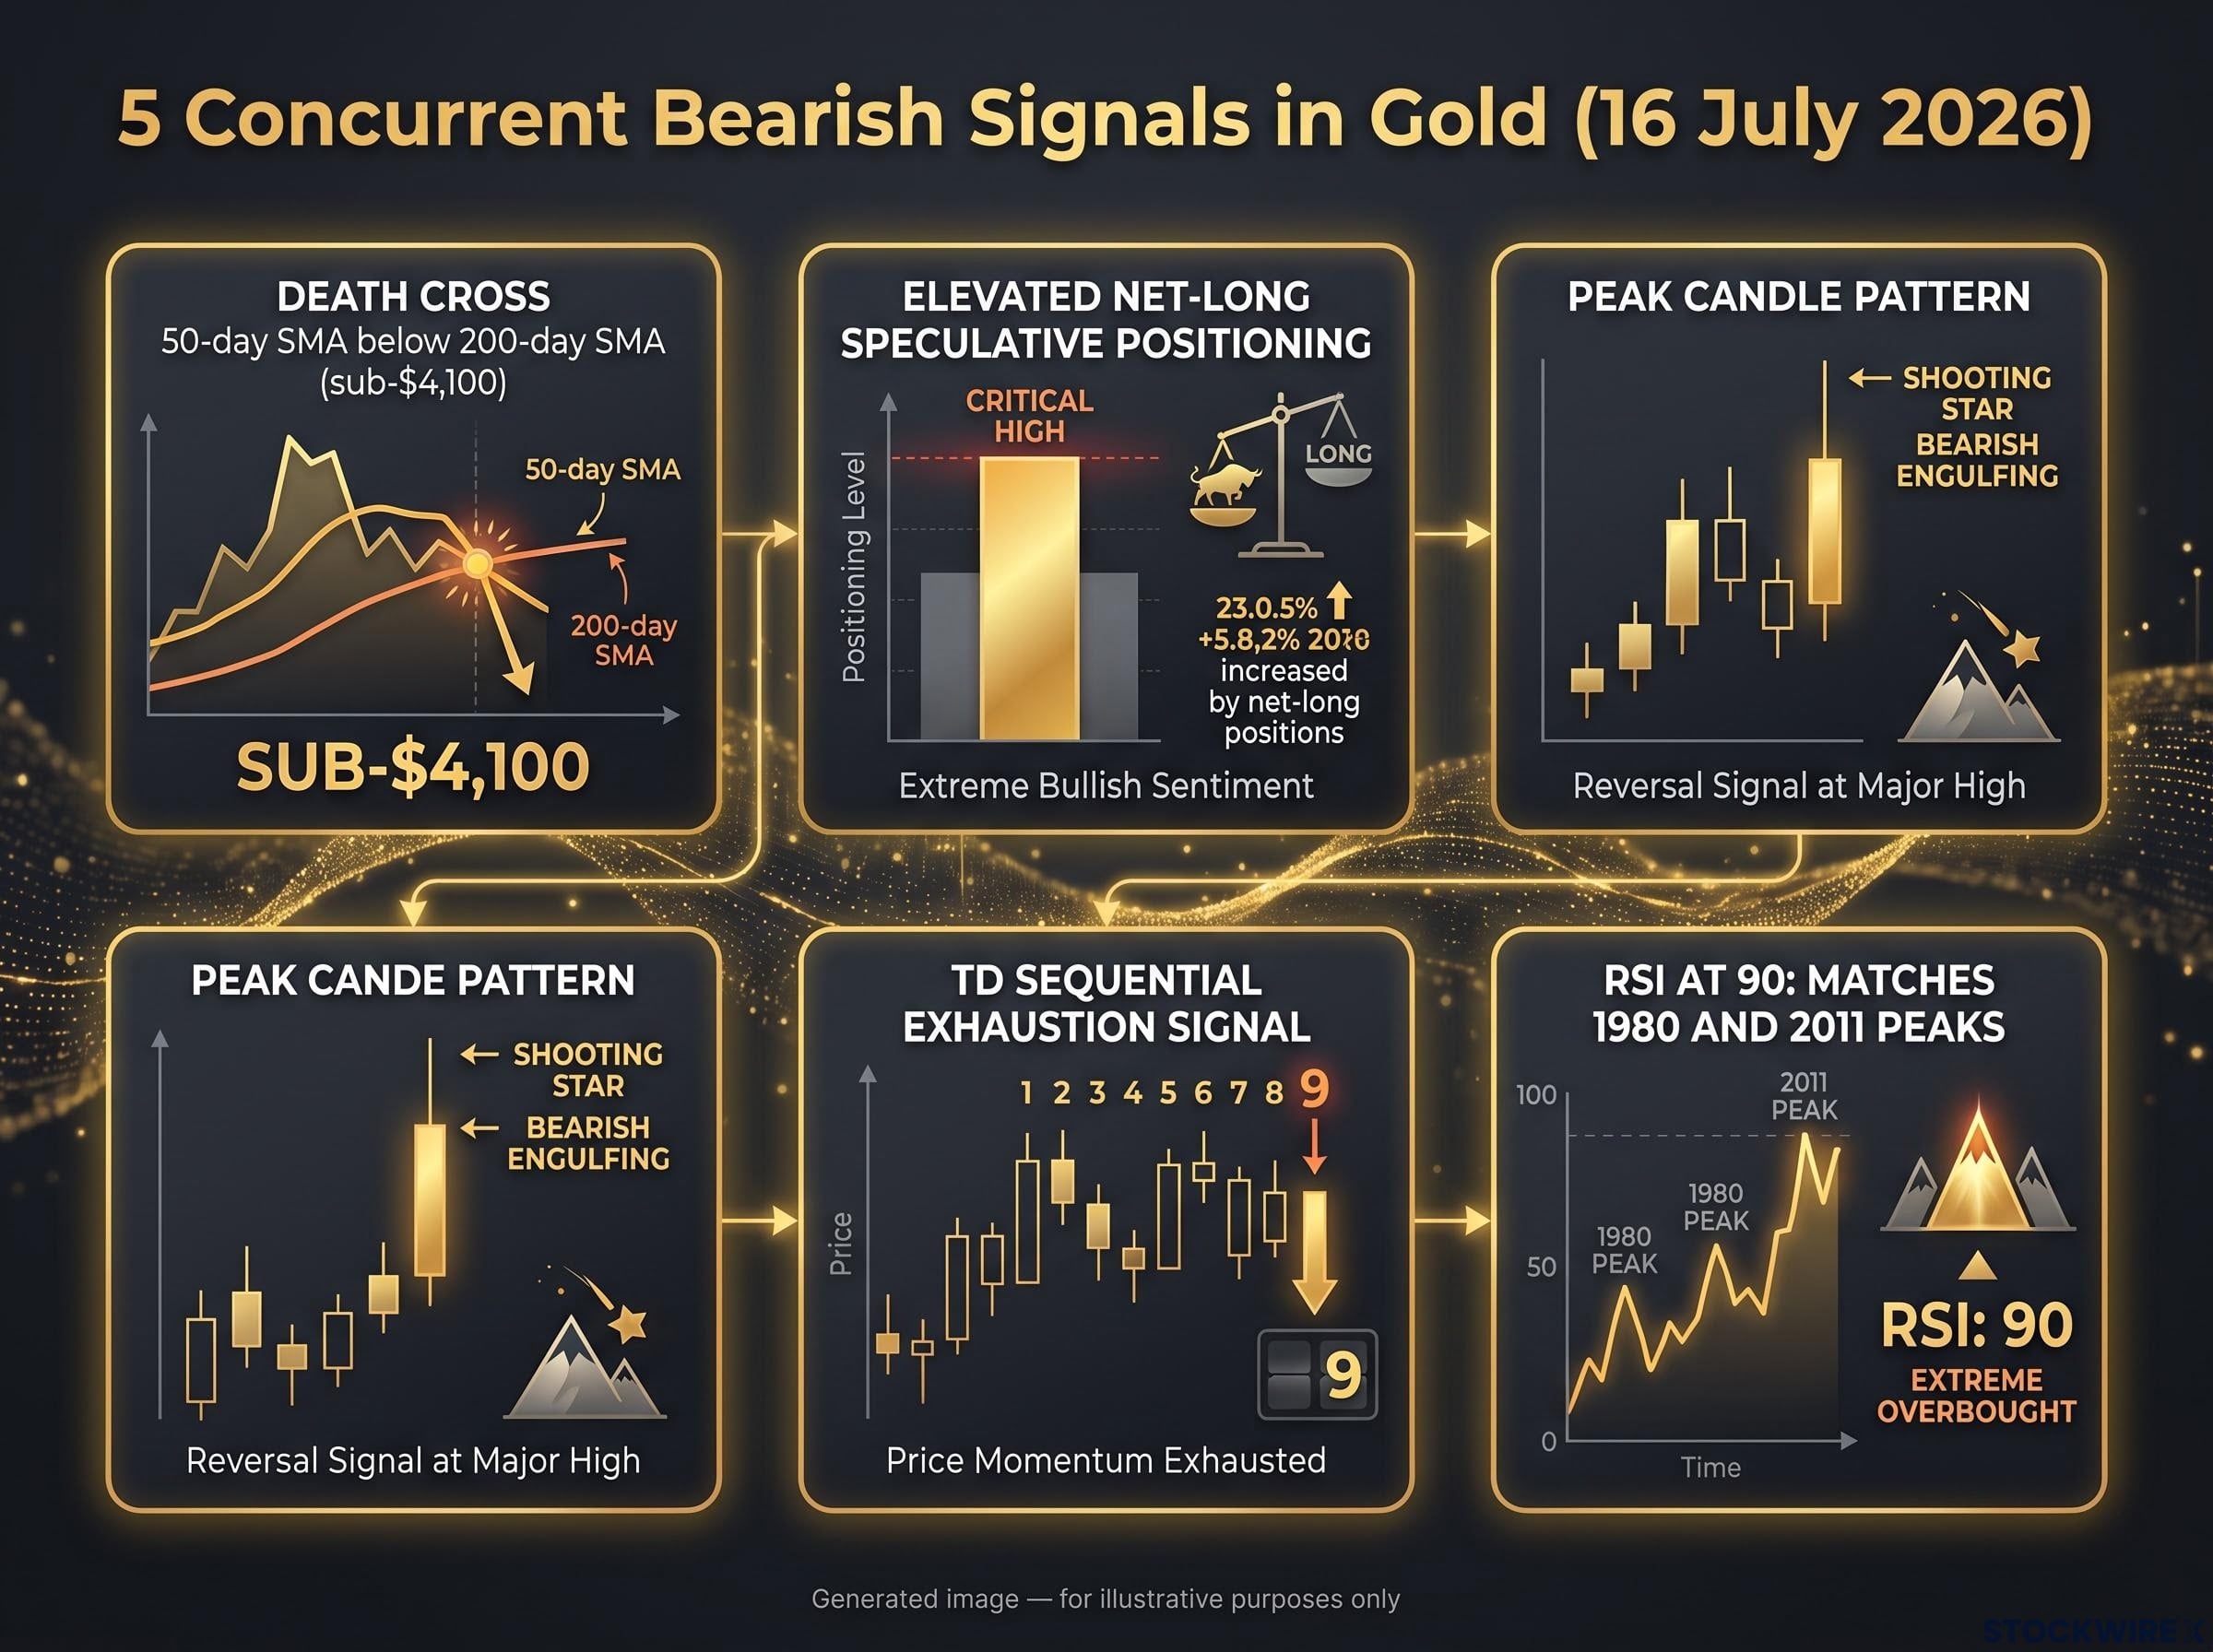
The 16 July 2026 BofA technical research note authored by strategist Paul Ciana sets out five bearish technical signals that are currently active in gold at the same time. No single indicator drives the call. It is the confluence, all five arriving at once, that BofA treats as materially significant.
The five signals, in the order they build weight:
- Death cross: Gold’s 50-day simple moving average (SMA) has crossed below its 200-day SMA, a pattern that typically signals medium- to long-term downside momentum. Independent technical commentary corroborates this formation in July 2026, noting a downside bias while gold remains below approximately $4,100.
- Elevated net-long speculative positioning: Speculative bets on rising gold prices remain stretched. Ciana has previously documented concern about “crowded” positioning driving momentum rather than fundamentals.
- Peak candle pattern: A candlestick formation associated with price exhaustion at or near a significant high.
- TD Sequential exhaustion signal: A timing indicator designed to identify the precise point where a trend runs out of buying or selling energy.
- RSI at 90: Gold’s Relative Strength Index, a measure of how overbought or oversold an asset is, registered 90 at the recent peak. BofA draws a direct comparison to that same threshold seen at the 1980 and 2011 secular highs, each of which marked the start of extended bear markets.
In an October 2025 note, Ciana warned that the “risk of correction is elevated” in gold, citing “a variety of multiple time frame technical signals and conditions” pointing to uptrend exhaustion and overbought behaviour.
The RSI comparison carries the longest historical shadow. If this reading is as meaningful as BofA argues, it implies the current correction may be replaying one of gold’s two most severe bear markets rather than a routine pullback. Independent verification of the complete five-signal framework in other publicly available BofA publications is not available; the 16 July 2026 note is the sole documented source.
Where gold could land: mapping BofA’s downside price levels
BofA’s note identifies three downside targets, each built on a different analytical foundation. They are worth walking through individually because the severity escalates meaningfully from the first to the last.
| Price Target | Methodology | Source Status |
|---|---|---|
| $3,702 | Midpoint retracement of the complete prior advance (50% Fibonacci level) | BofA note (16 July 2026); not in other public BofA documents |
| $3,605 | Derived from a separate 174-week historical lookback calculation | BofA note (16 July 2026); not in other public BofA documents |
| $3,315 | Full bear case: each of the three gold bear markets since **1970** gave back at least half of the prior advance | BofA note (16 July 2026); not in other public BofA documents |
| $4,075 / $3,887-$3,857 | Independent support zones (38.2% retracement levels from separate lookback periods) | Independent technical sources |
How far BofA’s bear case sits from consensus
The gap between where independent technicians currently see near-term support ($3,887-$3,857) and where BofA’s bear case bottoms out ($3,315) is the decision-relevant distance. It tells you that BofA is not predicting a routine retracement. It is modelling a potential repricing of gold’s entire post-2022 advance.
The $3,315 level deserves particular attention. BofA grounds it in the historical record: across the three gold bear markets since 1970, every one of them surrendered at least half of the rally that came before it. If the current move follows that same pattern, that is where the arithmetic points. Short-term independent supports sit at $4,000 and $3,941-$3,886, well above any of BofA’s targets.
The bounce trap: why BofA expects a rally before the bigger drop
Here is the most practically urgent part of BofA’s framework. Ciana does not project a straight line lower. His note projects a near-term recovery phase that could push gold back toward $4,325-$4,500 before any subsequent decline toward $3,702 or further.
That matters because a bounce back above $4,300 will look, on the surface, like the correction is ending. BofA’s framework says it is not. The firm points to the 2011 secular peak as the relevant historical template, noting how price action in the months following that top featured a recovery phase that drew buyers in ahead of a far more substantial decline.
BofA’s analysis of the 2011 cycle underpins this bounce-trap scenario: after the secular peak, gold managed a meaningful rally that encouraged re-entry before the prolonged bear market reasserted itself.
Independent technical work corroborates the shape of this scenario, even without the BofA attribution. Resistance levels stack up through the expected bounce zone:
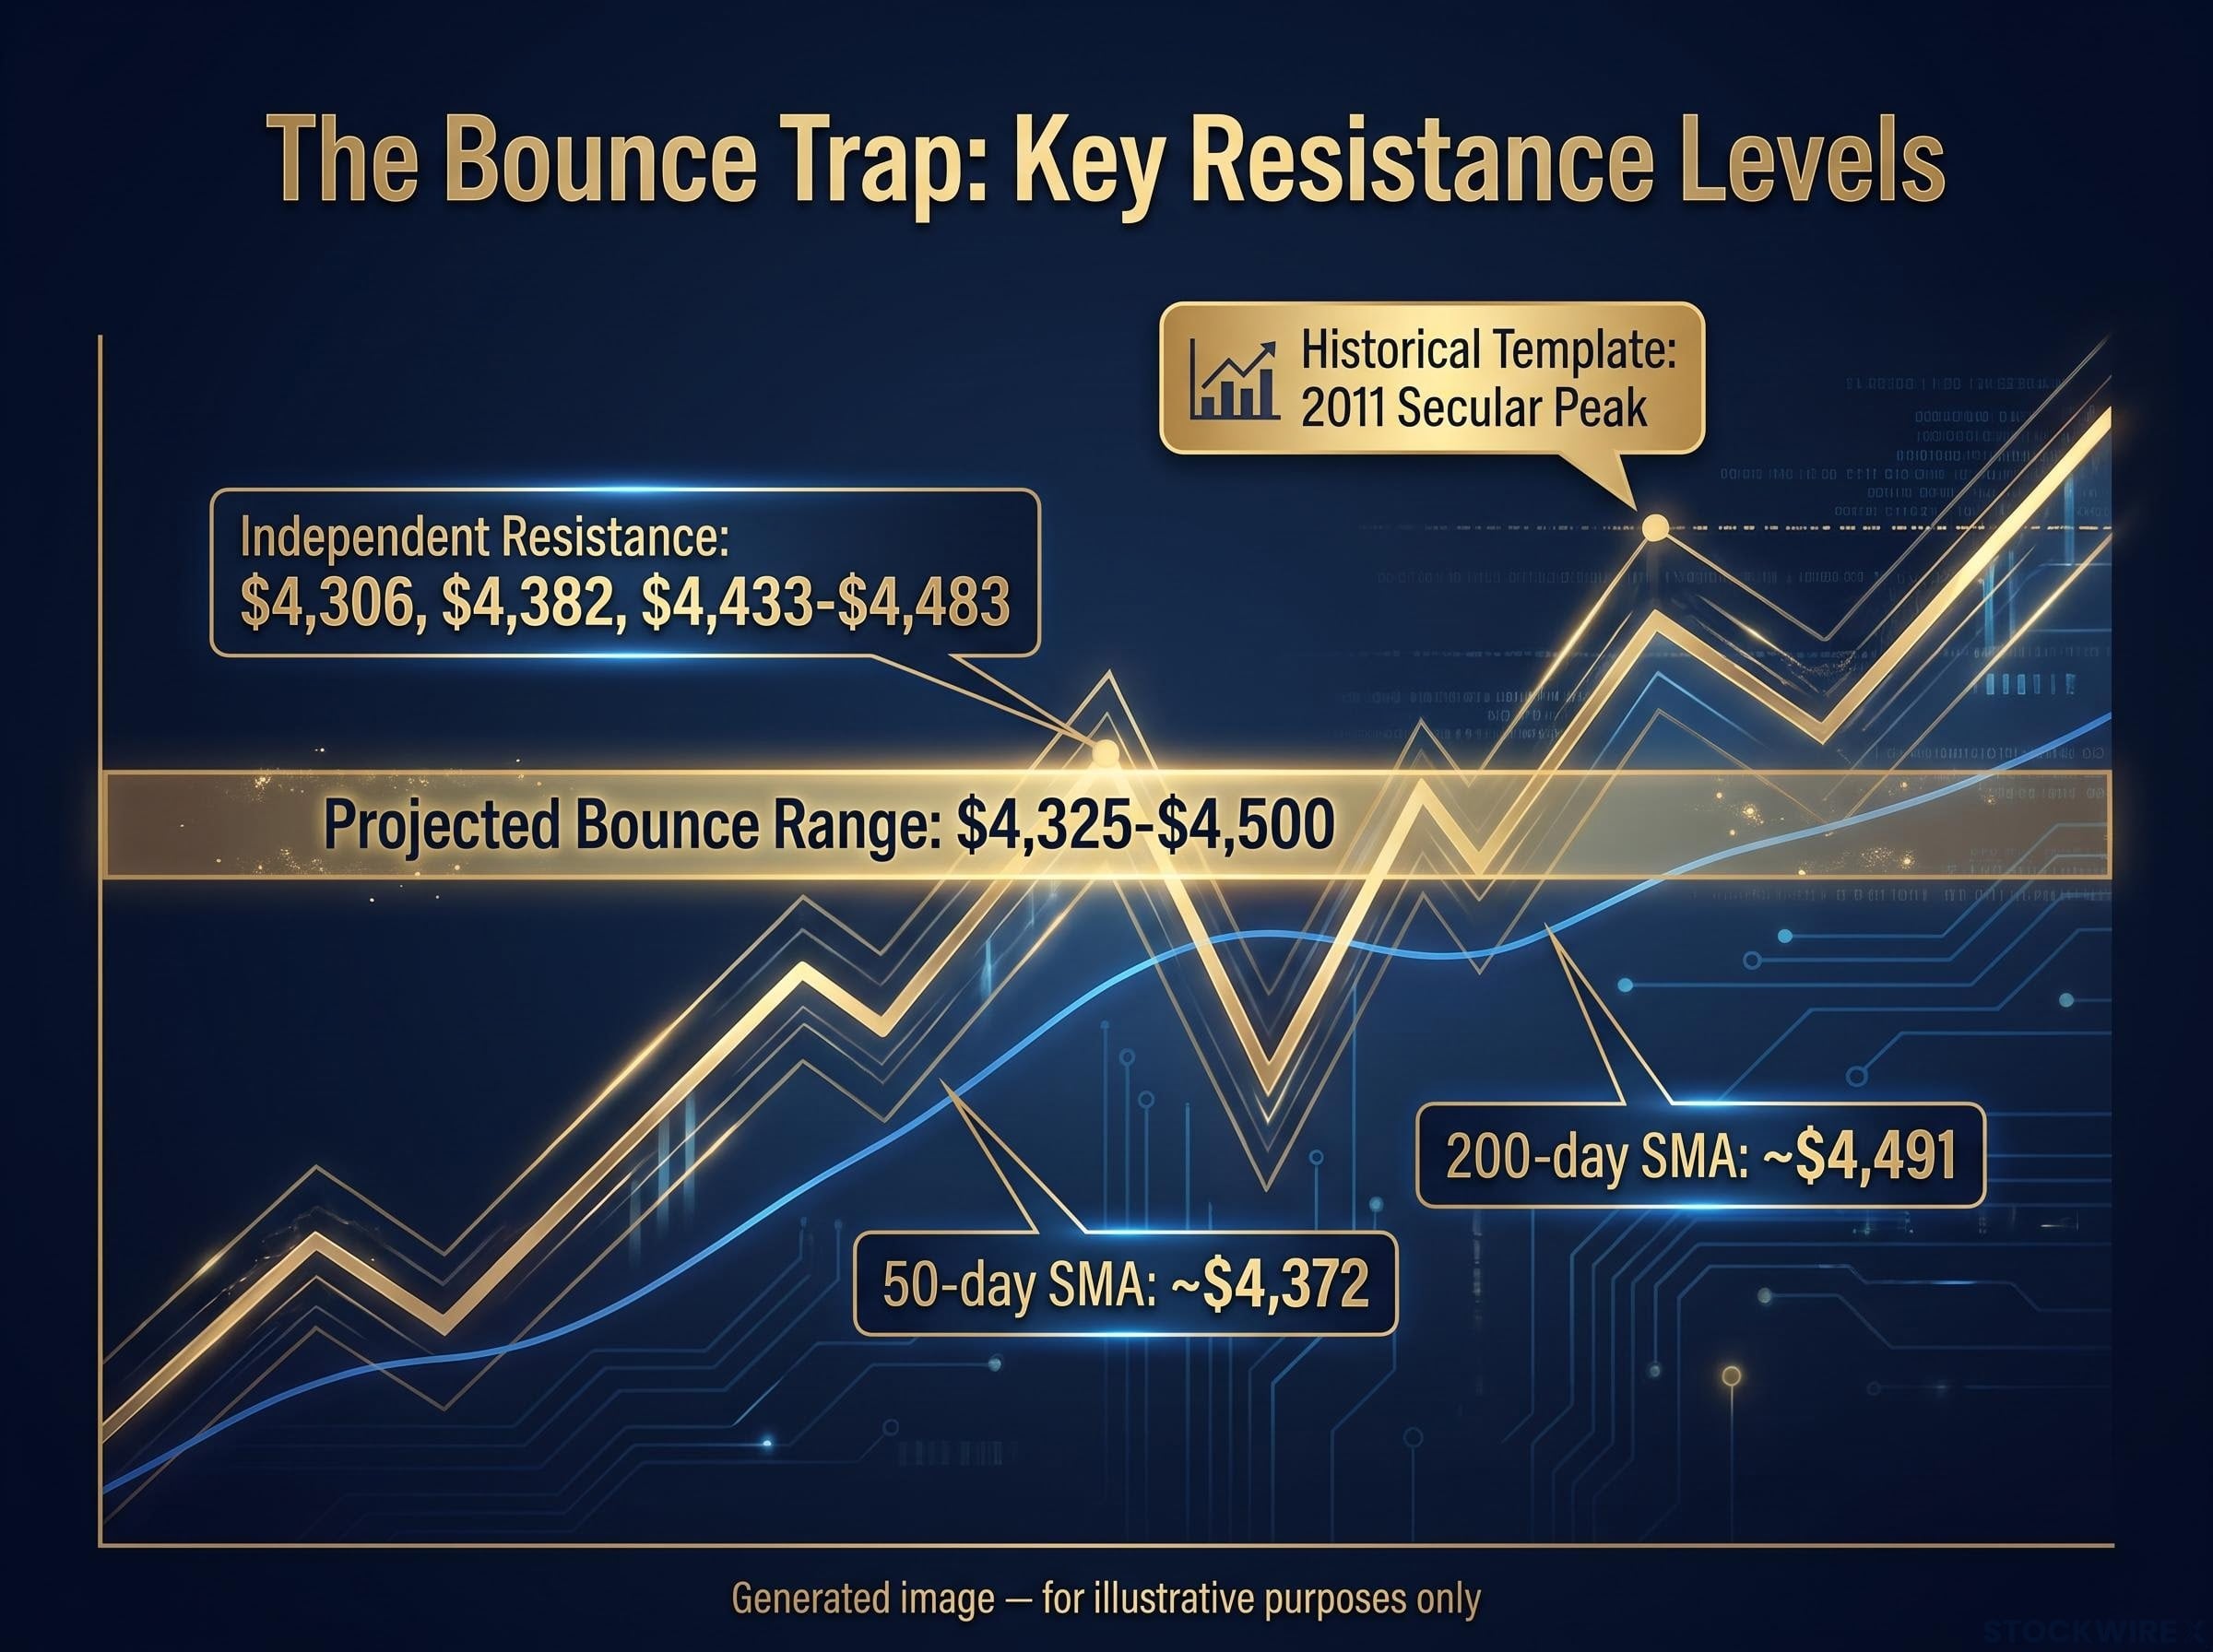
- Independent resistance at $4,306, then $4,382, then $4,433-$4,483
- 50-day SMA at approximately $4,372
- 200-day SMA at approximately $4,491
- BofA’s projected bounce range: $4,325-$4,500
If gold rallies in the coming weeks and stalls near $4,300-$4,500, BofA’s framework reads that as the expected setup for the next leg lower, not the all-clear signal. The difference between those two interpretations is where money is made or lost.
What is a Fibonacci retracement, and why do major banks use it to set price targets?
A Fibonacci retracement is a tool that maps mathematically derived percentage levels onto the range of a prior price move to identify potential support and resistance zones. The percentages come from the Fibonacci sequence, a series of numbers where each is the sum of the two before it. The ratios between those numbers produce the key levels traders watch.
Fibonacci retracement levels derive their predictive power partly from self-reinforcing behaviour: when enough institutional participants anchor entries and stops to the same mathematical ratios, the levels become structurally significant regardless of any underlying mathematical authority, which is why BofA’s $3,702 target commands attention even from investors who do not ordinarily use technical analysis.
| Fibonacci Level | What it signals in a downtrend |
|---|---|
| 23.6% | Shallowest retracement; often a pause point in strong trends |
| 38.2% | First significant support zone; corrections frequently stabilise here |
| 50% | Midpoint of the entire prior advance; the most closely watched level across asset classes |
| 61.8% | Deepest common retracement; a breach here often signals a full trend reversal |
The 50% level gets the most institutional attention because it represents the exact midpoint of the preceding advance. Historically, it has coincided with significant price reactions in commodities and equities alike.
In the current gold correction, the 38.2% level at $4,149 has already been breached. BofA’s next key level is the 50% retracement at $3,702. When BofA sets a target there, it is applying a method that has flagged meaningful turning points across decades of market history, which is why the number warrants attention even from investors who do not use technical analysis themselves.
Note that the $3,605 target uses a separate tool, a 174-week lookback period, and is not a Fibonacci level.
How BofA recommends buying the dip in tiers, and what that means for positioning
BofA’s research note does not just warn about downside. It provides a framework for buying into it, structured as a three-tier accumulation ladder that scales position size as price approaches cluster supports.
| Entry Tier | Price Zone | Position Size Guidance |
|---|---|---|
| Tier 1 | Below $4,000 | Small initial position to establish exposure |
| Tier 2 | $3,700-$3,600 | Larger additions to the position |
| Tier 3 | $3,450-$3,250 | Fully deployed allocation |
The logic is straightforward: staged accumulation limits the risk of deploying full capital before the bottom is confirmed. Each tier corresponds to a zone where multiple technical supports cluster, meaning the probability of a meaningful bounce increases as price moves deeper into the ladder. This specific framework appears only in the 16 July 2026 BofA note and is not documented in other publicly available BofA publications.
The $4,000 floor has already been tested and broken in this cycle, with a convergence of dollar strength, rising rate-hike probabilities, and fading geopolitical safe-haven demand driving a 30% drawdown from the January 2026 all-time high, making BofA’s first accumulation tier entry point a level the market has already visited rather than a theoretical downside scenario.
What matters is understanding that BofA is not bearish on gold in the way it would be bearish on a fundamentally deteriorating asset. The firm has cut its 2026 average price forecast to $4,360 (from $5,093), but its long-term targets remain in place: $5,000 once the Fed tightening cycle ends, and approximately $6,000 on a medium-term horizon. The structural drivers underpinning those targets have not changed:
- Fiscal deficits across major economies
- Constrained mine supply
- Ongoing central bank gold buying
- Low investor allocations relative to historical norms
The accumulation ladder is the bridge between BofA’s near-term technical bear call and its long-term structural bull case. It tells you the firm views the correction as a pricing opportunity within a thesis that remains constructive, not a reason to exit gold entirely.
This article is for informational purposes only and should not be considered financial advice. Investors should conduct their own research and consult with financial professionals before making investment decisions. Past performance does not guarantee future results. Financial projections are subject to market conditions and various risk factors.
The distinction that matters before acting on BofA’s analysis
BofA holds two views on gold simultaneously, and they are not contradictory. The near-term technical call says the correction is likely incomplete, with downside exposure to $3,702 and potentially $3,315 in a full bear-market scenario. The long-term structural view says gold is heading to $5,000-$6,000 once monetary policy shifts. The accumulation ladder is how BofA reconciles the two.
The attribution consideration is worth noting plainly: the five-signal framework, specific price targets, and staged buying ladder are sourced to the 16 July 2026 BofA note and are not independently corroborated in other public BofA filings. Investors following this framework should track official BofA research publications directly.
For investors wanting to stress-test BofA’s framework against the broader evidence base, our full explainer on gold price prediction documents three rate cycles where gold produced outcomes that directly contradicted widely cited trading rules, providing essential context for how much confidence to place in any single analytical model.
Three variables will tell you whether the bear case is playing out as Ciana projects:
- Whether a near-term bounce materialises and stalls in the $4,300-$4,500 zone, which would strengthen the bear case
- Whether gold breaks and holds below $4,000, triggering the first accumulation tier
- Whether Fed policy signals shift, the main catalyst for BofA’s long-term bull case
Fed policy and gold have proven to be the dominant relationship in this cycle: the UBS, Goldman Sachs, JPMorgan, and Wells Fargo price targets above $5,400 per ounce all rest on a Federal Reserve pivot as their primary catalyst, which explains why BofA’s long-term bull case of $5,000-$6,000 explicitly conditions itself on the end of the Fed tightening cycle.
The reader who understands that the same bank can be a near-term technical bear and a long-term structural bull simultaneously has grasped the most practically useful insight here. What BofA is doing is not contradictory. It is staged. And knowing the difference is what separates a reactive decision from an informed one.