TSMC generated $22 billion in net profit across the second quarter of 2026, representing a 77% increase compared with the same period twelve months earlier. That is not a forecast, not a sell-side estimate, and not a management target. The figure broke the company’s own historical records and came in ahead of what the analyst community had pencilled in.
The result matters well beyond TSMC itself. Holding the position of the world’s dominant contract chipmaker, with its fabrication lines producing chips for both Nvidia’s AI accelerators and Apple’s advanced processors, TSMC’s quarterly numbers serve as a live gauge of the capital the world is genuinely deploying into AI hardware at this moment. ASML had already upgraded its own forward guidance the previous day, so within a 48-hour window two of the semiconductor supply chain’s most consequential companies both pointed upward.
The question investors are asking is whether the AI infrastructure boom is still expanding or starting to show strain. Here is what the most current hard data available says about the state of the cycle, where the valuation tension sits, and which forward indicators will tell you when the trajectory changes.
A record that rewrites TSMC’s own benchmarks
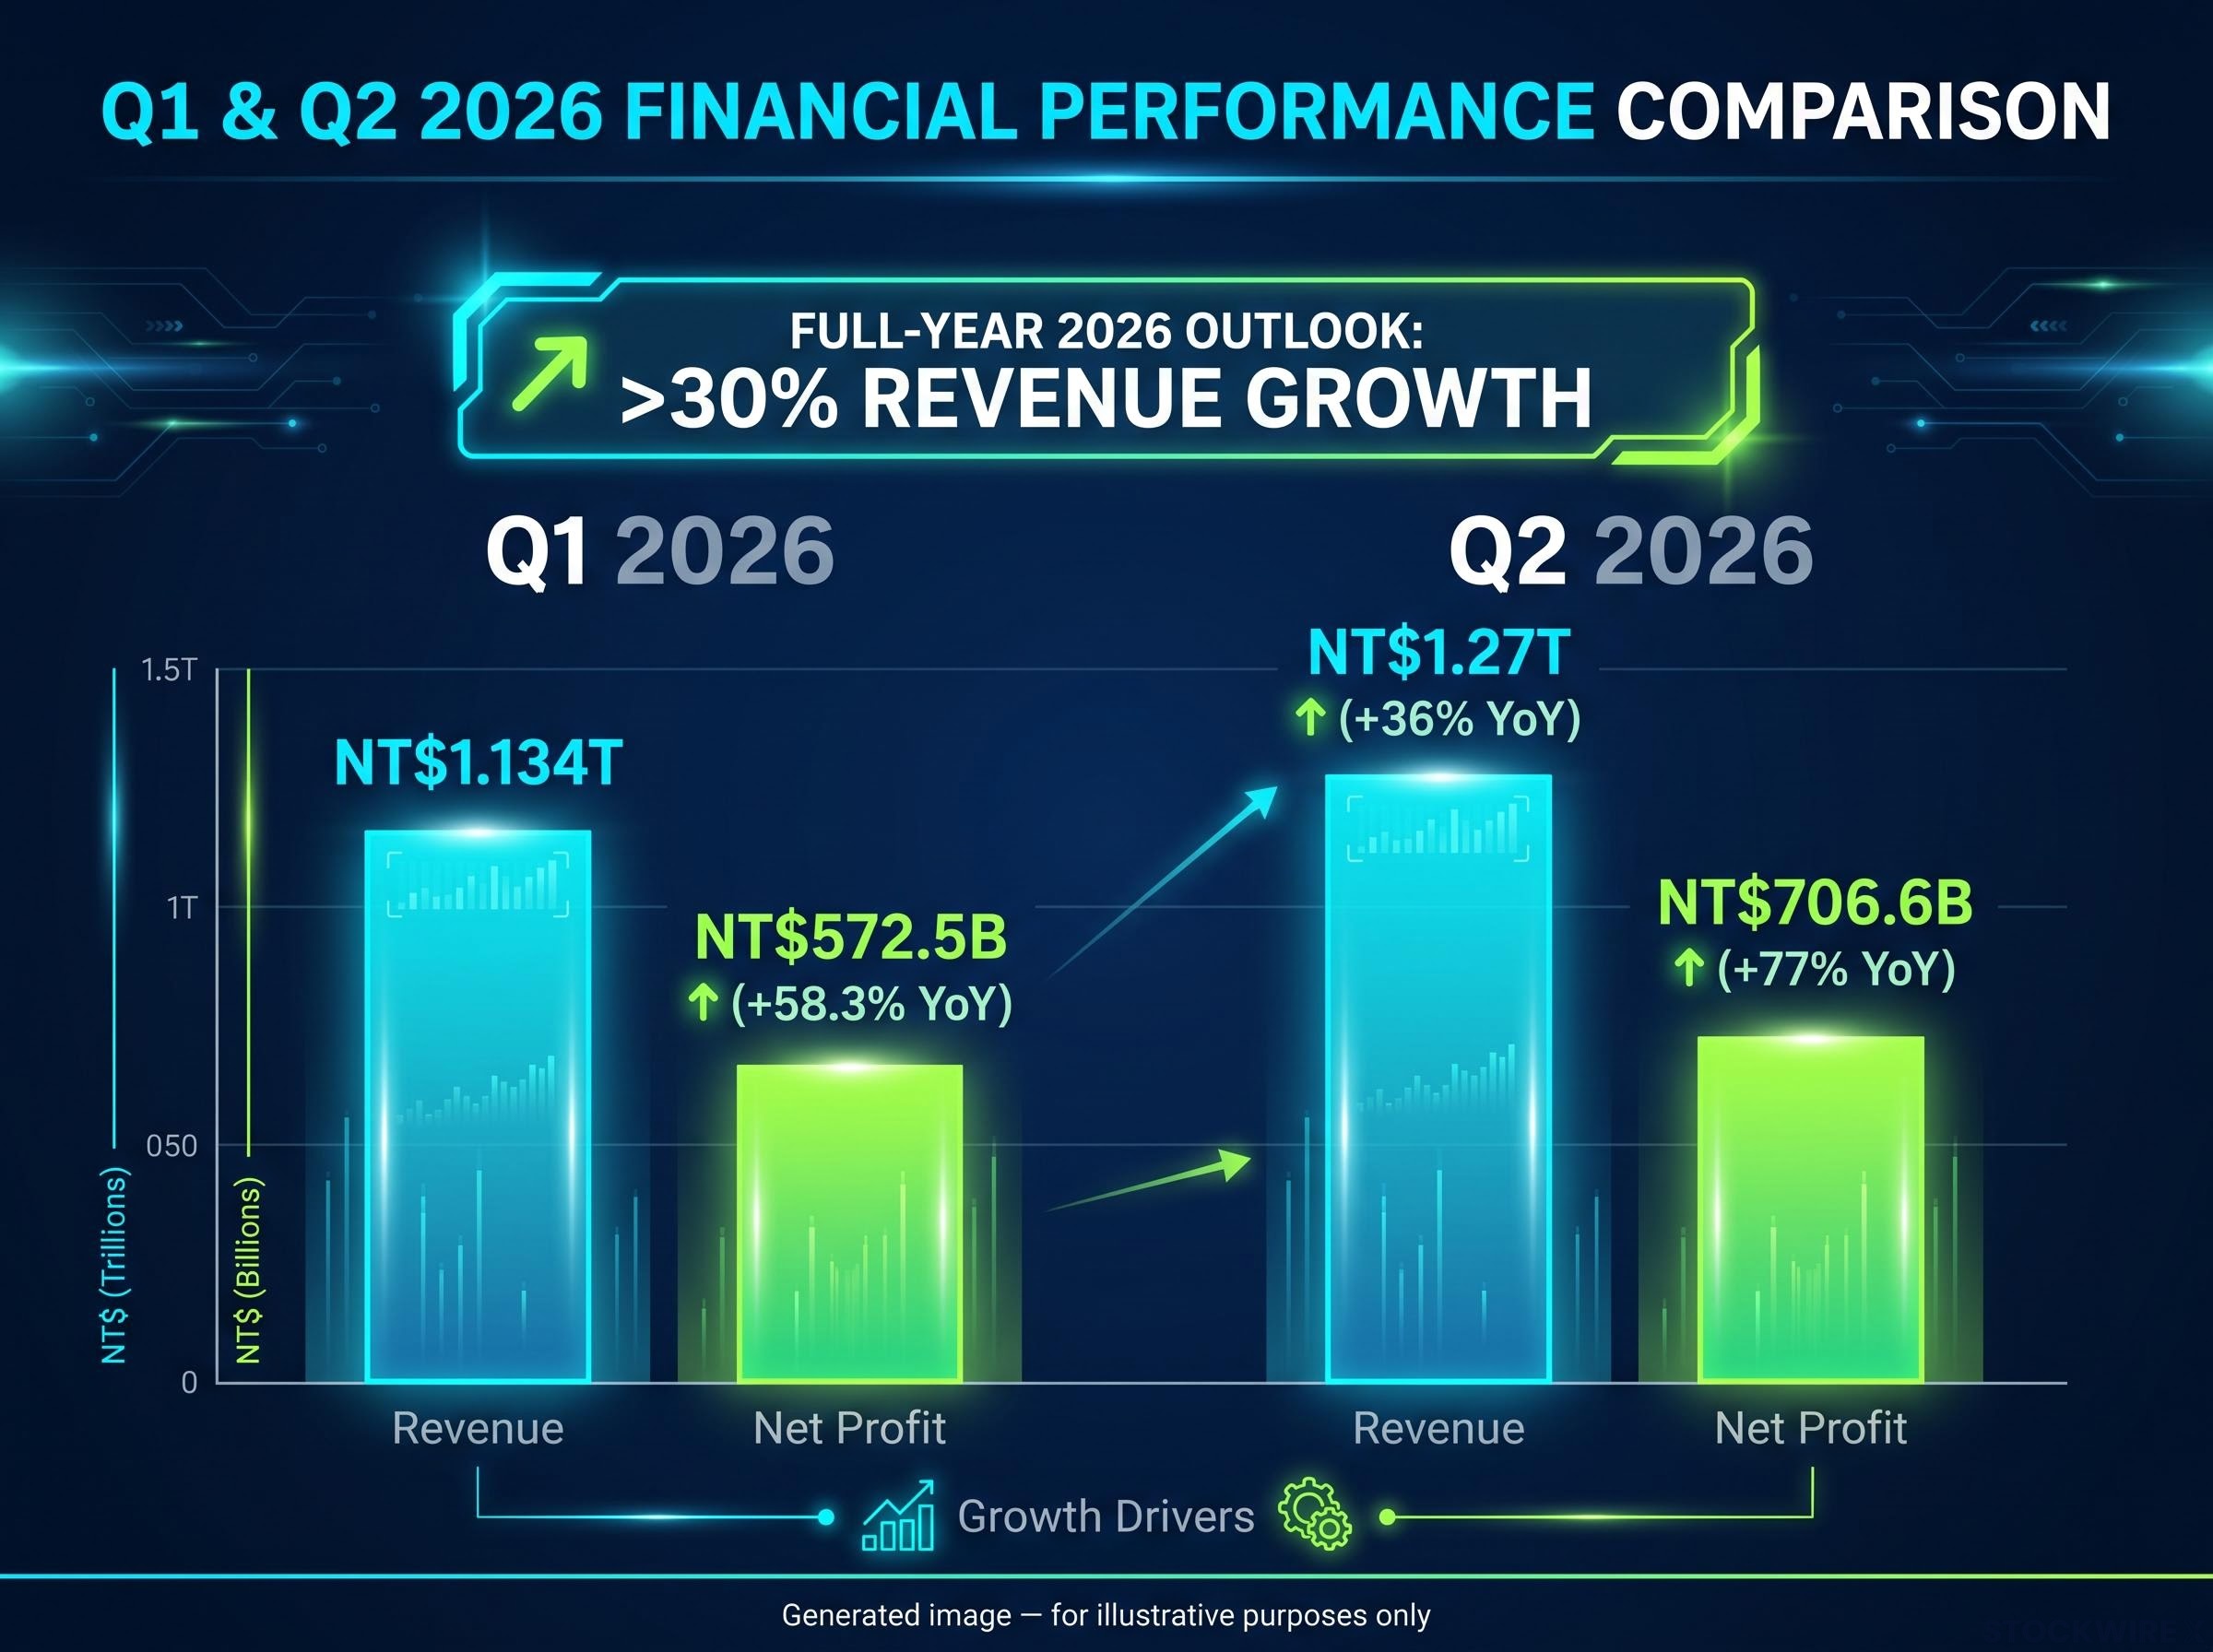
In Q2 2026, TSMC recorded net profit of NT$706.6 billion (approximately $22 billion) on revenue of NT$1.27 trillion (approximately $39.6 billion). Both numbers represent new all-time highs for the company. Revenue expanded 36% year-over-year while profit climbed 77%.
The sequential pattern is where the real signal sits. Q1 2026 had already been a record quarter, with net profit of NT$572.5 billion (up 58.3% year-over-year). Q2 did not just maintain that pace. It accelerated. The jump from 58% profit growth to 77% tells you that AI hardware demand is not plateauing but still building quarter by quarter.
TSMC also raised its full-year 2026 revenue outlook to above 30% growth. Even elevated consensus expectations undershot reality.
| Metric | Q1 2026 | Q2 2026 | YoY growth (Q2) |
|---|---|---|---|
| Net profit (NT$) | NT$572.5B | NT$706.6B | 77% |
| Net profit (USD) | ~$17.8B | ~$22B | 77% |
| Revenue (NT$) | NT$1.134T | NT$1.27T | 36% |
For investors tracking the AI cycle, sequential acceleration is a more meaningful signal than a single record quarter. This is not a peak. It is a step-up in a continuing trend.
When big ASX news breaks, our subscribers know first
Why TSMC’s result is a proxy for the entire AI infrastructure cycle
TSMC builds the leading-edge chips that power Nvidia, Apple, and other significant AI hardware customers’ products. It does not design them. It builds them to order. That distinction matters, because TSMC’s revenue is a downstream measure of what hyperscalers and hardware companies have already committed to spend, not what they plan to spend.
A 77% profit surge represents orders placed, wafers shipped, and invoices paid. This is committed capital flowing through the supply chain, not speculative demand.
Hyperscaler capex commitments reached $130 billion in Q1 2026 alone across Amazon, Microsoft, Alphabet, and Meta, making the orders that produced TSMC’s record shipment volumes a downstream consequence of decisions made months earlier at the data centre budget level.
TSMC raised its full-year 2026 revenue guidance explicitly on the strength of AI:
TSMC lifted its full-year 2026 revenue outlook to above 30% growth, citing AI data centre and accelerator demand as the primary driver.
What ASML’s concurrent upgrade adds to the picture
ASML, the lithography equipment supplier whose machines are essential to leading-edge chip production at fabs including TSMC, updated its guidance upward on 15 July 2026, the day before TSMC published its results. When toolmakers lift guidance alongside fabs, it signals that capital equipment orders are also expanding. Those orders are a leading indicator of future fab capacity, which reinforces the durability of the spending cycle.
The simultaneous positive signals from TSMC and ASML tell you that AI spending is distributed across the supply chain, not concentrated at a single point. That breadth makes the demand structurally more durable than a cycle reliant on one customer or one product.
Understanding why semiconductor stocks swing on strong earnings
Semiconductor stocks have already rallied sharply on AI optimism throughout 2025 and into 2026. That means current share prices reflect not just today’s record results but expectations of sustained growth well into the future. This is what markets call “priced-in expectations”: even a genuine earnings beat can disappoint if the market had already assumed something even stronger.
Early on 17 July 2026, with TSMC’s results now public, S&P 500 futures were trading 0.2% lower while Nasdaq 100 futures had slipped 0.4%. That muted reaction, against a record print, is the valuation debate in action.
Three concurrent variables shaped the session:
- TSMC’s results, which validated the underlying strength of AI chip demand
- June U.S. inflation figures that came in below forecasts, reducing near-term rate-hike concerns while redirecting attention to whether earnings momentum can underpin current equity valuations
- Continued unease over military developments in the Middle East, dampening broader risk appetite
The gap between TSMC’s fundamental strength and the cautious futures reaction tells you that valuation, not AI demand, is now the primary variable investors are wrestling with. The market is not debating whether AI spending is real. TSMC’s numbers confirm it is. The debate is whether current equity prices already reflect the full extent of the cycle’s upside, and that distinction matters for how you position.
The semiconductor bubble debate has been shaped by free cash flow yield data and positioning metrics that BofA analyst Savita Subramanian published in May 2026, arguing that active long-only overweight at approximately 20% sits at half the 2017 cycle peak, a level that does not characterise speculative excess.
What the results do not resolve about the AI cycle’s durability
The Q2 print materially weakens the near-term case for an imminent AI chip demand collapse. With both Q1 and Q2 2026 at all-time highs, the burden of proof has shifted toward sceptics over a one-to-two year horizon.
But a quarterly result, no matter how strong, operates on a different time horizon from the questions that matter over three to five years. Three medium-term durability issues remain open:
- Hyperscaler monetisation: Whether companies like Microsoft, Google, and Amazon can translate massive AI capex into sufficient revenue and margin to sustain this pace of hardware investment indefinitely
- Demand diversification: Whether spending broadens beyond a handful of very large customers into enterprise and sovereign AI projects, reducing concentration risk
- Chip efficiency gains: Whether improvements in model architectures and processor efficiency eventually temper hardware volume growth, as each new generation of chips does more work per watt
These questions are not visible in today’s numbers, which is precisely why the result feels unequivocally strong while the long-term debate remains unresolved. Both of those things are true simultaneously. Investors who conflate near-term cycle strength (confirmed) with long-term structural durability (still open) risk mispricing their positions in either direction.
Goldman Sachs AI capex analysis published in December 2025 found that analyst estimates for hyperscaler capital expenditure had been consistently underestimated, with the firm projecting AI infrastructure investment exceeding $500 billion in 2026 and flagging the monetisation gap as the central risk to the cycle’s long-term durability.
The indicators that will tell you when the cycle is turning
A quarterly earnings result is a lagging indicator. By the time a record quarter prints, the orders that produced it were placed months earlier. To track the cycle in real time, four forward indicators matter most:
- TSMC’s AI-related revenue mix: Watch for any signs of order concentration among fewer customers, or order push-outs where delivery dates slip. Either would suggest demand is narrowing or softening before it shows up in headline revenue.
- Hyperscaler capex versus monetisation: Track what Microsoft, Google, Amazon, and Meta disclose in their own earnings calls about AI capital commitments relative to the revenue those investments are generating. A widening gap between capex growth and AI monetisation would be an early warning.
Leading versus lagging signals in the semiconductor supply chain
Fab revenue and quarterly profit are lagging indicators; they tell you what was ordered months ago. Equipment orders and hyperscaler capex guidance are leading indicators; they tell you what capacity will be built six to twelve months from now. Monitoring the full chain, not just the fab’s results, is how you detect a turn before it arrives.
Semiconductor cycle indicators that separate leading from lagging signals, including equipment order books, ASP trends, and memory oversupply timing, matter significantly more in a cycle where fab revenue is printing record highs while a confirmed supply wave is scheduled to arrive between 2027 and 2029.
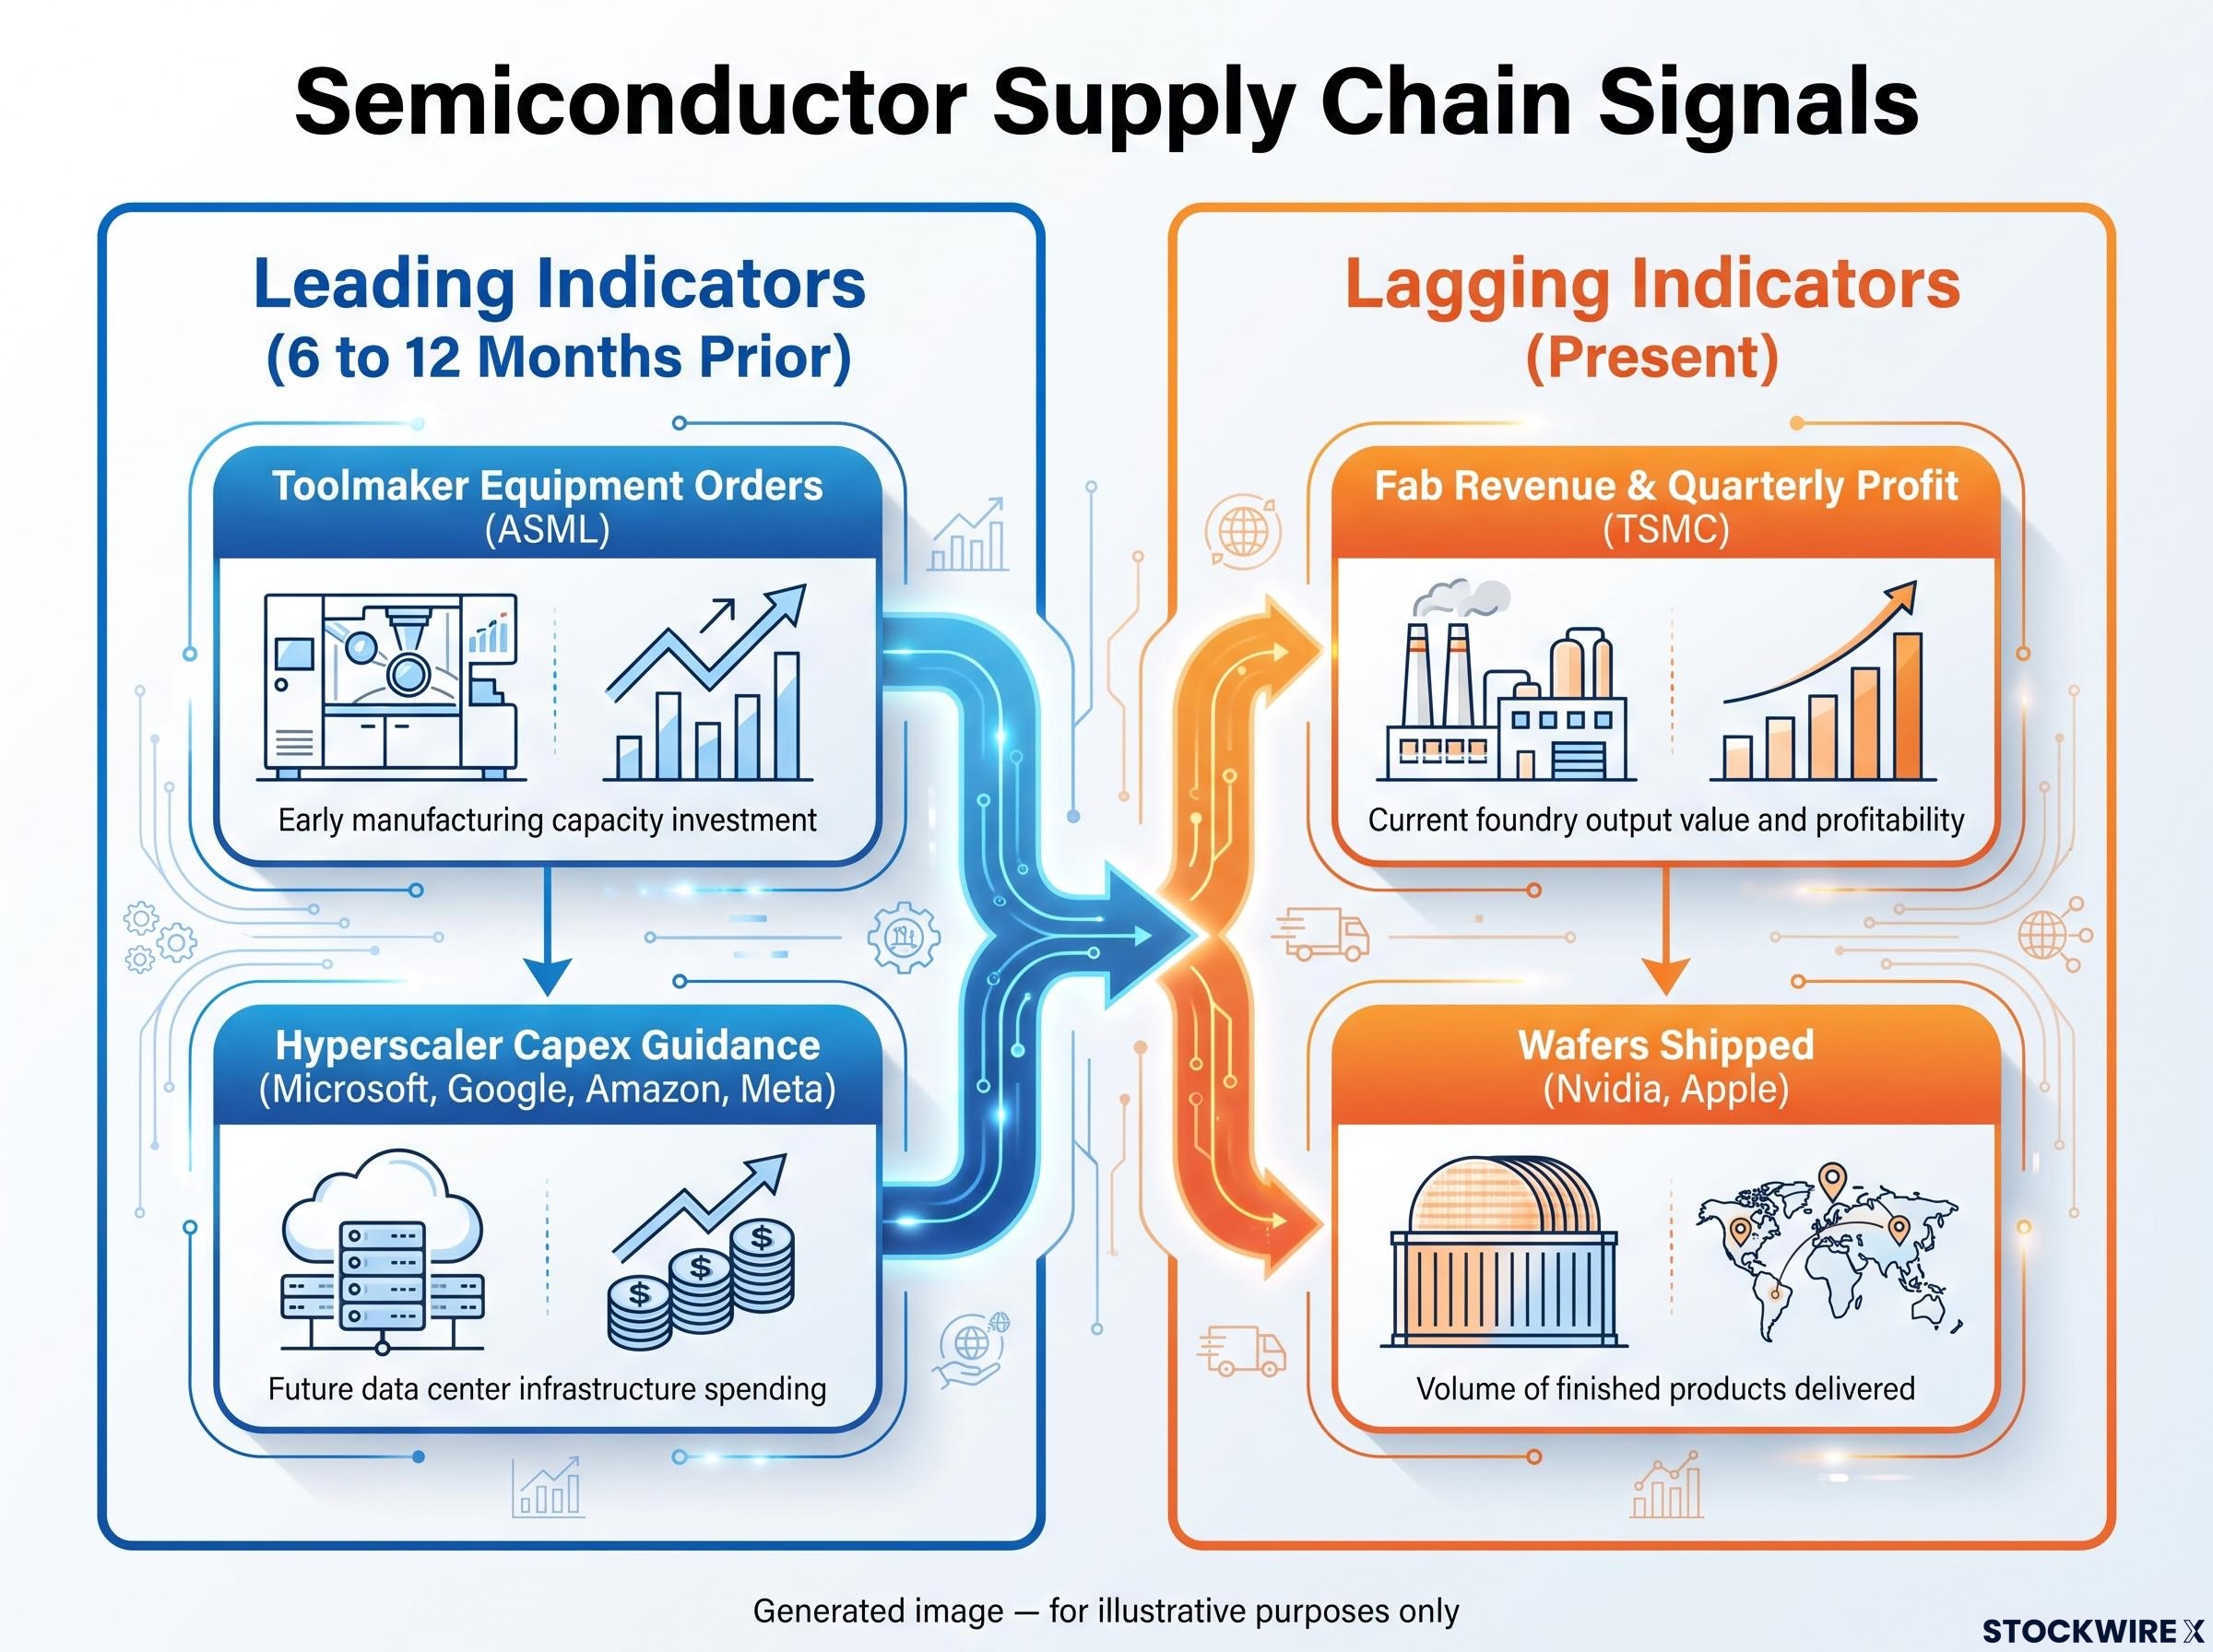
- Toolmaker order trends: ASML and peer equipment suppliers’ order books and backlog quality are the earliest available signal of where the cycle is heading. These orders precede fab revenue by six to twelve months.
- Demand breadth: Whether enterprise and sovereign AI projects begin to contribute meaningful volume beyond hyperscaler-led demand. Broadening demand would extend the cycle; persistent concentration would leave it vulnerable to a spending pause from any single large customer.
Record profits confirm the cycle is still running, but the valuation call remains yours to make
Taken together, the Q2 2026 figures and ASML’s simultaneous guidance upgrade constitute the most compelling available evidence that AI infrastructure spending is genuine, broad-based, and still gathering pace over the near term. Anyone arguing that AI hardware demand is overstated now has to contend with two consecutive record quarters of hard shipment and revenue data pointing the other way.
TSMC raised its full-year 2026 revenue outlook to above 30% growth, driven by AI data centre and accelerator demand.
That said, the three medium-term durability questions around hyperscaler monetisation, demand diversification, and efficiency-driven volume compression remain open over a three-to-five year horizon. The record profit does not resolve the valuation debate. It changes where the burden of proof sits.
The forward indicators identified above, particularly toolmaker order books and hyperscaler capex-to-monetisation ratios, are the practical tools for refining your view as new data arrives. The cycle is running. Whether current prices already reflect that is a separate question, and it is yours to answer.
For readers wanting to understand which parts of the supply chain are capturing the most margin from the same capex wave driving TSMC’s results, our comprehensive walkthrough of AI supply chain profit distribution maps where earnings are genuinely concentrated across foundries, memory, networking, and software layers.
This article is for informational purposes only and should not be considered financial advice. Investors should conduct their own research and consult with financial professionals before making investment decisions. Past performance does not guarantee future results.