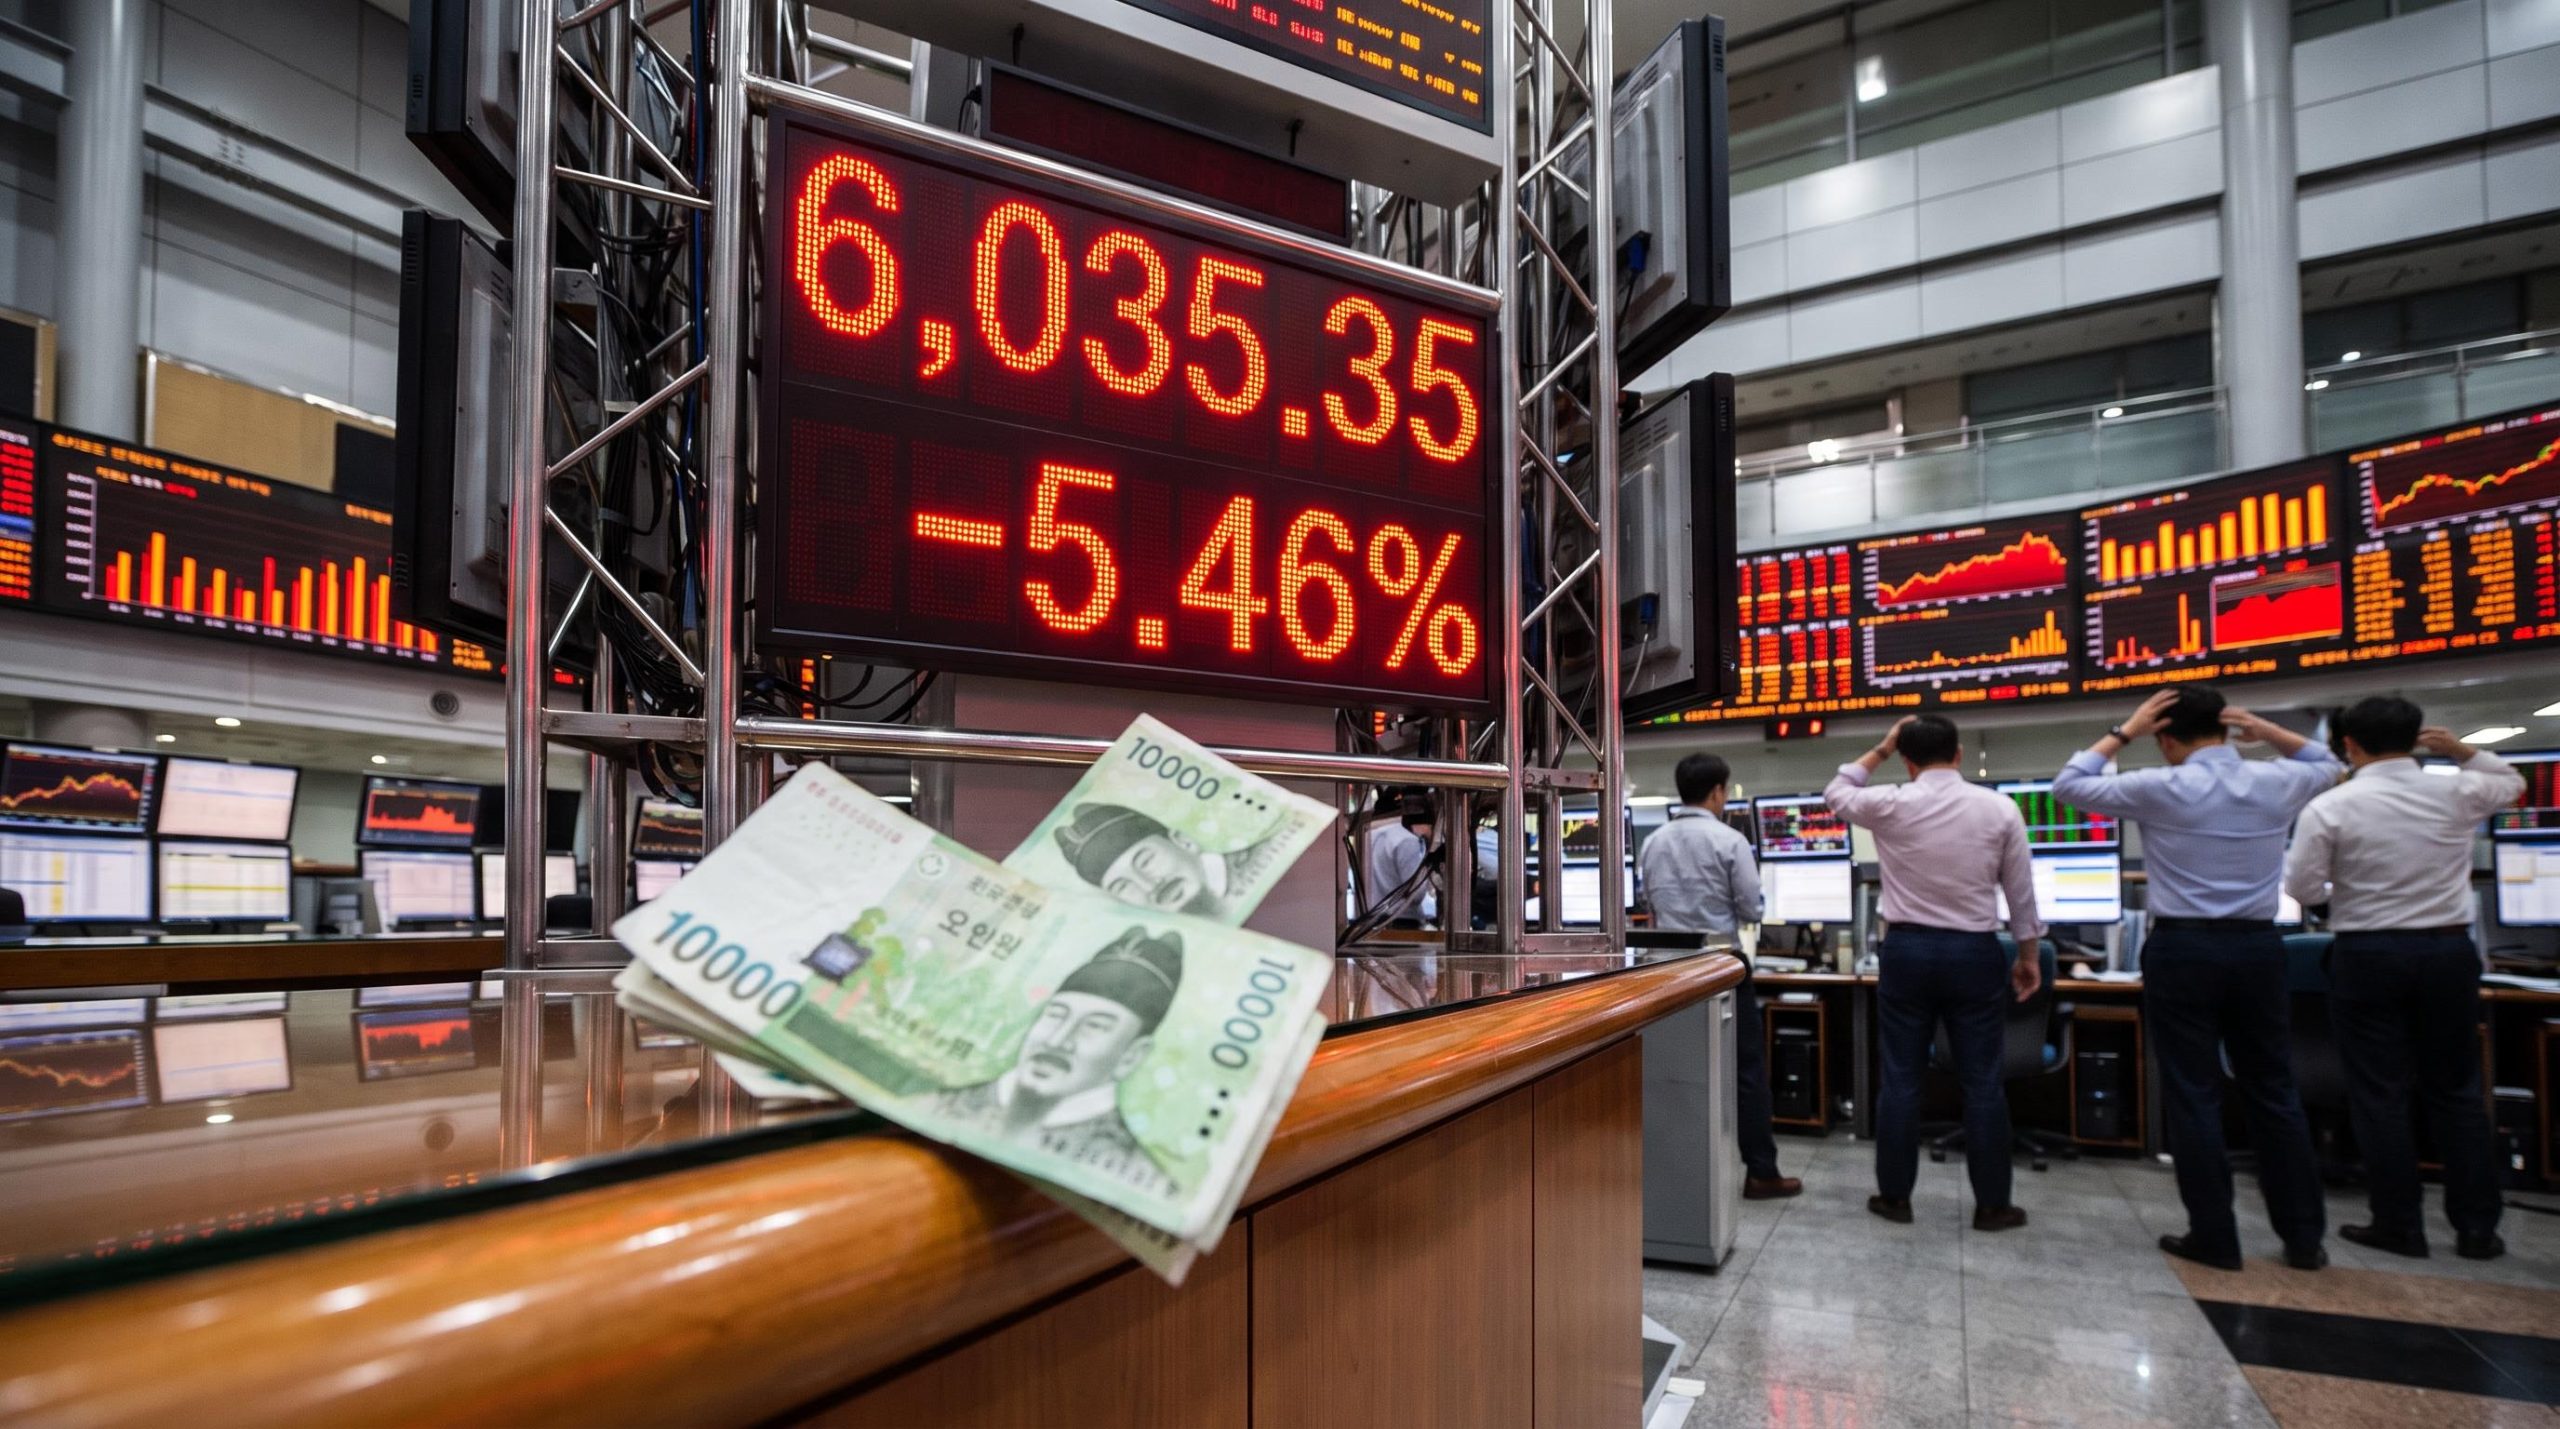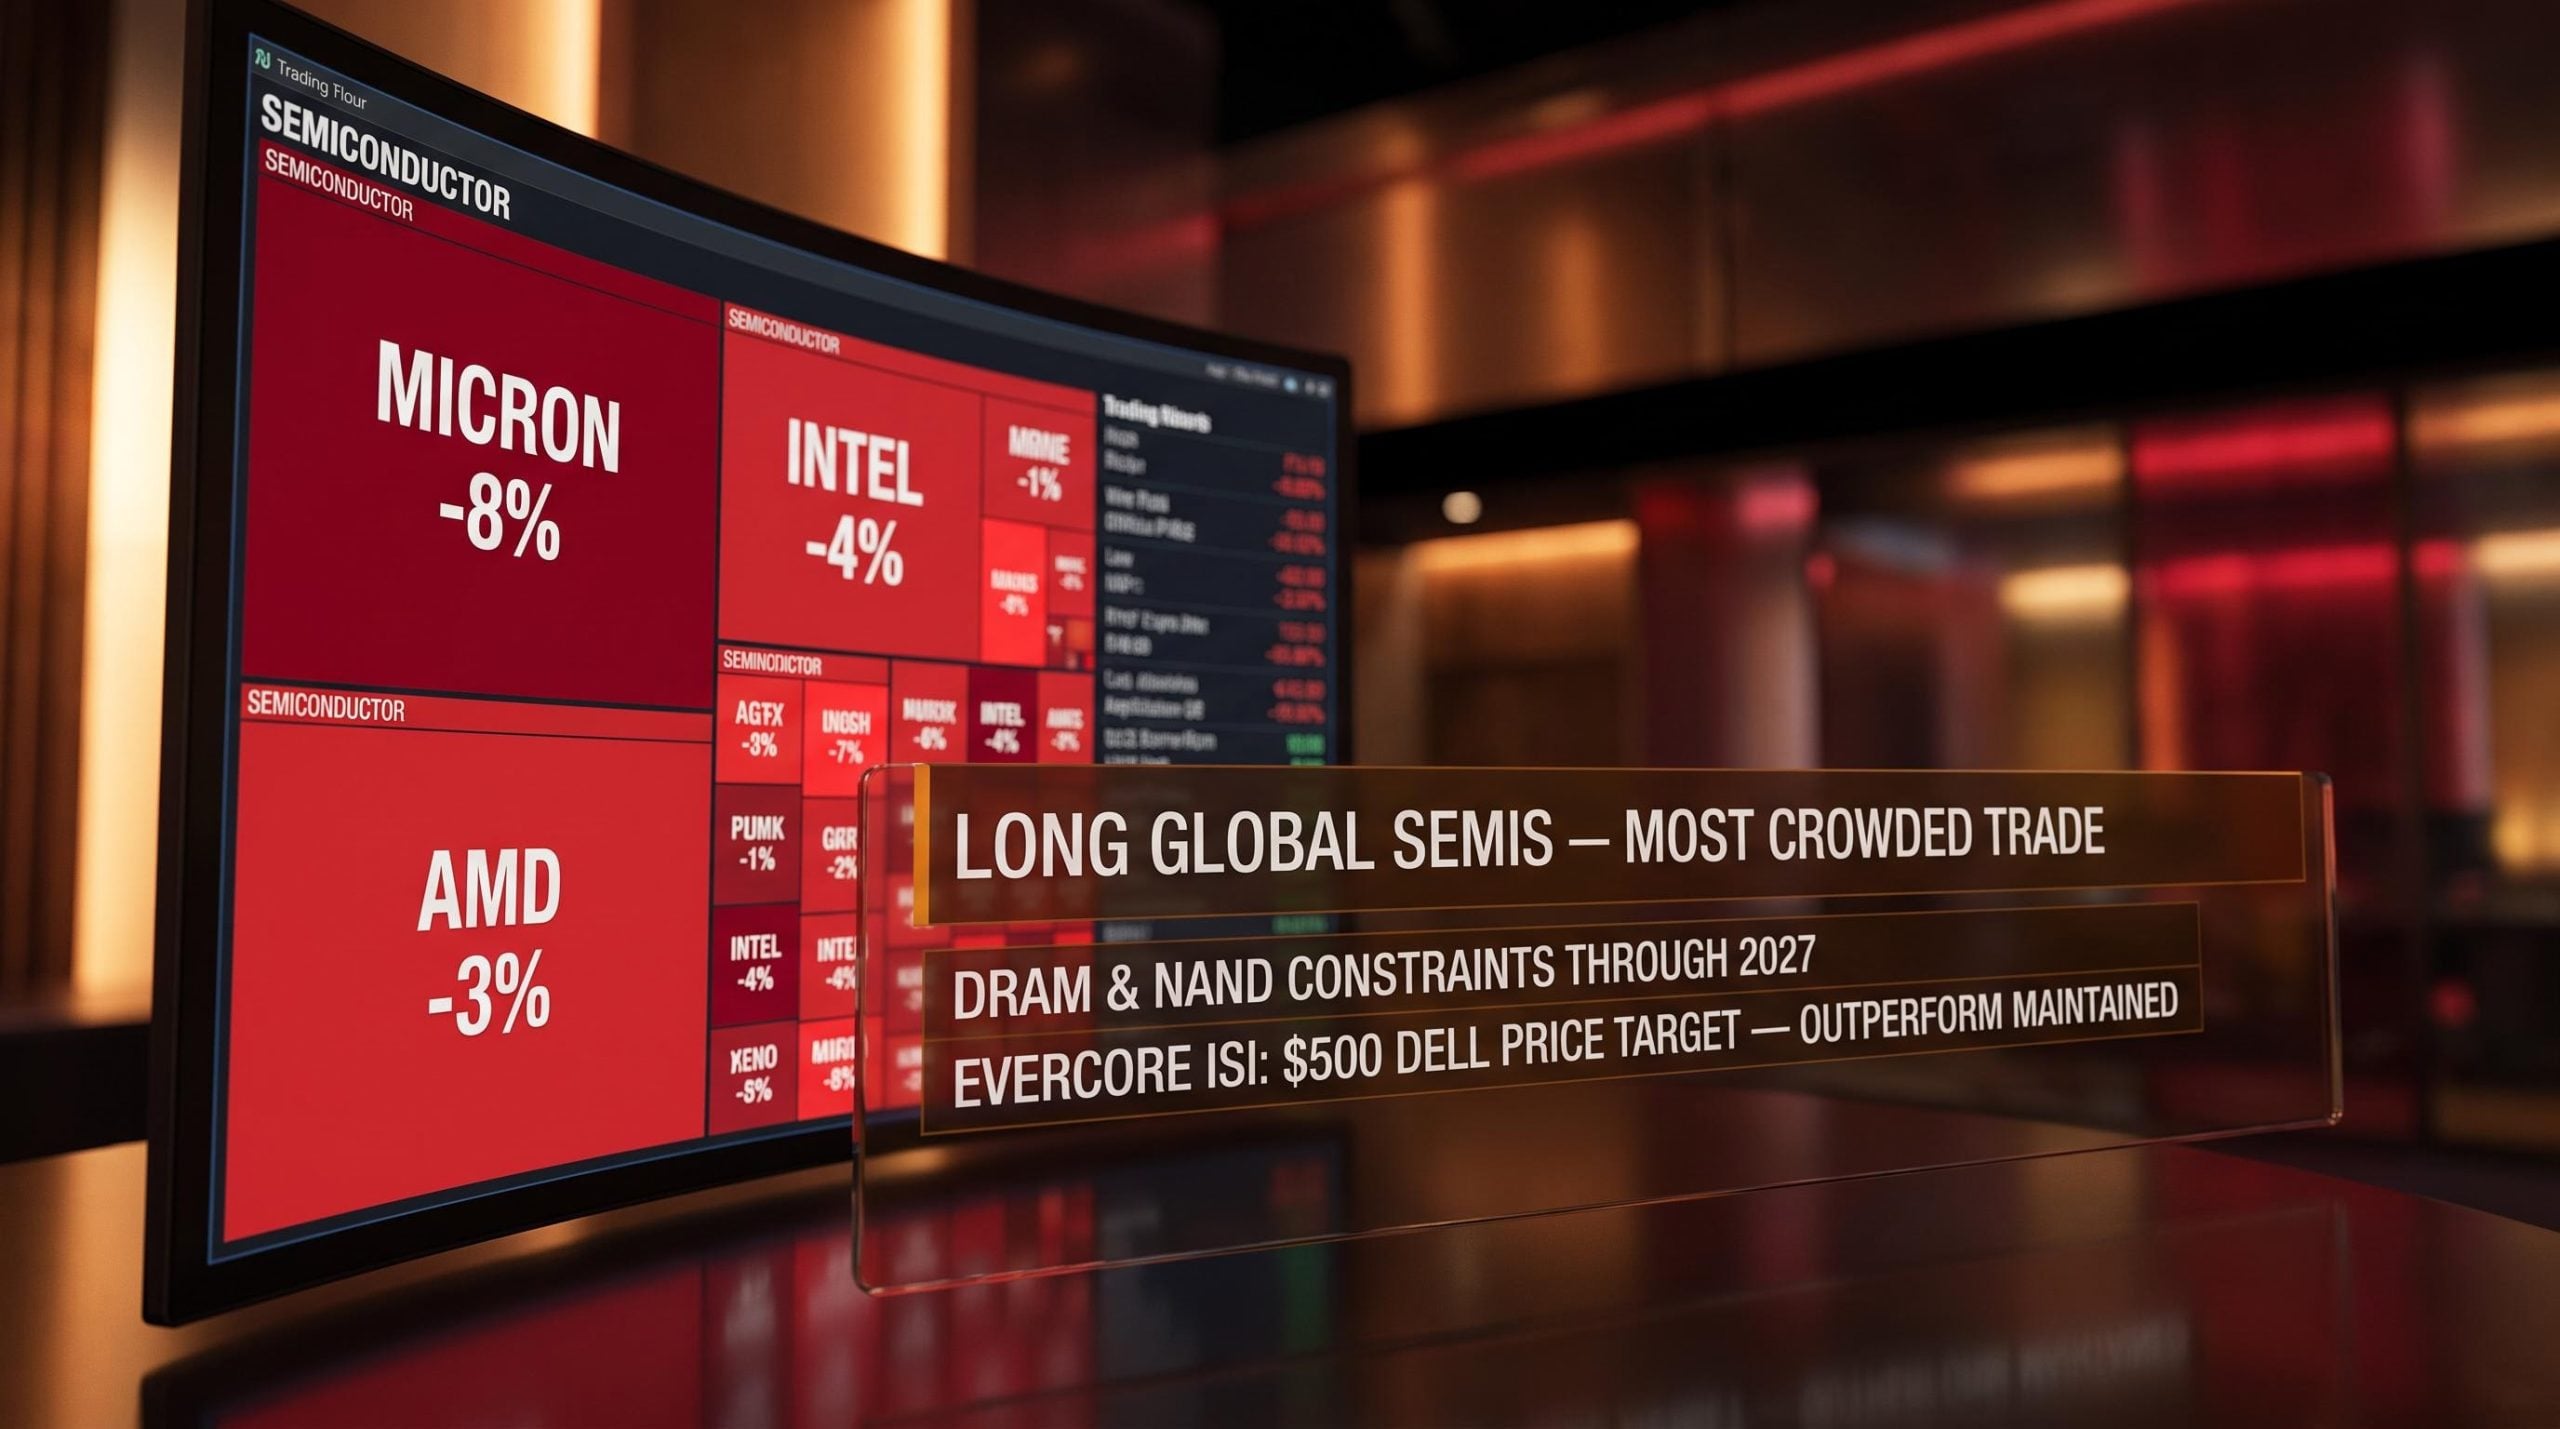
Micron fell 8%. Intel lost over 4%. AMD gave up 3%. All in a single session on 15 July 2026, and all because of a news story about a company that was exploring, not executing, a hedging strategy on memory prices.
Bank of America’s July 2026 fund manager survey, published that same week, had already identified long global semiconductors as the single most crowded trade in the market. That is not background colour. It is the mechanism. A crowded trade does not need a strong reason to sell off; it needs only a plausible-enough headline to trigger the machinery of forced selling.
Here is how to separate the mechanical price action from the underlying supply-demand story, why Evercore ISI’s channel checks are telling a different story from the tape, and what framework you can use the next time an ambiguous catalyst hits a crowded sector.
What the market saw and what it missed
According to a Reuters report, CoreWeave had begun looking at derivatives and put options as a way to protect against falling memory and storage prices. The company had entered supply agreements incorporating price floors and ceilings and was evaluating put options as a hedging mechanism.
The operative word is “exploring.” No hedges had been executed as of the report date.
- Micron: down 8% on the session
- Intel: down more than 4%
- AMD: down 3%
The market read an exploratory treasury action as a directional call on the memory cycle. A large buyer investigating optionality in an elevated-price environment is standard risk management. It is a company evaluating what tools are available, not a company placing a bet that prices are about to collapse.
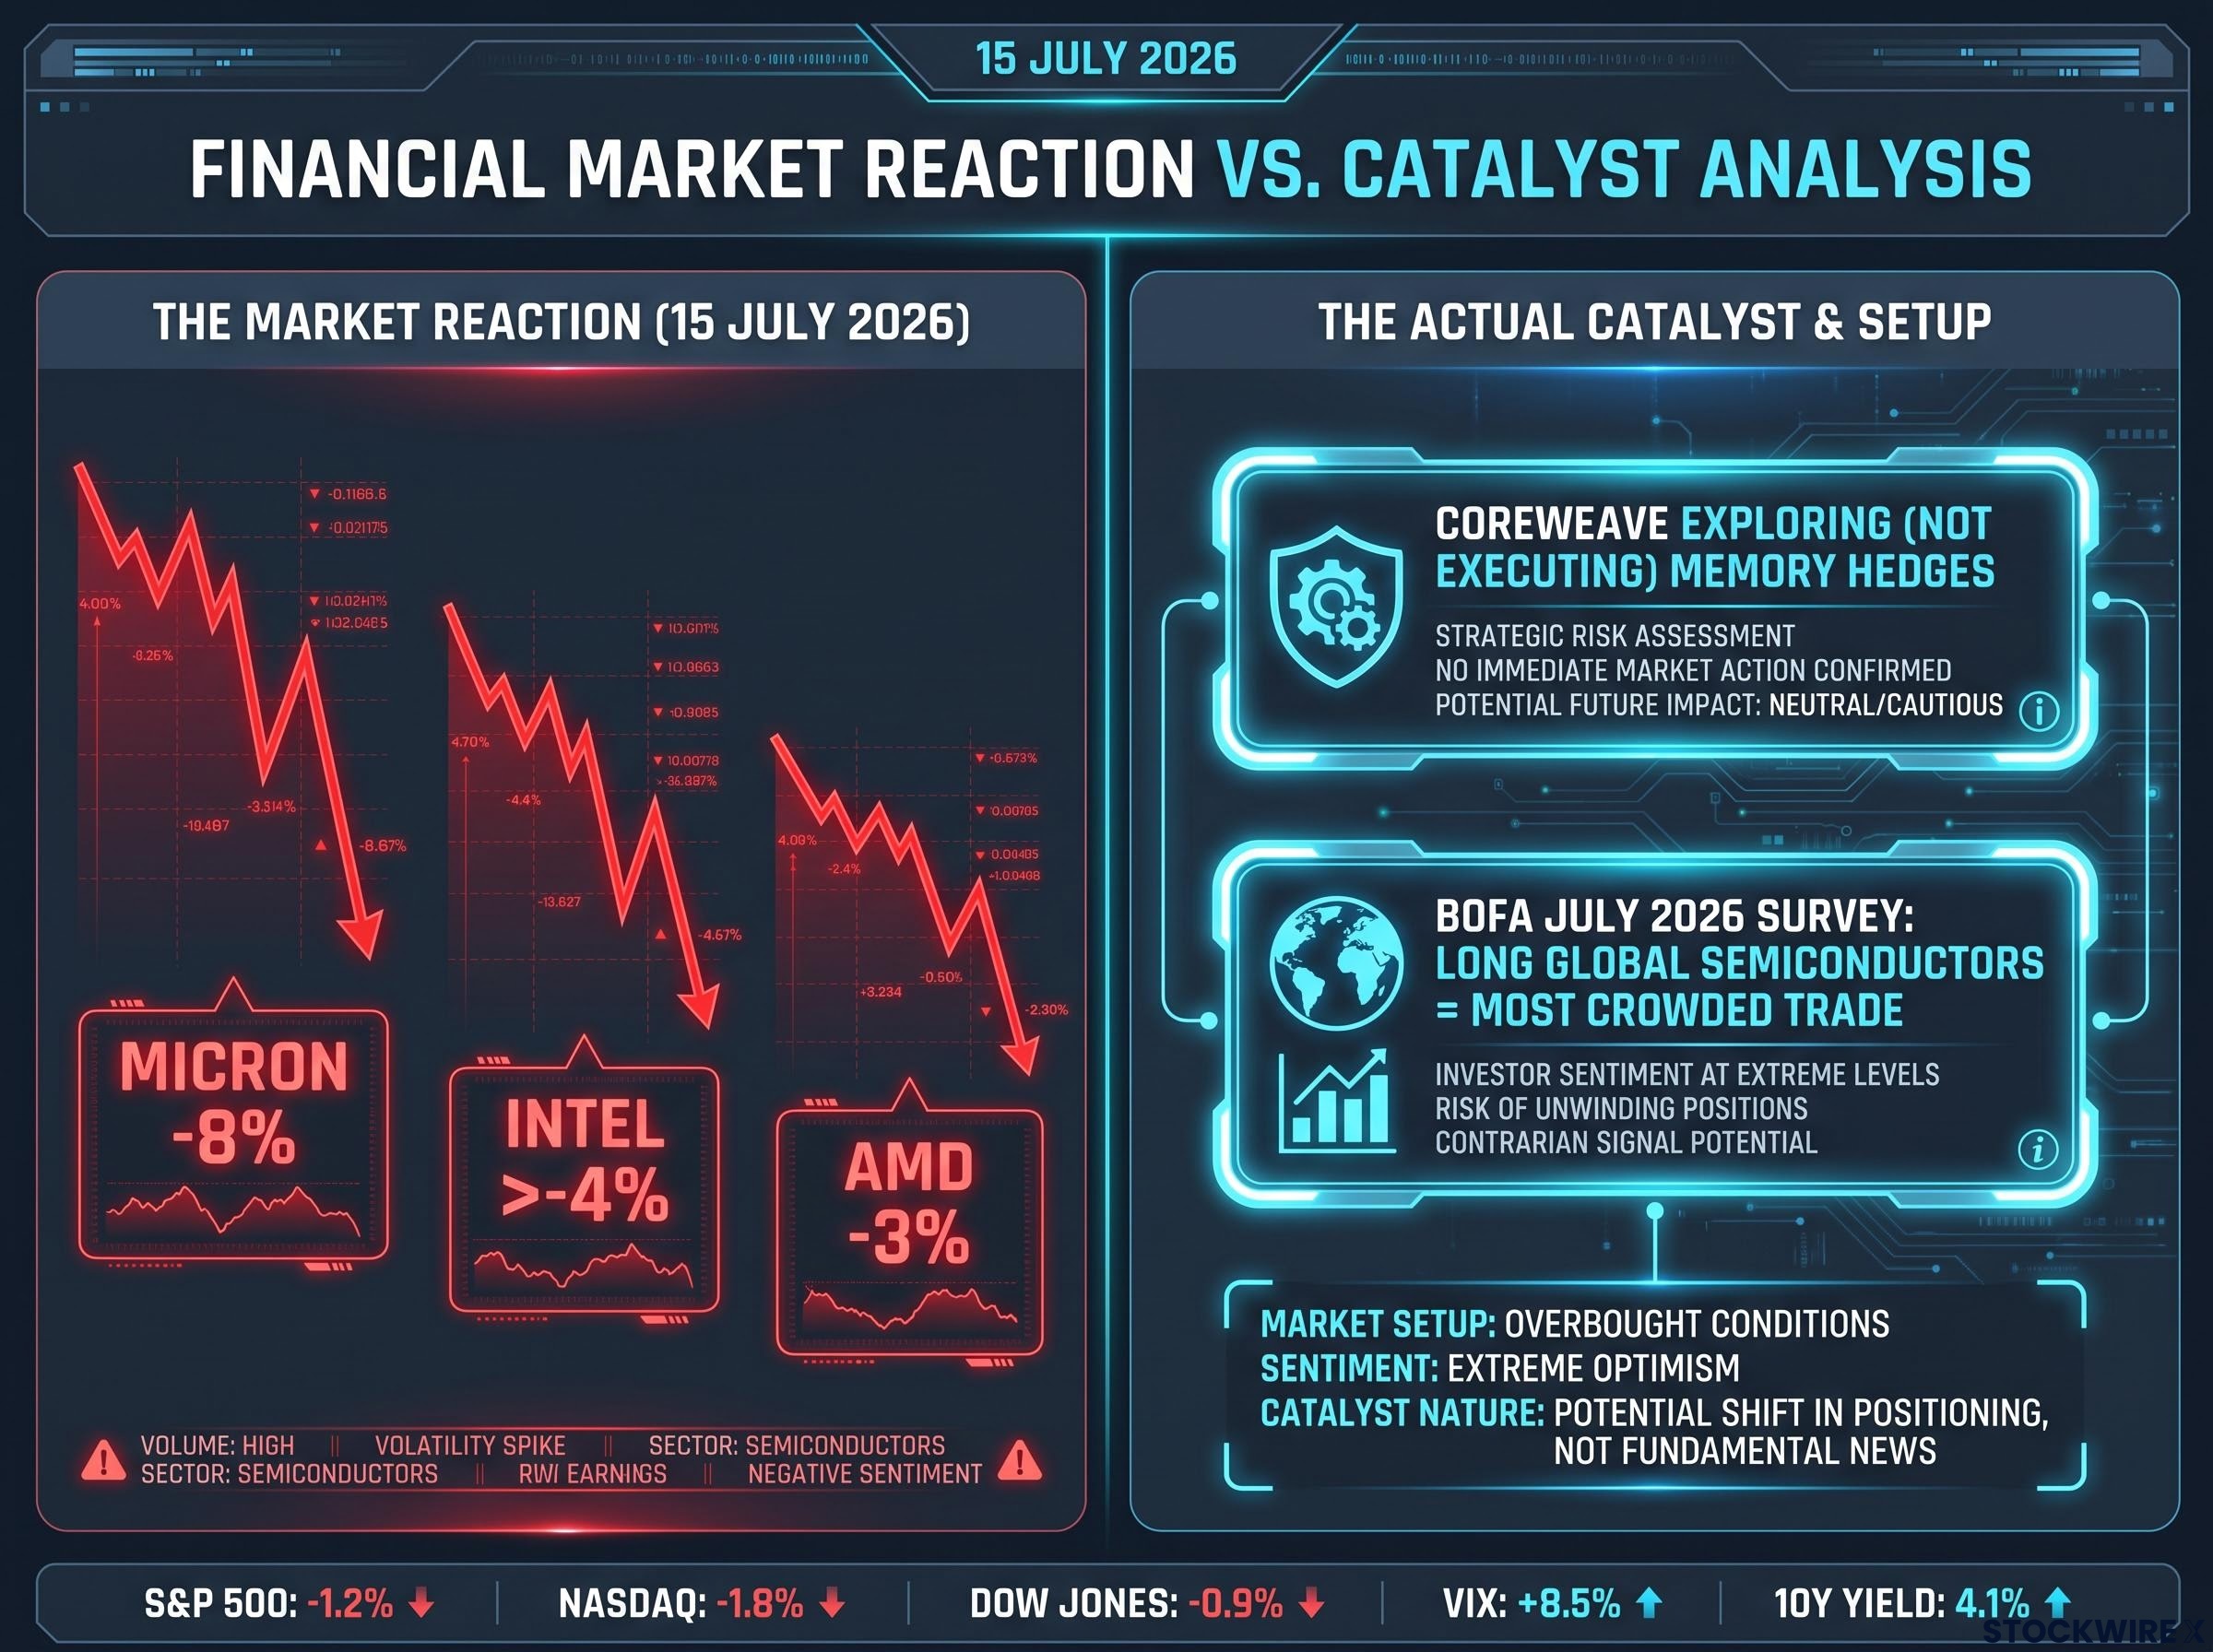
The core distinction, per Evercore ISI: Exploring hedges does not equal executing hedges. CoreWeave was assessing its options in a volatile procurement environment, not sending a signal that memory prices had reached their ceiling.
That distinction matters more than it might appear. For you, it is the entire difference between reading a corporate treasury disclosure as a macro signal and recognising it as what it actually is: a procurement team doing its job in a volatile market. The Bank of America July 2026 fund manager survey had already tagged long global semiconductors as the most crowded trade on the board. In a trade that crowded, even an ambiguous headline is enough to start the selling.
When big ASX news breaks, our subscribers know first
The mechanics behind an 8% move in a single session
The severity of the move told you far more about who owned the trade than about what had changed in the earnings outlook.
When positioning amplifies price action
When a negative catalyst hits a crowded position, three mechanical forces compound the selling simultaneously:
- Stop-losses trigger as prices breach pre-set thresholds, converting unrealised losses into executed sell orders
- Value-at-risk (VAR) limits, the maximum loss a fund’s risk model allows in a position, force portfolio managers to reduce exposure regardless of their fundamental view
- Concentration rules require rebalancing when a single sector’s weight exceeds a portfolio’s mandate, generating additional selling pressure
Each of these mechanisms operates independently of the catalyst’s informational content. No new earnings guidance emerged during the session. No capacity-addition surprise. No memory glut data. The only thing that changed was a risk-management headline in the most crowded trade in the market.
The BofA July 2026 survey result did not emerge from nowhere; crowded-trade dynamics in AI semiconductors had been building since at least June, when UBS and Citi issued simultaneous warnings that the concentration of institutional positioning had created a structural fragility entirely separate from any fundamental thesis about memory demand.
The BofA survey had already told you the setup: when every large fund owns the same trade, the first wave of selling forces the second wave, which forces the third. The magnitude of the decline is a function of crowding, not of evidence. For you, the lesson is direct: the severity of a sell-off in a crowded trade tells you about the structure of who owns it and how they are positioned, not about whether the underlying thesis has broken.
What Evercore ISI’s OEM checks are actually showing
While the tape was pricing in a memory-cycle peak, Evercore ISI was hearing something different from the companies that actually buy and deploy memory at scale.
According to the firm’s OEM and supply-chain channel work, DRAM and NAND supply is becoming more constrained as 2026 draws to a close, with that tightness forecast to carry through the bulk of 2027. This is not a projection built on modelling assumptions. It comes from direct conversations with the companies placing orders.
In meetings with Dell’s CEO and CFO, Evercore ISI heard that AI demand is materially ahead of supply, and that the imbalance is expected to be more acute in 2027 than in 2026, with DRAM and NAND identified as the primary bottlenecks.
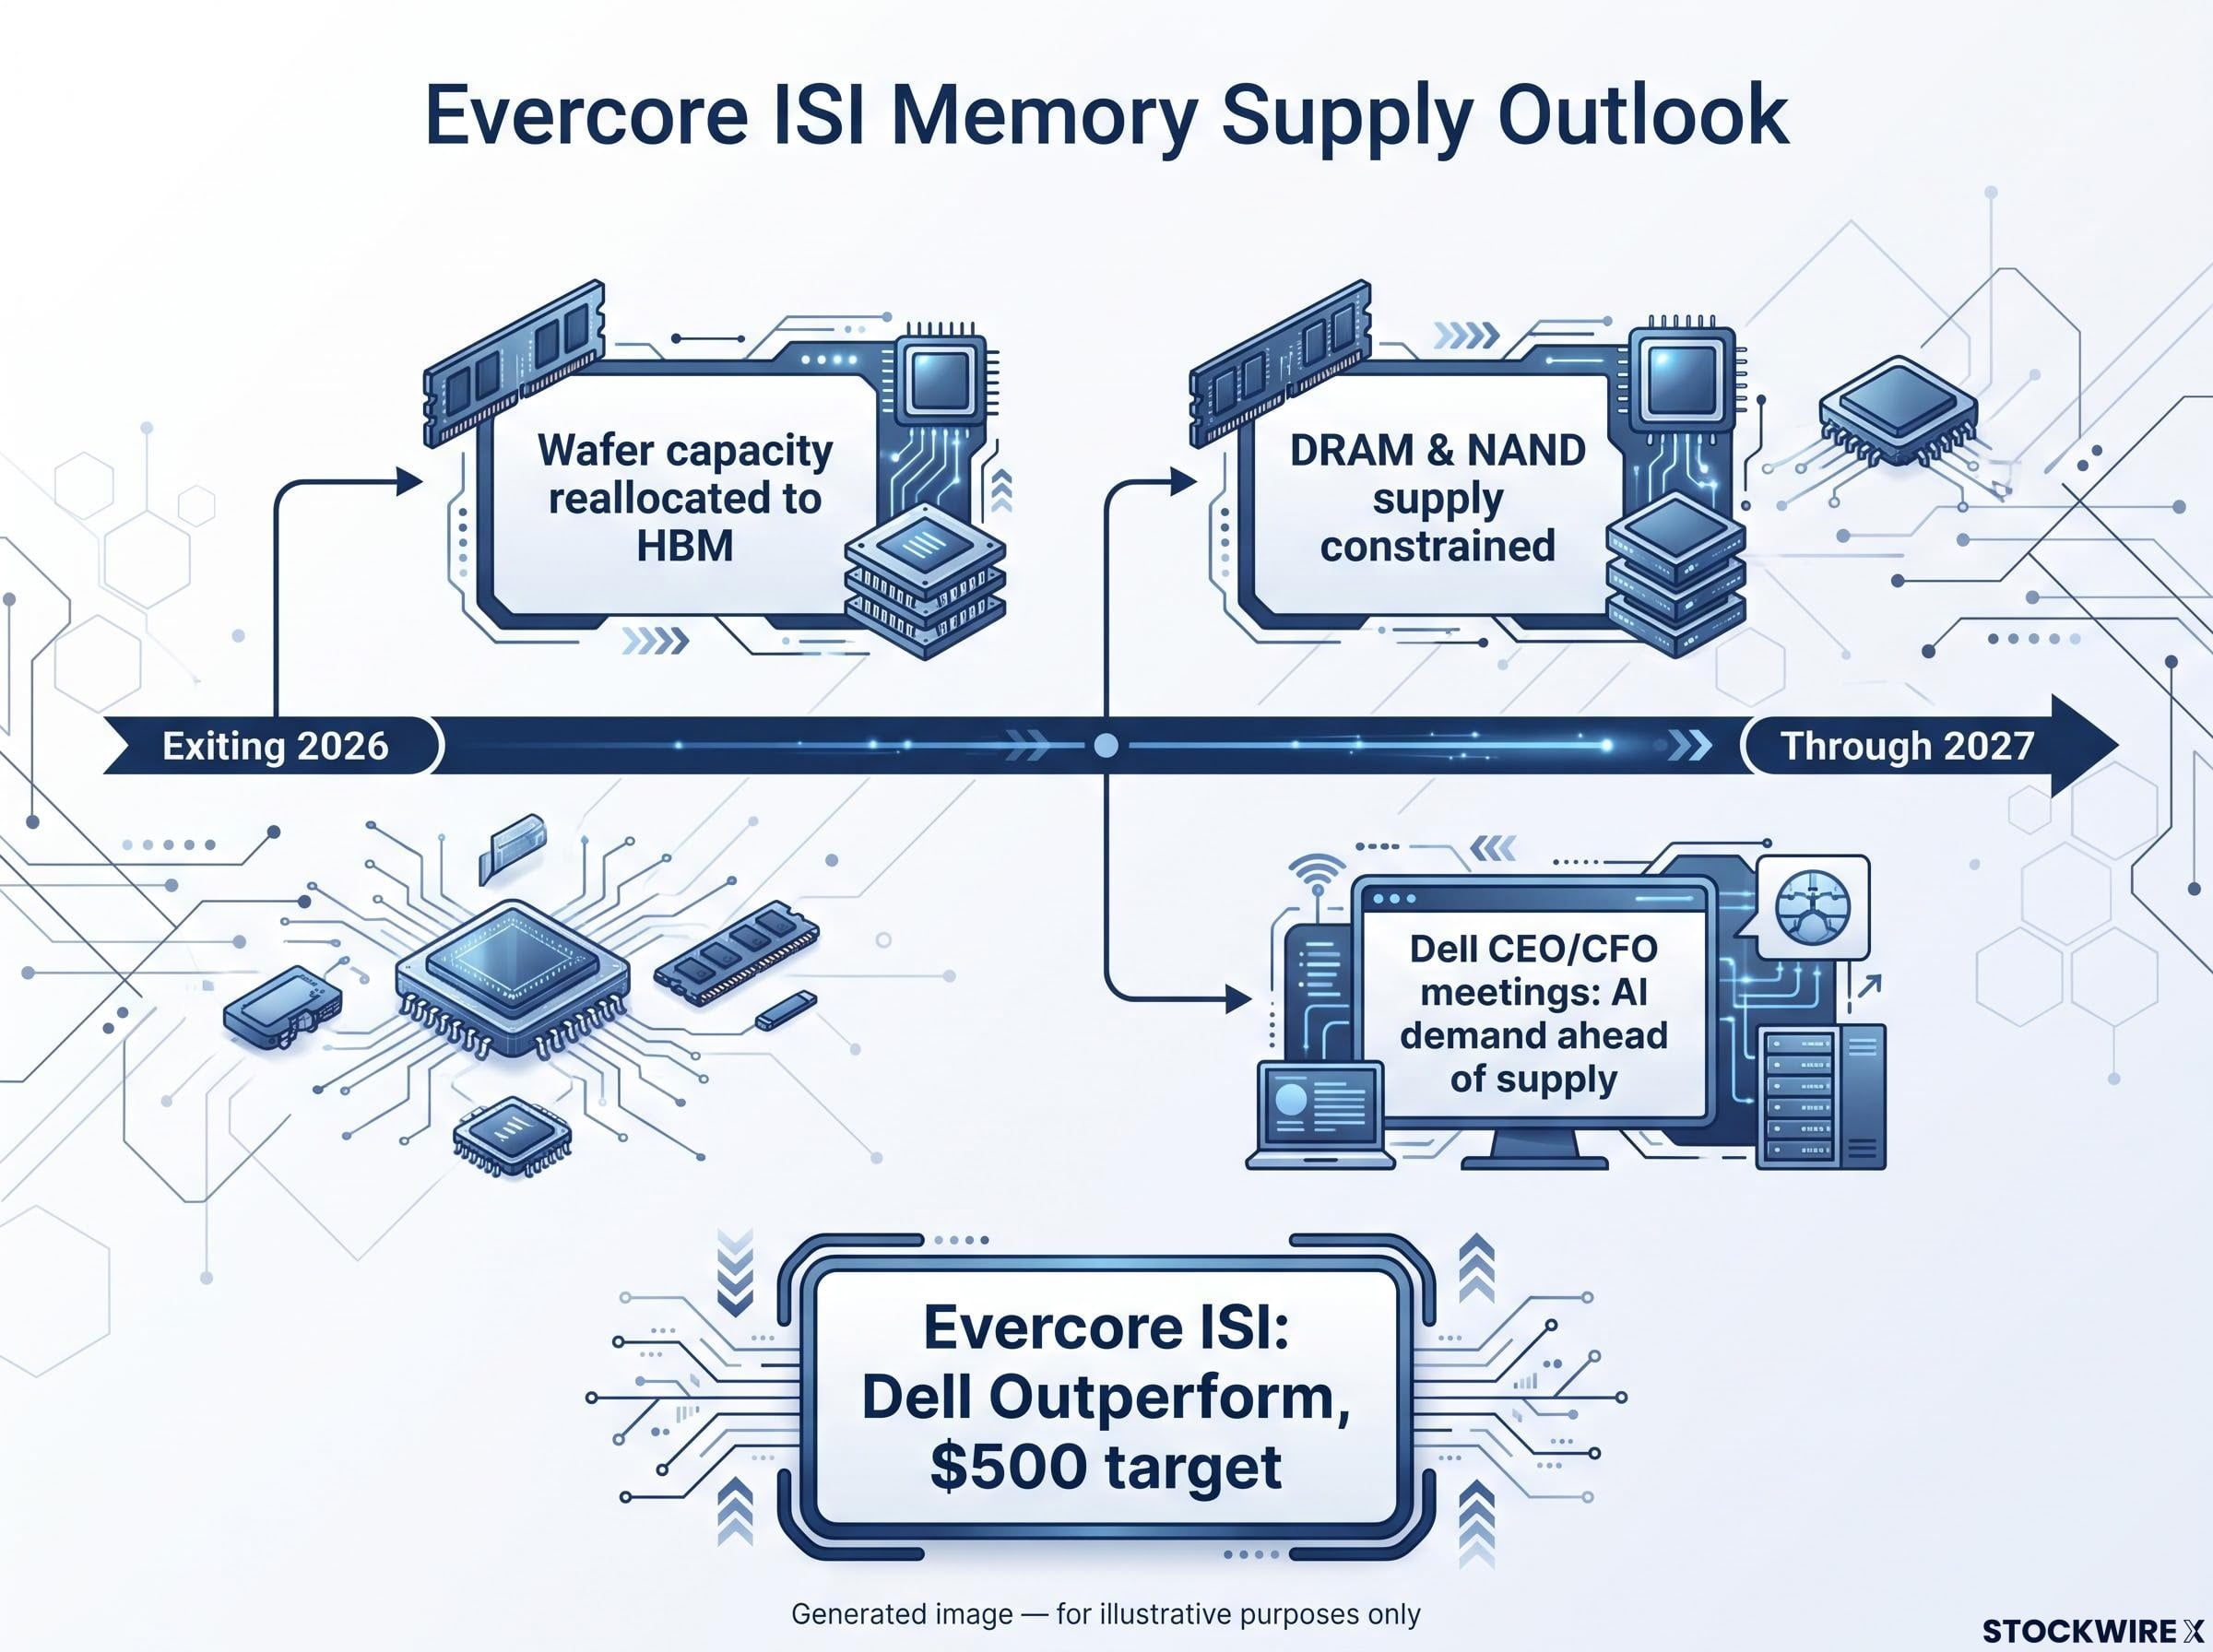
The structural mechanism underneath this is straightforward. The industry is reallocating wafer capacity toward HBM (high-bandwidth memory, the specialised memory used in AI accelerators) and advanced DRAM. That reallocation constrains conventional DRAM and NAND output simultaneously. Supply is not just tight because demand is strong; it is tight because the capacity that could serve conventional memory is being redirected toward AI-specific products.
| Data point | Source | Time horizon | Implication |
|---|---|---|---|
| DRAM and NAND constraints worsening | Evercore ISI OEM checks | Exiting 2026, through most of 2027 | Supply scarcity supports pricing power |
| AI demand ahead of supply; imbalance more acute in 2027 | Dell CEO and CFO meetings (Evercore ISI) | 2026-2027 | Bottleneck deepening, not easing |
| Outperform rating, $500 price target on Dell maintained | Evercore ISI | Current | Thesis intact despite CoreWeave headline |
Evercore ISI maintained its Outperform rating and $500 price target on Dell explicitly because supply remains constrained and AI infrastructure demand is intact. When the analyst who covers this space most closely is hearing from Dell’s own management that the supply crunch gets worse next year, not better, you need to weigh that evidence against a market move triggered by a hedging exploration story.
The DRAM supply constraint Evercore ISI identified in its OEM channel checks is corroborated by a broader set of primary-source evidence: SK Hynix projects tightness through 2030, HBM inventory sits at just 3-4 weeks industry-wide, and Google CEO Sundar Pichai has confirmed that memory availability, not capital, is the binding limit on AI infrastructure expansion.
Why lower memory prices are not the same as a broken thesis
Here is where the analysis gets counterintuitive. Even if memory prices do ease moderately, that does not automatically mean the demand story is weakening. It may mean the opposite.
Elevated DRAM, NAND, and HBM prices have delayed some server and storage purchases, particularly in budget-constrained enterprise IT environments. A moderate pricing ease in a still-tight supply environment can pull forward pent-up demand, a dynamic economists call demand elasticity: when the price of a constrained input drops, buyers who had been waiting on the sidelines place orders, and unit volumes expand.
Reading earnings through the ASP-versus-volume lens
The complication for investors shows up in earnings reports. Lower memory prices passed through to customers can make year-over-year revenue comparisons look weaker, even when the company is shipping more units and expanding its AI server footprint. Revenue optics can deteriorate while the underlying business is accelerating.
When a company reports weaker revenue growth alongside expanding unit volumes in AI servers, the reader who understands this dynamic will not misread that earnings print as evidence the cycle has turned. Here is how to separate the two:
- Track the price trend: Are average selling prices (ASPs) declining, and if so, is it a market-wide phenomenon or company-specific?
- Track the unit trend: Are unit shipments rising? If volumes are expanding while ASPs are falling, the business is growing; the revenue line is just masking it.
- Calculate ASP-adjusted revenue: Strip out the price effect by multiplying current-period units by prior-period ASPs. If that number is growing, the demand story is intact regardless of the headline revenue figure.
This framework applies to any component-linked sector. The analytical error of treating price-driven revenue softness as equivalent to demand destruction is one of the most common mistakes in commodity-adjacent equity analysis. Evercore ISI has explicitly noted this dynamic in its analysis: when component costs fall, they can make constrained infrastructure more affordable, drawing in buyers who had previously held back, which supports overall AI infrastructure volumes even as it weighs on individual revenue lines.
Rotation or retreat? Where money is actually moving in AI
The semiconductor sell-off was not an exit from the AI trade. According to desk commentary around the BofA July 2026 survey, it was a repositioning within it.
Capital rotated from component suppliers toward mega-cap technology names and platform companies. The underlying constraint, insufficient memory, insufficient compute, remained the same. What changed was investor preference for which part of the value chain to own.
The distinction that matters: Theme risk asks whether AI spending is real. Expression risk asks which part of the value chain captures it. The July 15 session was an expression-risk event, not a theme-risk event.
This matters because two portfolios with “AI exposure” can behave very differently in the same session, depending on where they sit along the value chain.
| Segment | AI supply constraint exposure | Rotation sensitivity |
|---|---|---|
| Memory and component makers (Micron, etc.) | Direct: supply scarcity is the thesis | High: first to sell in sentiment shifts |
| System integrators (Dell, etc.) | Moderate: affected by component pricing and availability | Moderate: earnings optics sensitive to ASP swings |
| Mega-cap platforms (hyperscalers, software) | Indirect: buyers of constrained supply | Low: rotation destination in risk-off moves |
Knowing where you own the AI theme, through component makers, system integrators, or platform companies, determines how you should respond to exactly this kind of sell-off. The underlying story is the same across all three segments. The volatility profile and valuation sensitivity are not.
What separates a thesis-breaker from a positioning flush
The July 15 episode provides a clean test case for a framework you can apply to the next ambiguous semiconductor headline. Four questions separate a positioning-driven unwind from a genuine fundamental turn:
- Was the catalyst exploratory or executed? CoreWeave was exploring hedges, not executing them. An exploratory action is not a directional signal.
- Is the underlying supply-demand data changing or unchanged? Evercore ISI’s OEM checks showed constraints worsening, not easing. No supply data changed during the session.
- Is positioning extreme enough to amplify ambiguous news? BofA’s survey had already flagged long global semis as the most crowded trade. The setup for mechanical selling was in place before the headline arrived.
- Is the sell-off a rotation within the theme or an exit from it? Capital moved toward mega-cap tech, not out of AI. The theme held; the expression shifted.
On all four counts, the July 15 episode reads as a positioning flush, not a thesis break.
What would actually signal a genuine turn in the memory upcycle? Watch for these:
- A meaningful capacity-addition announcement from a leading DRAM or NAND manufacturer, signalling supply is catching up
- An executed hedge by a major buyer, not an exploration, that signals demand-side expectations of a sustained price collapse
- A material revision to AI capex guidance from hyperscalers, suggesting the spending wave is decelerating
Until one or more of those signals arrives, the framework points to the same conclusion: the price action on July 15 was about positioning, not about the memory cycle.
For investors wanting a systematic framework for sizing and de-risking positions as the supply wave approaches, our dedicated guide to semiconductor cycle investing lays out a five-indicator sequence for capturing peak-cycle gains without holding premium multiples past their expiry date.
The memory upcycle thesis after the dust settles
The weight of verified evidence as of 16 July 2026 is clear. The July 15 semiconductor sell-off was mechanically driven by crowded positioning and a misread catalyst, not by a deterioration in memory supply-demand fundamentals. Evercore ISI’s OEM checks show DRAM and NAND constrained through 2027. Dell’s own management told Evercore the AI supply imbalance will be more acute next year. Evercore maintained its Outperform rating and $500 price target on Dell.
Genuine uncertainty remains. Memory pricing is cyclical. New capacity will eventually come online. The timing of any down-leg is never precise. None of that uncertainty changed on July 15.
Three variables are worth monitoring going forward:
- Hyperscaler AI capex guidance in upcoming earnings cycles
- Any executed (not explored) hedging activity by major memory buyers
- Capacity-addition announcements from leading DRAM and NAND manufacturers
The question is not whether to trust a single analyst or a single survey. It is whether the weight of available primary-source evidence supports treating a one-day, positioning-driven sell-off as an opportunity or as a warning. On the evidence available today, the former case is stronger.
For investors wrestling with how to hold a position through a single-session 8% decline without either panicking or ignoring genuine warning signs, our full explainer on conviction investing through drawdowns covers the pre-written thesis document framework and explicit kill-switch conditions that separate disciplined reassessment from reactive selling.
This article is for informational purposes only and should not be considered financial advice. Investors should conduct their own research and consult with financial professionals before making investment decisions. Past performance does not guarantee future results. Forward-looking statements regarding supply constraints and demand projections are subject to market conditions and various risk factors.