
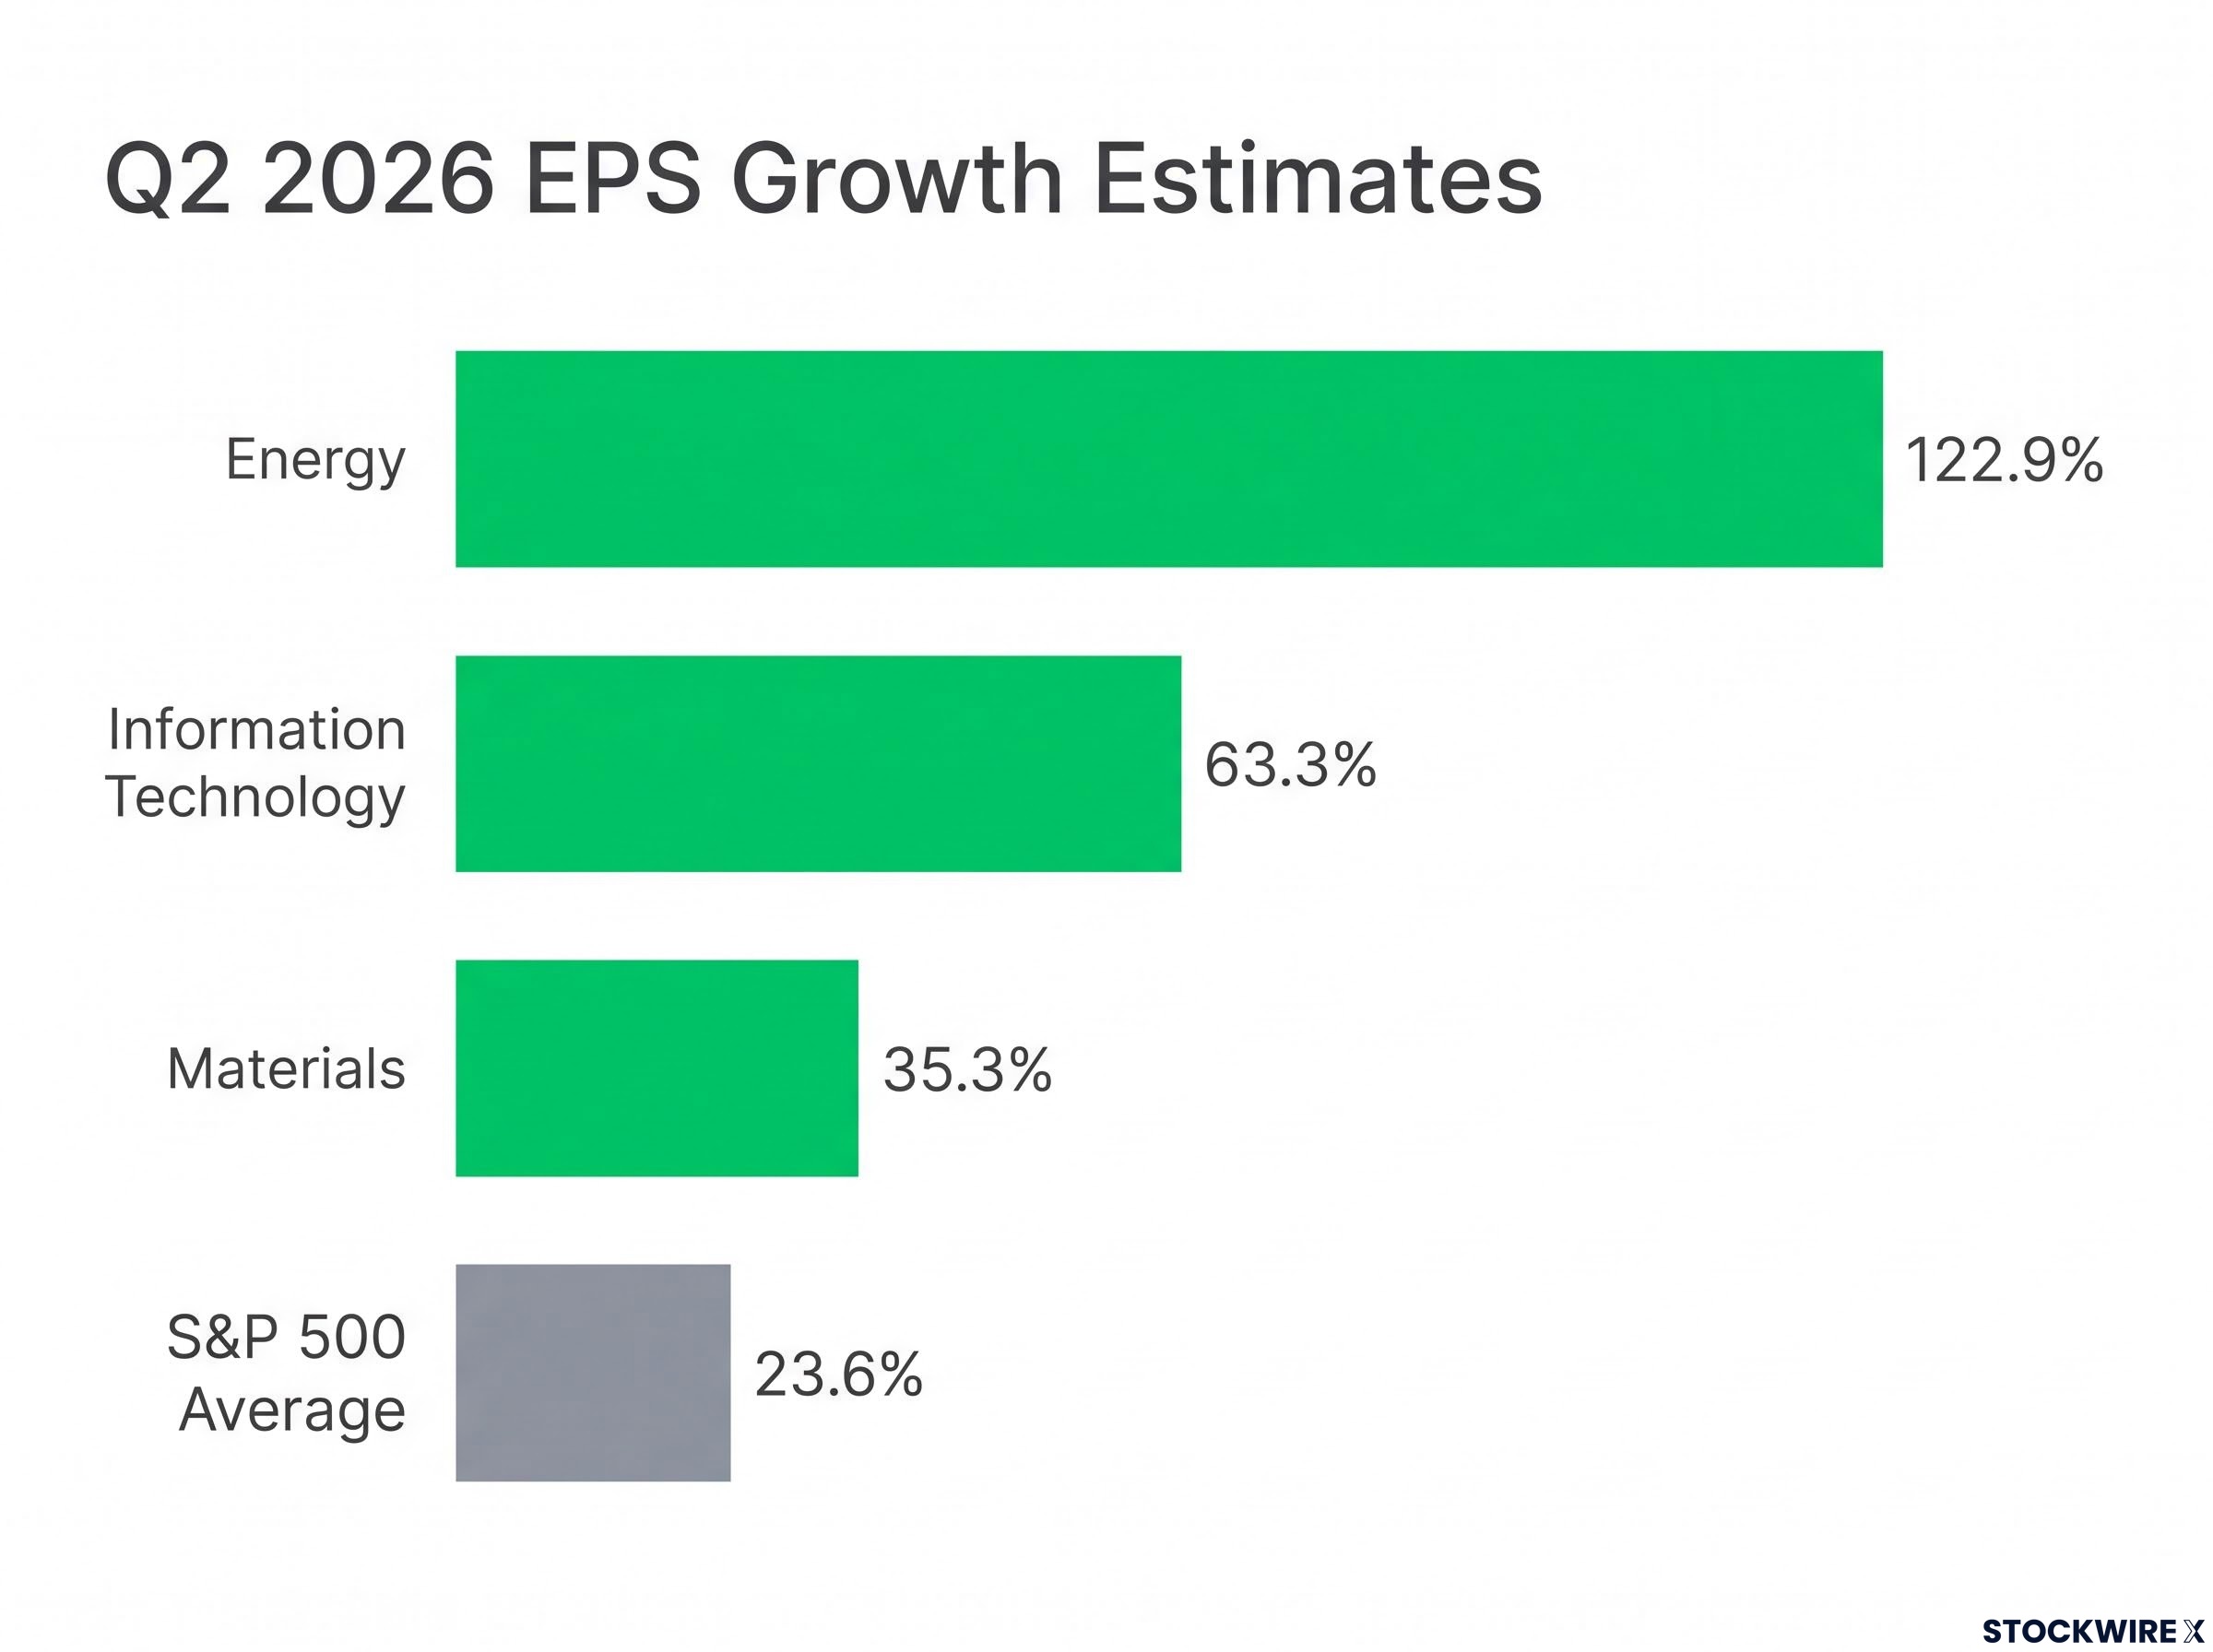
The S&P 500 is tracking 23.6% earnings-per-share growth for Q2 2026. That is the headline number. It is not the story.
Three sectors are running at 35%, 63%, and 123%. The gap between the index average and the leaders is not a rounding error. It is the widest divergence in sector-level earnings power that this market has produced in years, and it tells you that the average is doing more to obscure the picture than to clarify it.
Q2 2026 has become an inflection point. AI investment is being stress-tested against actual reported revenue. Oil markets are rewarding upstream producers at a pace not seen since the last major supply dislocation. And a sector most investors scroll past, Materials, is quietly compounding gains off broad economic demand. The most consequential reports, including Microsoft, Apple, Amazon, Meta, and Nvidia, have not yet landed as of mid-July 2026.
Here is what is driving each sector’s numbers right now, and here are the specific company reports over the next six weeks that will either confirm or crack the current picture.
Why the broader market’s 23.6% growth figure understates the real story
The 23.6% year-over-year EPS growth estimate for Q2 2026, up from 18.8% at the end of March, looks strong on its own. Revenue growth of 12.2% supports it. But the composition underneath that average is where the signal actually sits.
The Q1 2026 earnings season established the pattern now playing out in Q2: a blended growth rate of 27.1%, nearly double pre-season estimates, driven by mega-cap technology outperformance, with analyst conservatism at the start of the quarter producing aggregate surprises roughly three times the five-year average.
Net profit margins offer one layer. At 14.2%, the Q2 estimate sits below Q1’s record 14.8% and yet remains close to two full percentage points ahead of the five-year average of 12.3%. That gap tells you this is not a cost-cutting story. Companies are generating genuine efficiency alongside revenue growth, and that combination is what makes earnings quality durable rather than fragile.
The FactSet Earnings Insight report published July 10, 2026, confirms the blended Q2 2026 earnings growth rate of 23.6%, the upward revision from 18.8% at March-end, and the sector-level positive guidance counts that underpin the divergence documented here.
The second layer is geography. According to FactSet and Vantage Markets analysis, firms in the S&P 500 that generate more than half their revenues internationally are posting earnings growth of approximately 31.4% year-over-year, while those with predominantly domestic revenue are tracking closer to 20.3%. If you hold a name with meaningful international exposure, it is likely outperforming your domestic-heavy positions this quarter, and that differential is worth checking against your own holdings.
| Metric | Figure | Context |
|---|---|---|
| S&P 500 EPS growth (Q2 2026 est.) | +23.6% YoY | Up from +18.8% at March-end |
| S&P 500 revenue growth (Q2 2026 est.) | +12.2% YoY | Broad top-line support |
| Net profit margin (Q2 2026 est.) | 14.2% | Below Q1 record of 14.8% |
| Net profit margin (five-year average) | 12.3% | Current levels well above trend |
| EPS growth: internationally exposed | ~31.4% YoY | Companies with >50% non-U.S. revenue |
| EPS growth: domestically focused | ~20.3% YoY | Companies with predominantly U.S. revenue |
When big ASX news breaks, our subscribers know first
What is actually behind Information Technology’s 63.3% earnings growth
Start with the revenue line. Information Technology is expected to deliver approximately 34.2% year-over-year revenue growth in Q2 2026, making it one of the strongest top-line performers in the index. That matters because revenue growth of that magnitude means the bottom-line expansion is not being manufactured through buybacks or margin engineering alone.
Then look at the guidance data. FactSet reports that IT has the highest number of companies issuing positive EPS guidance of any S&P 500 sector this quarter. The drivers those companies are naming are specific:
- AI workloads accelerating across enterprise customers
- Cloud spending growing as infrastructure buildouts continue
- Data-centre investment expanding to support next-generation compute demand
The most dramatic sub-segment figure comes from semiconductor hardware, where demand is estimated to have risen approximately 131% year-over-year.
Semiconductor hardware demand: ~131% YoY growth (Q2 2026 est.) Source: Vantage Markets analysis by Hebe Chen, published 15 July 2026. This figure has not been independently confirmed and should be treated as indicative until corroborated by upcoming reports from TSMC, AMD, and Nvidia.
That combination of 63.3% EPS growth, 34.2% revenue growth, and the highest positive guidance count in the index tells you something specific: the sector’s elevated valuation is now being backed by concrete fundamental performance rather than forward-looking sentiment alone. Hard revenue figures are doing the work that expectations once did. But the unverified semiconductor figure is a reminder that the confirmation, or contradiction, of these numbers rests with the mega-cap reports still ahead. Nvidia and AMD will either validate the triple-digit hardware demand story or force a recalibration.
Materials: the overlooked sector delivering 35% earnings growth this quarter
In most quarters, 35.3% year-over-year EPS growth would be the lead story. This quarter, it barely registers because Energy is running at 123% and Tech at 63%. That does not make Materials’ result less meaningful. It may make it more so.
What distinguishes Materials from the other two leaders is the breadth of its demand base. No single commodity dominates the story. No single technology theme is driving it. The earnings growth is tied to demand across multiple end markets:
- Industrial production: factory output and manufacturing activity supporting volume growth
- Construction: residential and commercial building activity sustaining raw material demand
- Chemicals and specialty materials: pricing power holding alongside steady volumes
- Packaging and metals: goods output keeping order books full
Some sector previews peg Materials growth in the 30-45% range depending on coverage universe, but the FactSet consensus sits at approximately 35.3%, comfortably above the S&P 500 average.
The durability implication is worth sitting with. Because this strength reflects broad economic health rather than one catalyst, Materials may be more insulated from sector-specific reversals. It also makes the sector a useful leading indicator. If Materials growth holds into Q3, it is evidence that underlying economic demand is genuinely healthy across multiple industries. If it softens, that early warning will likely arrive here before it shows up in Tech or Energy results.
The Materials sector outlook carries structural support beyond one quarter’s demand data: Bank of America’s Michael Hartnett frames the sector’s near 30-year low of 2% S&P 500 weighting as a contrarian opportunity, with four non-correlated demand drivers including AI infrastructure spending, defence budgets, a U.S. housing deficit, and yuan appreciation converging simultaneously.
Energy’s 122.9% earnings jump: separating operational gains from favourable comparisons
122.9% year-over-year EPS growth is a number that demands attention. The Energy sector earned the largest upward estimate revision of any S&P 500 sector during the quarter, and the result, if confirmed, would make it the clear earnings leader for Q2 2026.
What drove the number
Two forces produced this figure, and separating them matters. The first is the base effect. Q2 2025 earnings were depressed by softer commodity prices and margin compression. EPS growth is a percentage-change calculation, which means even moderate absolute improvement against a weak prior-year quarter generates outsized headline gains.
The second is genuine operational strength. Crude oil trading in the $80-$87 per barrel range, combined with supply disruptions rooted in Iranian geopolitical tensions, has supported refining margins and integrated oil and gas cash flows. The sub-industries leading the charge are specific:
The oil supply shock underpinning Energy’s triple-digit earnings growth has structural features that make the base-effect argument incomplete: Saudi Arabia’s crude output fell to its lowest level since 1990, global inventories were drawing at more than double the record pace recorded in March and April, and the IEA projected no supply-demand rebalancing before October 2026.
- Oil and Gas Refining and Marketing: benefiting from wide crack spreads and tight product markets
- Integrated Oil and Gas: cash flow generation supported by both upstream prices and downstream margins
- Exploration and Production: upstream producers capturing full benefit of the elevated price environment
What the number actually means going forward
The base-effect dynamic is the part investors need to interrogate. Triple-digit growth off a depressed base is real in accounting terms, but it tells you more about last year’s weakness than this year’s strength. If oil prices retreat from the $80-$87 range or geopolitical conditions normalise, the comparisons get harder in Q3 and operational improvements alone may not sustain the headline rate. The question is whether this is a sector to add exposure to, or a quarter-specific windfall that warrants caution on forward positioning.
The earnings calendar: what each major report will actually tell you
Over the coming six weeks, from 15 July through 26 August, each cluster of company results serves as a distinct checkpoint, probing a specific part of the earnings story and determining whether the numbers currently on the board can be defended.
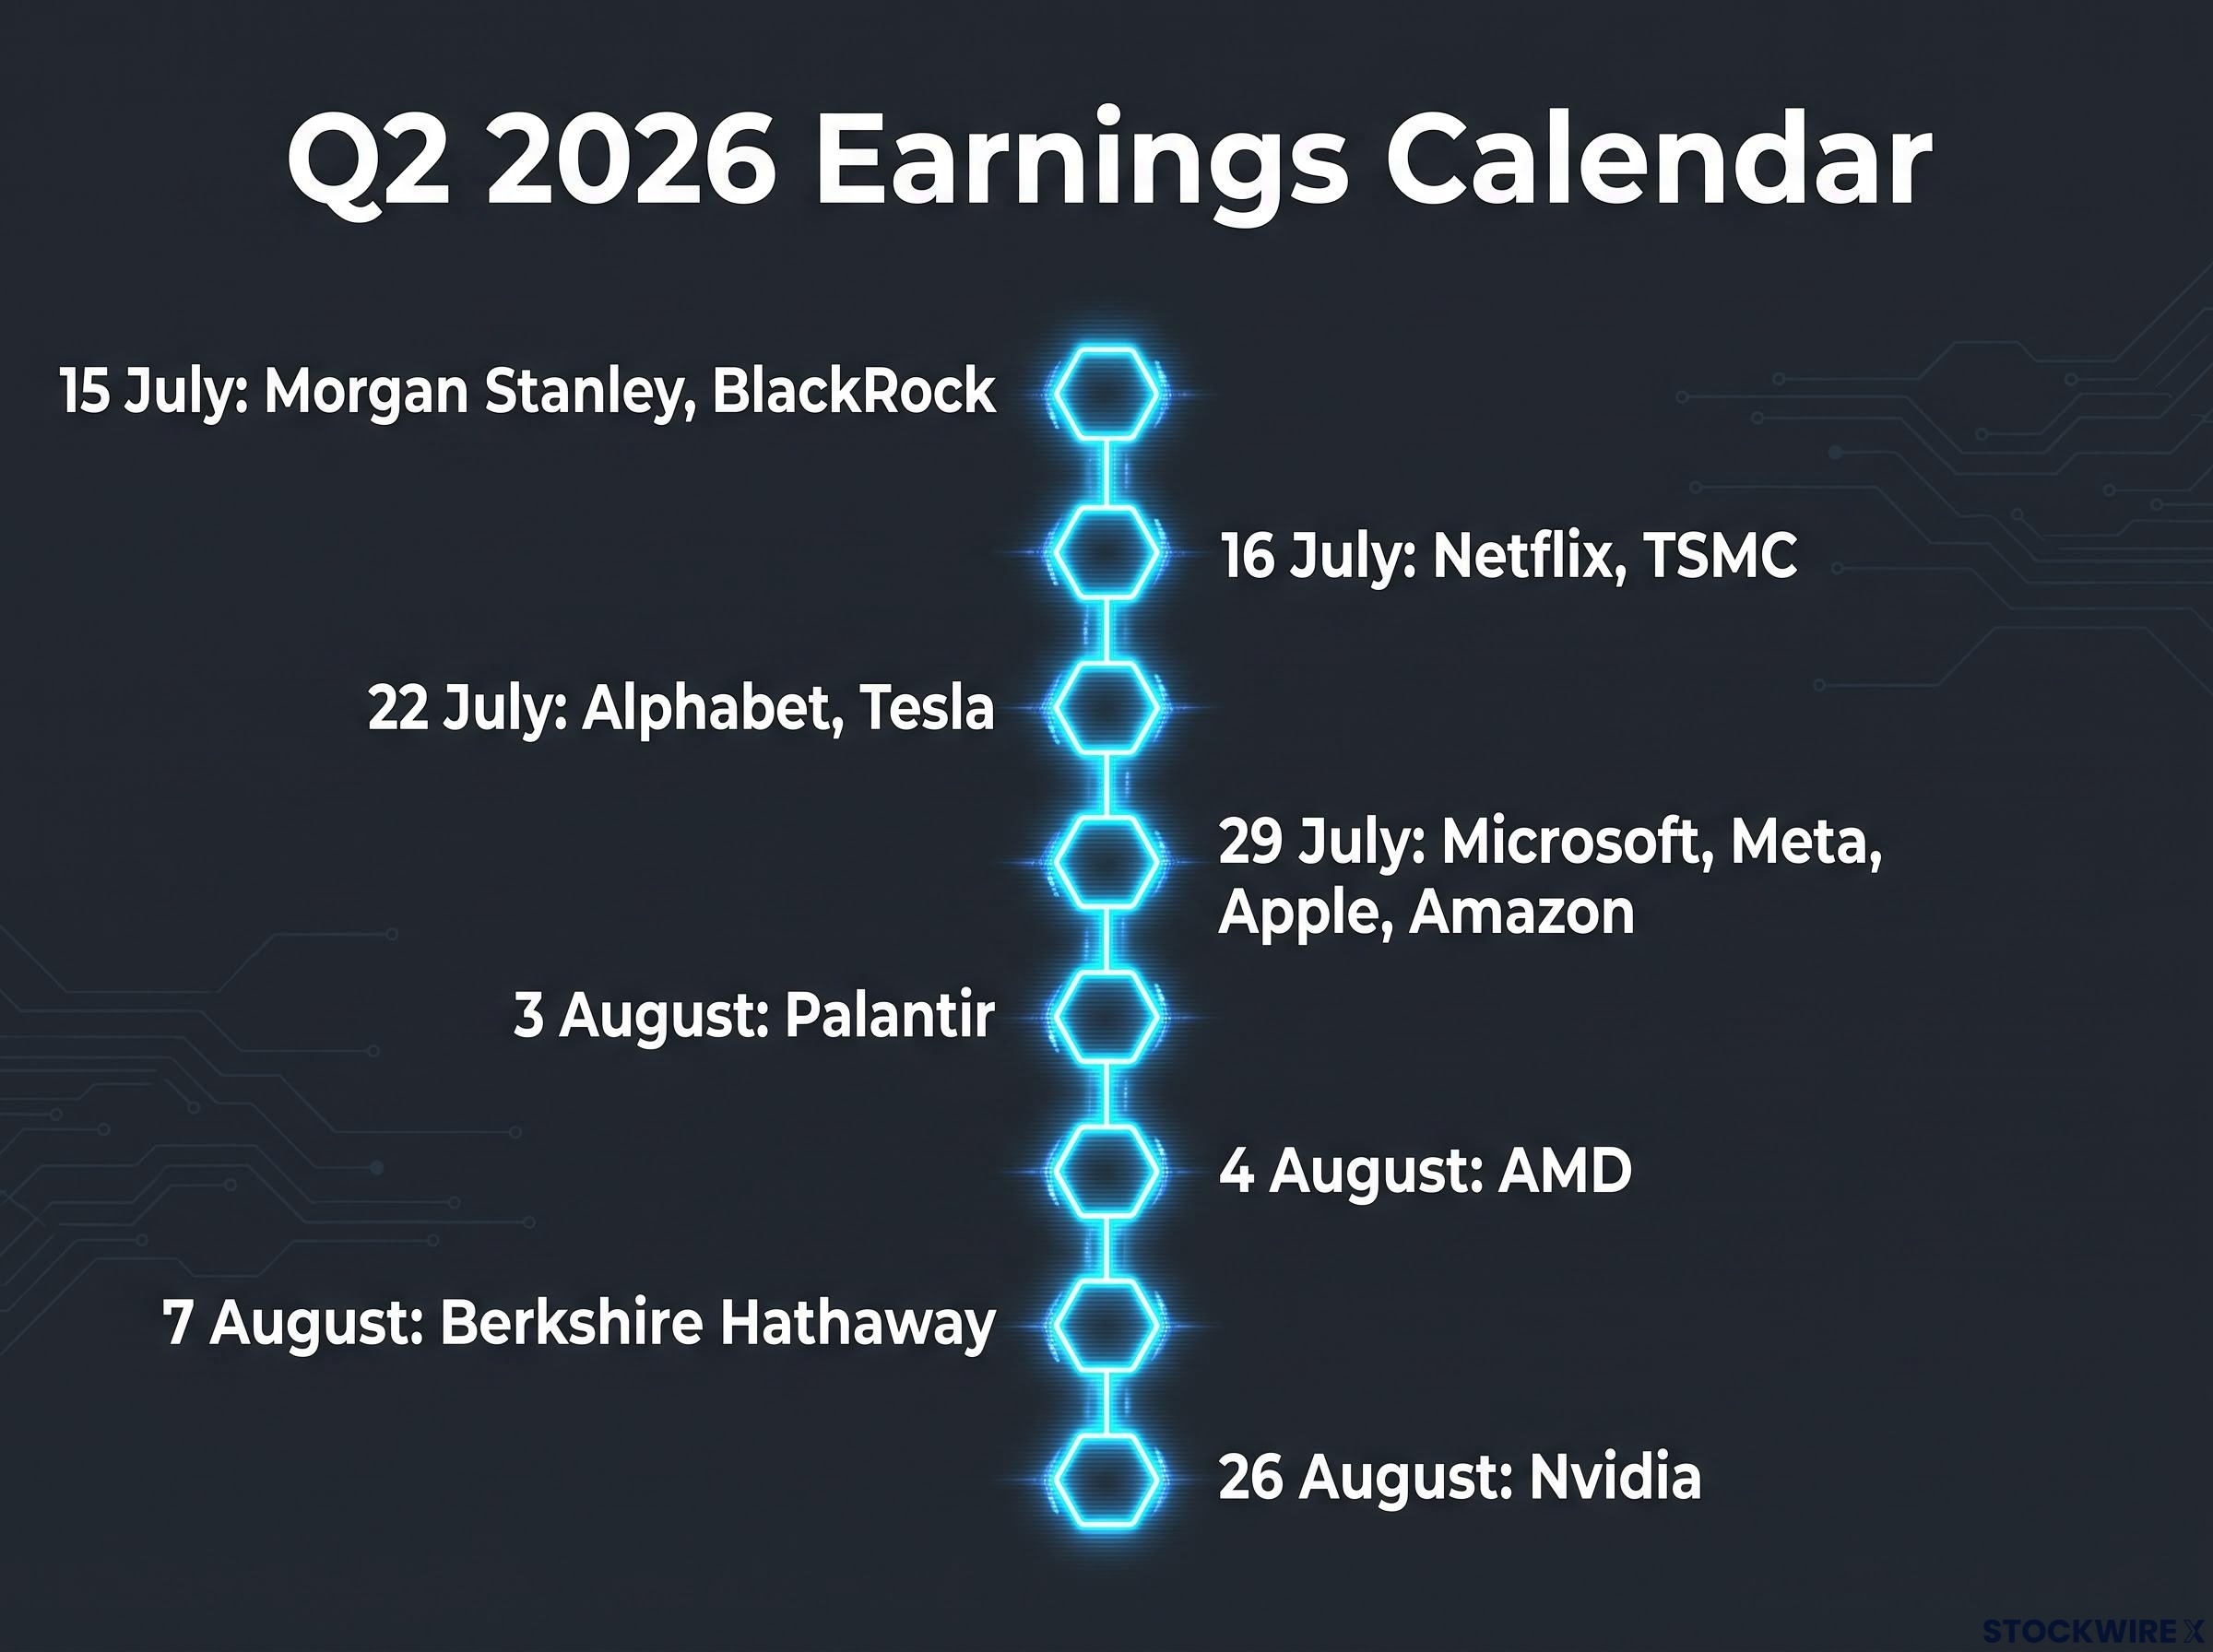
| Date | Companies reporting | What it tests | Why it matters |
|---|---|---|---|
| 15 July | Morgan Stanley, BlackRock | Capital markets activity and asset-management flows | Early read on Financial sector health and fee trends |
| 16 July | Netflix, TSMC | Streaming demand; global semiconductor fabrication | TSMC provides the first independent read on AI chip demand |
| 22 July | Alphabet, Tesla | Digital advertising, cloud, early AI monetisation; EV demand | First mega-cap Tech name; cyclical consumer read from Tesla |
| 29 July | Microsoft, Meta, Apple, Amazon | Azure and AI metrics; AWS; iPhone and services; ad efficiency | Single-day concentration of enormous index weight |
| 3 August | Palantir | AI-software monetisation; government and commercial analytics | Tests whether AI demand extends beyond hardware into software |
| 4 August | AMD | AI and data-centre chip breadth beyond Nvidia | Confirms or narrows the semiconductor boom’s scope |
| 7 August | Berkshire Hathaway | Insurance, rail, utilities, industrials | Cross-section of underlying U.S. economic demand |
| 26 August | Nvidia | AI infrastructure supply, margins, forward guidance | The closing argument for the AI hardware investment cycle |
29 July concentrates Microsoft, Meta, Apple, and Amazon on a single day. Their combined index weight means this is not routine reporting. It is a binary risk event for the Tech-led earnings narrative. A clean sweep confirms the AI investment thesis has fundamental grounding. A miss from any one of them shifts the revision direction for the sector.
Index concentration risk compounds the sector divergence problem: roughly 20 stocks account for the majority of S&P 500 earnings outperformance this season, and Goldman Sachs projects global AI data-centre capex could reach $350 billion annually by 2028 while equity upside remains confined to fewer names than most investors realise.
Nvidia’s report on 26 August is the closing argument. Guidance on supply constraints and forward margins will matter as much as the headline EPS number, because the market is not just pricing what Nvidia earned; it is pricing what Nvidia’s customers are committed to spending next.
Three questions that will define the rest of the earnings season
The sector-level numbers, 122.9% for Energy, 63.3% for Tech, 35.3% for Materials, are benchmarks now. The upcoming reports will either defend or dismantle them. Three specific questions structure what to watch:
- Can Energy sustain earnings without the base effect? If oil prices retreat from the $80-$87 range or geopolitical tailwinds normalise, operational discipline alone must carry the result. The comparisons get harder in Q3.
- Do the mega-cap Tech reports validate AI-driven revenue? Microsoft, Amazon, Alphabet, and ultimately Nvidia need to show that AI workloads are generating durable, reportable earnings growth, not just capital expenditure commitments.
- Does Materials’ broad demand base hold into Q3? If industrial and construction indicators soften, this sector will signal the slowdown before it appears in the index average.
If all three resolve positively over the next six weeks, the 23.6% index-level growth estimate is likely to move higher. The March-end figure was 18.8%; the upward revision trend has room to continue. If any one of the three cracks under reporting pressure, the revision direction flips, and investors who have mapped their exposure to sector-specific drivers rather than the index average will be better positioned to respond.
This article is for informational purposes only and should not be considered financial advice. Investors should conduct their own research and consult with financial professionals before making investment decisions. Past performance does not guarantee future results. Financial projections are subject to market conditions and various risk factors.