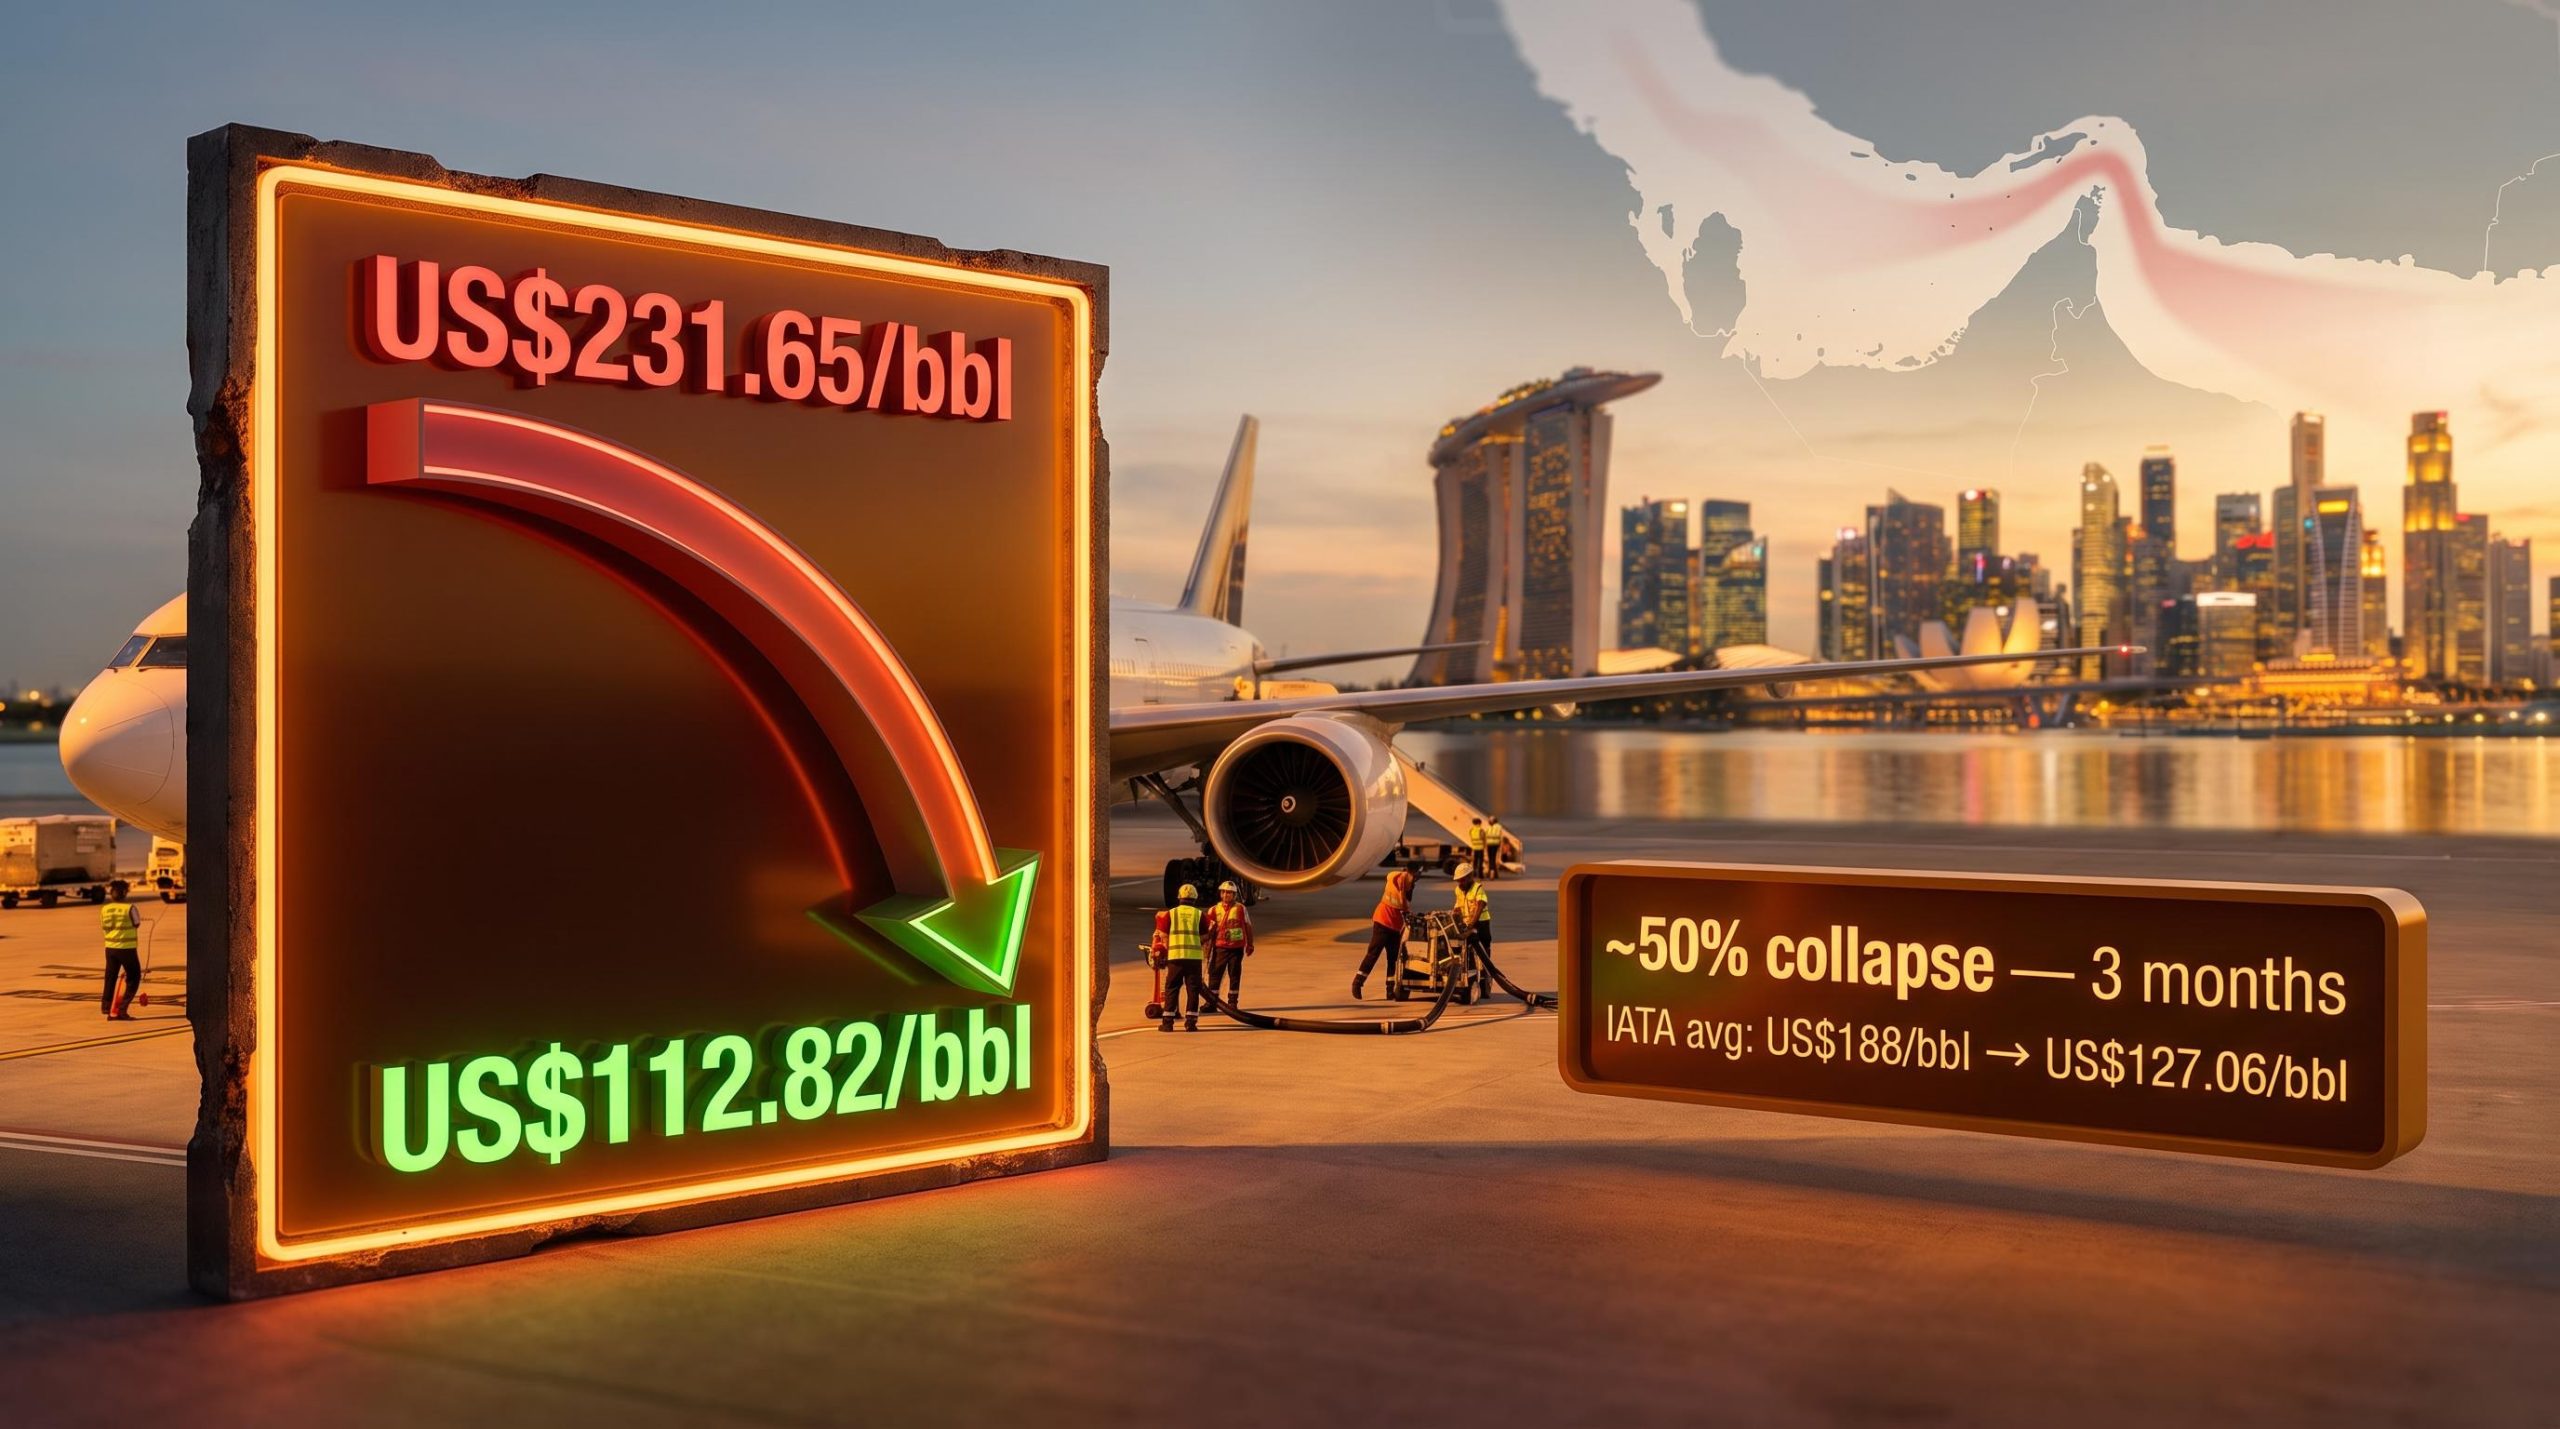
Singapore jet fuel peaked above US$230/bbl in early April 2026. By mid-July 2026, it had fallen to roughly US$115/bbl. That is not a gradual easing. That is a collapse of nearly 50% in three months, one of the sharpest corrections in modern aviation fuel markets.
The driver of the spike was the US-Iran conflict and the effective closure of the Strait of Hormuz, which sent crude briefly above US$120/bbl and jet fuel to levels no airline had budgeted for. The driver of the correction was diplomatic signalling, not a physical restoration of supply. That distinction matters, because it tells you the recovery is contingent rather than structural.
Here is what the data actually tells you about the fuel cost environment shaping airline performance in 2026: where prices stand now, why the correction does not end the story for carriers, and what the jet fuel price means for your assessment of Asia aviation equities right now.
From US$83 to US$231 in six weeks: how the Iran crisis moved jet fuel
The speed of the move is what matters most. Before the crisis, jet fuel was quiet. Then it was not.
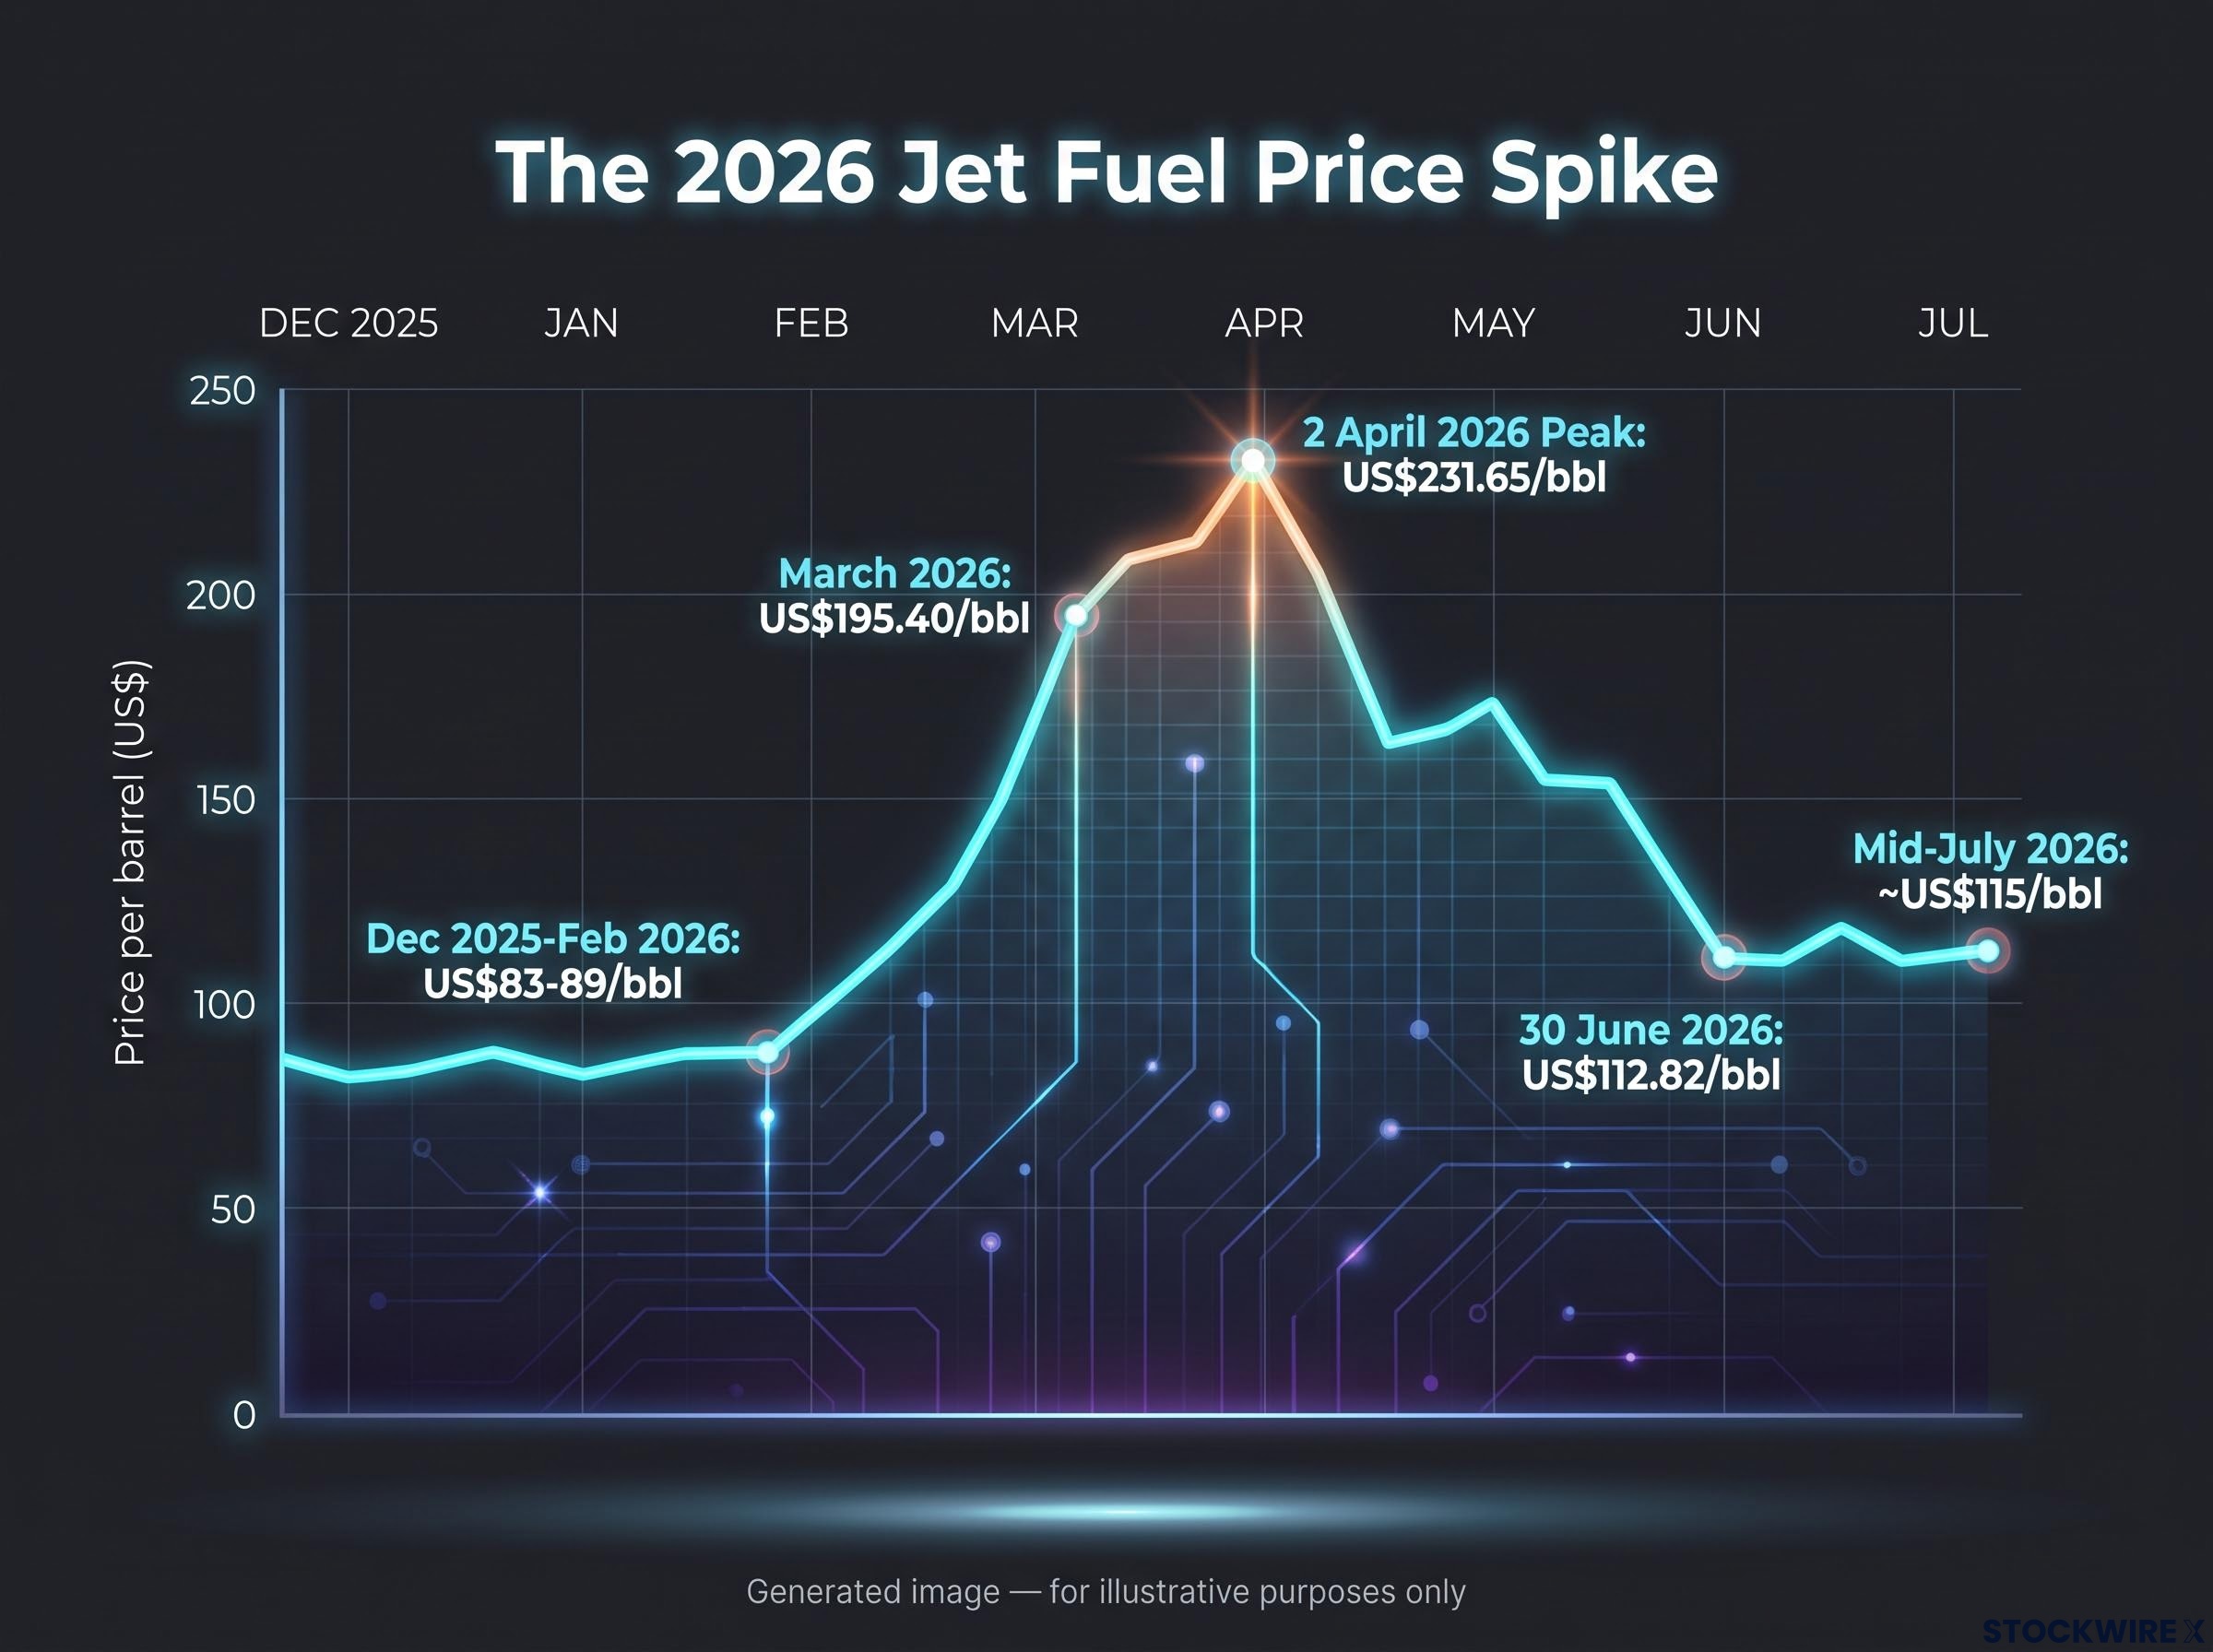
- December 2025 to February 2026: Singapore FOB jet fuel traded in the US$83-89/bbl range, a stable baseline consistent with the prior year’s average of roughly US$90/bbl
- March 2026: Platts assessed the FOB Singapore average at US$195.40/bbl, more than double the February level
- 2 April 2026: The intraday peak hit US$231.65/bbl
- April 2026: IATA’s global average reached US$188/bbl
Crude oil briefly exceeded US$120-125/bbl at the worst of the crisis. But the jet fuel premium above crude told a sharper story.
The Hormuz closure removed an estimated 10.8 million barrels per day from global supply at its peak, a figure that no combination of bypass pipelines or alternative producer outflows could absorb, which is precisely why the jet fuel premium above crude reached levels with no modern precedent.
In late March 2026, the Platts FOB Singapore jet fuel premium hit a record US$42.40/bbl above crude, the widest spread ever recorded for the benchmark.
That premium is the single most telling data point in this sequence. A US$42/bbl premium above crude means markets were not just pricing a supply disruption. They were pricing the fear of a supply disruption, the possibility that Hormuz access could be lost entirely and that refineries would not be able to source enough crude to produce jet fuel at all. When you see a premium that extreme, you are looking at a market driven by worst-case scenario pricing, not by the physical reality of barrels in or out of storage. That distinction matters because fear-driven premia can evaporate in weeks once the worst case recedes, which is exactly what happened.
When big ASX news breaks, our subscribers know first
What actually drove the correction, and why that matters
The correction from US$231/bbl to roughly US$115/bbl was dramatic. But the cause of the correction tells you more than the size of it.
Three distinct factors drove prices lower:
- Diplomatic signalling: Easing US-Iran tensions and expectations of reduced risk to Strait of Hormuz access unwound the geopolitical risk premium that had been the largest single component of the spike
- Substitute supply: Increased outflows from alternative producers, including Nigeria, helped offset lost Middle Eastern volumes and reduced the severity of worst-case shortage scenarios
- Demand destruction: At peak prices, some demand simply disappeared as airlines and freight operators curtailed consumption
The diplomatic factor did the heaviest lifting. IATA’s global average fell from US$188/bbl in April to US$158/bbl in May 2026. By 30 June 2026, the Singapore flat price had dropped to US$112.82/bbl (Spartacommodities), and the IATA global average stood at US$127.06/bbl. Fuel surcharges on international routes fell more than 20% for July 2026 as diplomatic signals emerged.
The Hormuz risk premium is not a binary switch that flips off when diplomacy progresses; VLCC daily hire rates tracking at approximately $110,000 per day and war-risk insurance withdrawals reflect a physical market still pricing meaningful disruption probability even as headlines turn more optimistic.
The mechanism here is what you need to internalise. Because the correction is driven by risk premium deflation rather than restored physical supply, any setback in US-Iran diplomatic progress could rebuild a substantial portion of the premium within days, not months. The Strait of Hormuz has not fully normalised. The substitute supply flows from alternative producers remain the bridge, not a permanent solution. If you are holding aviation positions, you should be pricing that tail risk explicitly rather than treating the current level as a floor.
Understanding jet fuel pricing: why spot moves do not translate directly into airline costs
This is where many investors draw the wrong conclusion. They see spot jet fuel fall 50% from peak and assume airline margins are recovering at the same rate. The relationship is real, but it is slower and messier than a one-to-one pass-through.
Spot jet fuel prices and airline fuel costs are related but not identical. The gap exists because of two mechanisms. First, hedging: airlines lock in fuel prices in advance at strike levels that may differ substantially from current spot. A carrier that hedged aggressively near the March-April peak is paying an effective fuel cost far higher than today’s spot price, and that locked-in cost will persist until those hedge contracts roll off. Second, fuel surcharges: airlines pass a portion of fuel costs through to passengers, so when spot prices fall, carriers reduce surcharges rather than pocketing the entire saving as margin.
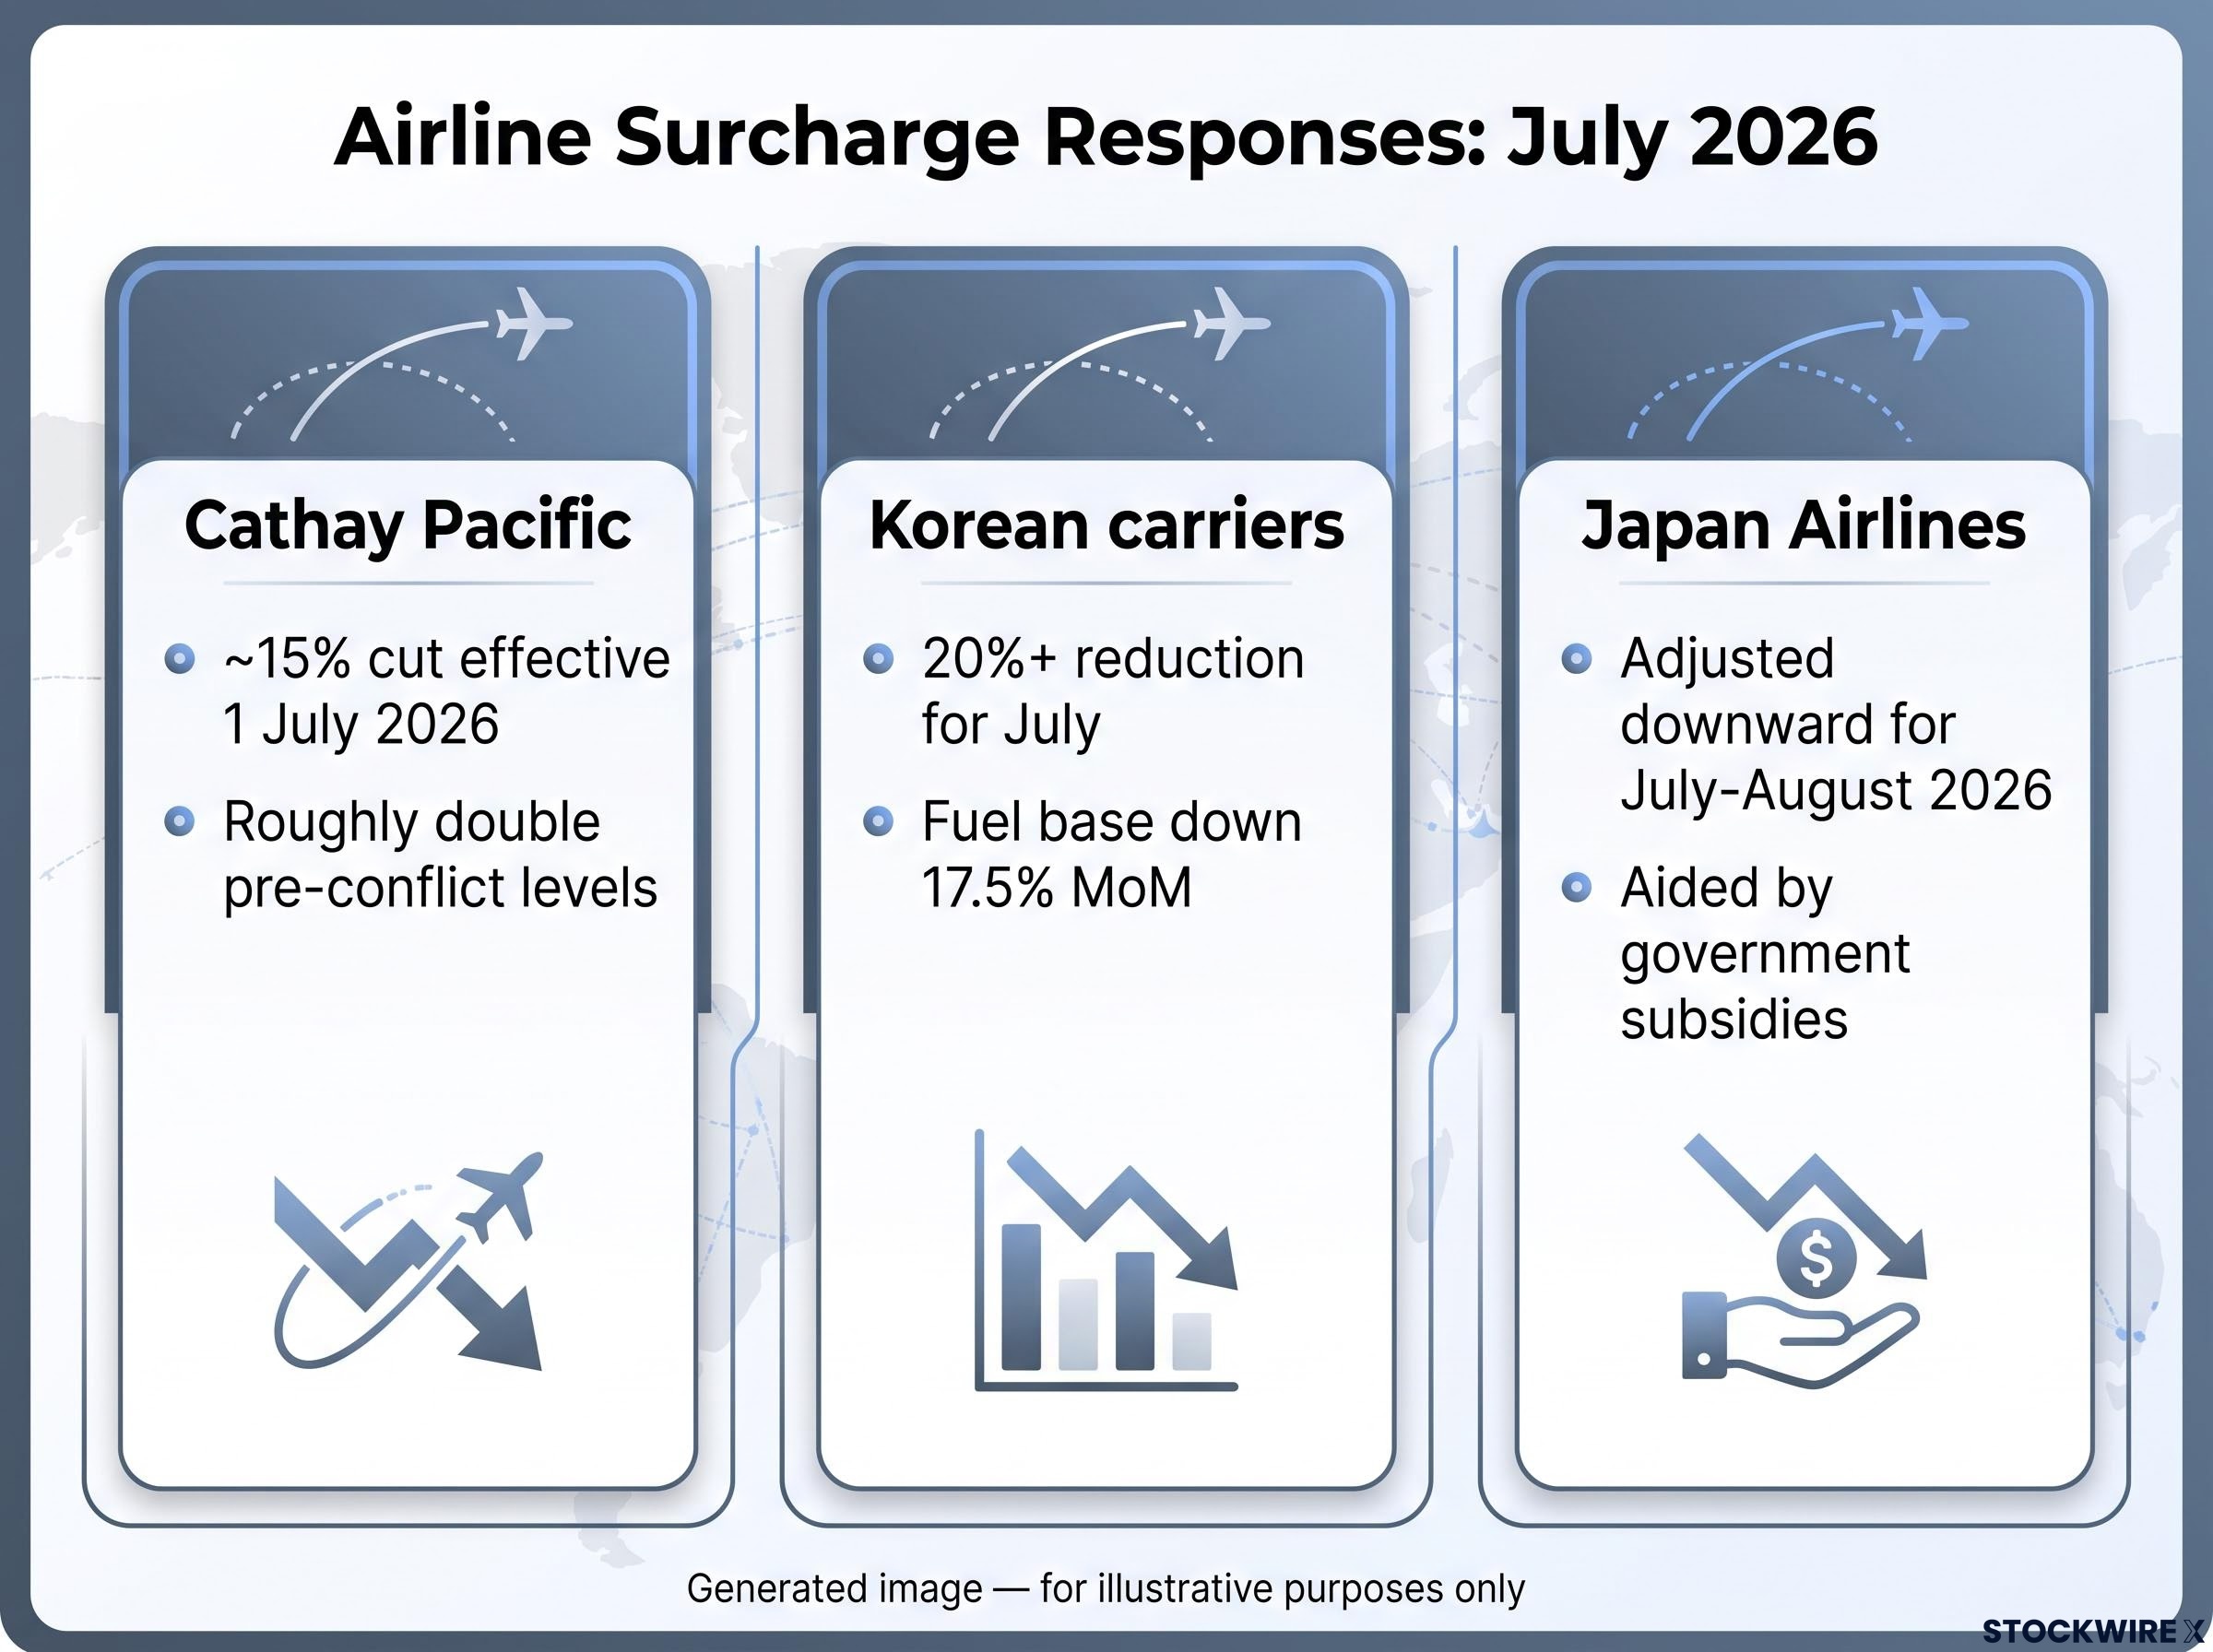
The surcharge data illustrates both the relief and its limits.
| Carrier | Surcharge change | Current vs. pre-conflict | Notable caveat |
|---|---|---|---|
| Cathay Pacific | Approximately 15% cut effective 1 July 2026 | Roughly double pre-conflict levels | Returned to mid-March levels only |
| Korean carriers | 20%+ reduction for July international flights | Fuel prices used for calculation down 17.5% month-on-month, 33.8% vs. two months earlier | Surcharges still well above pre-crisis baseline |
| Japan Airlines | Surcharge zones adjusted downward for July-August 2026 | Still elevated versus late 2025 | Aided by government subsidies tied to the Middle East situation |
The pattern across all three is the same: real relief, but nowhere near a return to normal. Carriers are passing surcharge reductions to passengers faster than the spot decline flows through to margins, which means the earnings benefit of falling fuel prices is diluted by the competitive pressure to lower fares.
Singapore’s Civil Aviation Authority postponed its Sustainable Aviation Fuel (SAF) levy by six months, explicitly citing that fuel prices had “more than doubled” during the spike. The levy has been deferred, not cancelled, underscoring that structural cost obligations remain in place for carriers even after spot relief.
The CAAS SAF levy deferral announcement confirmed that the postponement was directly tied to the impact of Middle East conflict on airlines and passengers, while reaffirming that Singapore’s decarbonisation commitment remains intact, meaning the cost obligation will return once conditions stabilise.
The practical takeaway for you: do not assume falling spot prices equal rising earnings on a one-for-one basis. The hedging book, the surcharge strategy, and the timing of each determines how much of the macro tailwind actually reaches the income statement.
The incomplete recovery: where jet fuel prices actually stand
The correction is real. It is also incomplete. Both of those facts are true simultaneously, and if you only hold one of them, you will misread the environment.
| Benchmark | Pre-conflict level | Current level (late June/July 2026) |
|---|---|---|
| Singapore Platts FOB | US$83-89/bbl (Dec 2025-Feb 2026) | US$112.82/bbl (30 June 2026) |
| IATA global average | Approximately US$90/bbl (2025 average) | US$127.06/bbl (late June 2026) |
| European jet fuel | Approximately US$800/mt (pre-conflict estimate) | Below US$1,200/mt (late June 2026), still approximately 50% above pre-war levels |
| Full-year 2025 average | Approximately US$90/bbl | Sitting roughly **33%** higher than this pre-crisis benchmark |
Despite a 35-50% decline from crisis highs, prices remain approximately 40-70% above the December 2025 to February 2026 pre-conflict range, depending on which benchmark you use. European markets show the same pattern: Argus reports prices fell below US$1,200/mt in late June, the lowest since the conflict began, but the market remains characterised as “undersupplied.”
Three discrete factors sustain the elevation:
- Physical market tightness: Substitute supply from non-Middle Eastern producers has not fully replaced lost volumes, keeping the underlying supply-demand balance constrained
- Residual geopolitical risk premium: Markets continue to price some probability of renewed disruption, which keeps prices above where pure supply and demand fundamentals would place them
- Refining and logistics vulnerability: Unplanned refinery outages or port disruptions can amplify price spikes in already-tight markets, and that fragility is reflected in the current price structure
For you as an investor, the correct frame is not “prices have crashed” but “prices have partially normalised into a still-expensive range.” The difference between those two readings determines whether current airline equity valuations are justified or whether they are pricing in a return to normal that has not actually occurred.
What the geopolitical risk premium means for the outlook from here
Everything described so far is backward-looking. The investment question is forward-looking, and the honest answer is that the range of plausible outcomes is unusually wide.
The key risk factors to watch:
- US-Iran diplomatic timeline: Any setback in talks could rebuild the risk premium rapidly; Phillip Securities Research explicitly flags this as the key downside scenario for the sector
- Hormuz transit normalisation: The Strait has not fully normalised, and substitute supply flows remain the bridge
- Refinery outage risk: Unplanned outages in an already-tight market could amplify any renewed geopolitical shock
- SAF levy reinstatement: Singapore’s deferred levy will eventually return, adding structural cost regardless of spot prices
Phillip Securities Research holds a neutral view on the Asia air transportation sector as of July 2026, citing geopolitical uncertainty as the binding constraint on a more positive rating.
IATA characterises current conditions as “still elevated and highly volatile.” That assessment aligns with what the data shows.
For investors wanting to understand how the diplomatic timeline translated directly into equity price moves across the region, our full explainer on the US-Iran truce and its market impact covers the 60-day Hormuz reopening window, the deferred nuclear negotiating track, and why Washington reserved the right to resume strikes.
The speed of the original spike is itself the most important data point for thinking about what comes next. A market that moved from approximately US$85/bbl to US$231/bbl in roughly six weeks on fear alone can move in either direction at comparable velocity. If diplomatic progress consolidates and Hormuz access normalises, prices could continue drifting toward pre-conflict levels, though structural factors such as refining capacity and SAF obligations would limit how far they fall. If diplomacy stalls, the premium can rebuild before most portfolio rebalancing processes can respond.
The implication for your positioning is straightforward: any aviation position sized without accounting for that full range of outcomes is undersized for the actual risk.
What investors should actually be looking for in Asia aviation equities now
The fuel price environment is necessary context but not sufficient for investment decisions. The outcome at the carrier level depends on four variables, and they differentiate winners from losers far more than the macro fuel trajectory.
| Variable | What to look for | Why it matters |
|---|---|---|
| Hedging position | Extent, tenor, and strike levels of fuel hedges relative to current spot | Carriers hedged near the peak face a lag before spot relief flows through to effective fuel costs; lightly hedged carriers benefit faster but carry more upside risk |
| Surcharge strategy | Whether elevated surcharges are sticky as fuel costs fall, or whether competitive pressure forces rapid pass-through to passengers | Carriers passing relief faster than spot warrants may be sacrificing margin to retain load factors |
| Balance sheet strength | Cash reserves, debt levels, and liquidity buffers | Capacity to absorb renewed volatility without financial distress if the risk premium rebuilds |
| Route mix | Proportion of short-haul leisure versus long-haul premium demand | Short-haul leisure travellers are more price-sensitive to surcharges; long-haul premium demand is more resilient |
The Phillip Securities Research neutral sector stance reflects a judgement that a sector-level bullish call is not supported at current fuel levels and geopolitical conditions. But individual carrier differentiation is material. A carrier with a clean hedging book, sticky surcharges, and a strong balance sheet is in a fundamentally different position from one carrying peak-priced hedges into a declining spot market while cutting fares to fill seats.
The earnings leverage to falling fuel prices varies dramatically across carriers: UBS data shows a $0.10 per gallon decline boosts American Airlines’ projected 2027 EPS by approximately 16%, more than three times the roughly 4.5% impact on Delta, a gap that reflects the structural difference between a carrier with an active hedge book and one without.
The practical implication: read carrier hedging disclosures and surcharge announcements as the leading indicators of earnings trajectory. Do not simply track the spot fuel price and assume a uniform sector response.
A partial relief in an unresolved market
Jet fuel prices have corrected materially from crisis highs, falling approximately 50% from peak. That is a real and significant improvement for airline cost structures. It is also not the end of the story.
Prices remain approximately 33% above the 2025 average of roughly US$90/bbl. The correction was driven by diplomatic signalling and fear-premium deflation, not by a physical restoration of supply. The geopolitical risk premium can rebuild as fast as it deflated if US-Iran diplomatic progress stalls.
The SAF levy deferral in Singapore is a reminder that structural cost obligations will return even if geopolitical risk fades. The deferred levy has not been cancelled; it has been postponed. The cost environment is not fully resolved even in the optimistic scenario.
The investor’s task from here is not to call the direction of jet fuel. It is to assess which individual carriers are best positioned to navigate a range of outcomes, from continued easing to renewed spike, through their hedging books, pricing power, and balance sheet resilience. The key variable to watch is whether US-Iran diplomatic progress translates into a lasting reduction in Hormuz risk premium, which will determine whether the current price level is a floor or a ceiling.
This article is for informational purposes only and should not be considered financial advice. Investors should conduct their own research and consult with financial professionals before making investment decisions. Past performance does not guarantee future results, and financial projections are subject to market conditions and various risk factors.